
Remember me


To overcome autofluorescence and enable precise imaging and spatial analysis of FFPE tissue samples—the most common type of specimens available in brain banks—we developed the CODEX-CNS workflow (Fig. 1a). We modified the standard CODEX protocol by adding a pretreatment step to remove autofluorescence, which involved incubating FFPE tissue sections in a 4.5% H2O2 bath while exposing it to a broad-spectrum LED light (Supplementary Fig. 1a). The intense autofluorescence and visible lipofuscin particles that untreated FFPE brain tissues present (Supplementary Fig. 1b, upper panel) were considerably reduced after employing the CODEX-CNS autofluorescence reduction treatment (Supplementary Fig. 1b, lower panel). Thus, an increase in the signal-to-noise ratio was detected in treated samples compared to untreated adjacent sections, using the same antibodies, imaging channels and exposure times (Supplementary Fig. 1c). All data subsequently presented in this study were acquired using the CODEX-CNS protocol on FFPE frontal cerebral cortex samples (Supplementary Tables 1 and 2). In this study, a total of 16 samples were analyzed using the CODEX-CNS protocol. Initially, we profiled eight samples (four patients with AD versus four healthy controls), followed by validation of our findings in an independent cohort of eight additional samples (four patients with AD versus four healthy controls) using CODEX-CNS. To further confirm our results, we performed conventional IF on 35 samples across two independent laboratories. One of these IF cohorts closely matched the original CODEX-CNS samples, whereas the other represented a distinct, unrelated cohort. Altogether, the study included 51 samples, comprising 26 AD and 25 healthy control samples (Supplementary Tables 1, 2 and 3).
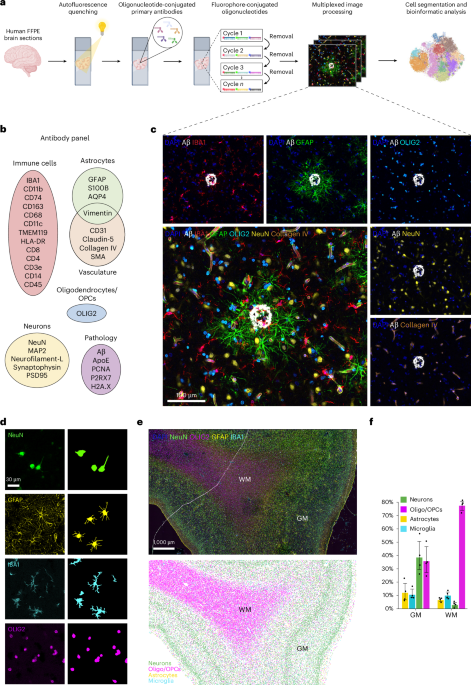
Fig. 1: CODEX workflow for neuroscience applications. The alternative text for this image may have been generated using AI.
a, Schematic overview of CODEX technology and computational analyses performed in FFPE human brain samples. b, Custom 32-plex oligonucleotide-conjugated antibody panel designed to detect protein markers for distinct modules: immune cells, astrocytes, oligodendrocytes/OPCs, neurons and blood vessels, as well as proteins associated with neuropathology. c, Representative fluorescent images showing markers from each antibody module in the same brain tissue section of the human frontal cerebral cortex from a patient with AD. Image is representative of n = 4 AD samples included in the initial analysis. d, Individual fluorescent staining of different brain cell types (left) and their corresponding cell masks (right) using a machine learning segmentation approach. Images are representative of n = 4 AD samples and n = 4 healthy control samples analyzed in 7 independent experiments. e, Representative tissue image showing DAPI, NeuN (neurons), OLIG2 (oligodendrocytes/OPCs), GFAP (astrocytes) and IBA1 (microglia) fluorescent staining (top panel) and its corresponding spatial map showing the localization of segmented neurons, oligodendrocytes/OPCs, astrocytes and microglia (bottom panel) in the healthy human frontal cerebral cortex. Each dot represents one segmented cell. Note the distinction between WM and GM areas, as well as different cortical layers. f, Proportions of the main brain cell types in the GM and WM areas of the human frontal cortex (n = 4). Box heights indicate mean values per region and cell type group; error bars: 95% confidence intervals. Panel a created in BioRender; Rosmus, D. https://biorender.com/eihz1yz (2026).
We designed a panel of 32 antibodies to target neurons, glia, cerebral vasculature, peripheral immune cells and pathological features related to AD for use in CODEX-CNS (Fig. 1b, Supplementary Fig. 2 and Supplementary Table 4). As a proof of concept, neurons, astrocytes, oligodendrocytes, oligodendrocyte precursor cells (OPCs), microglia, blood vessels and Aβ plaques were identified in the same tissue section, confirming that CODEX-CNS can detect several cell populations and noncellular structures simultaneously in archival FFPE brain tissue samples (Fig. 1c). Consistent with the known anatomy of the human cerebral cortex, our imaging data clearly distinguished between gray matter (GM) and white matter (WM) regions (Extended Data Fig. 1a–l), as well as stratifications between different cortical layers (Extended Data Fig. 1a–d). We were also able to visualize components of the blood–brain barrier in detail by the presence of astrocytic end-feet in contact with the vasculature (Extended Data Fig. 1m, arrowheads), collagen IV in the basement membrane (Extended Data Fig. 1n), pericytes or vascular smooth muscle cells (Extended Data Fig. 1o, arrows) and endothelial cells containing tight junctions marked by claudin-5 (Extended Data Fig. 1p). Furthermore, simultaneous imaging of markers specific to blood vessels, immune cells and astrocytes allowed for the visualization of the meningeal membranes: the pia and the arachnoid mater, as well as the glia limitans superficialis, which is in contact with the pial surface30 (Extended Data Fig. 1q–t). These data provide a striking example of how CODEX-CNS offers sufficient imaging resolution to visualize the CNS cytoarchitecture. However, current nuclear segmentation approaches are insufficient to capture morphologically complex brain cells, whose processes are not registered properly within the circumference of the nucleus segmentation mask. Therefore, the large number of markers that can be measured simultaneously by the CODEX technology is accompanied by the need for new bioinformatic methods to accurately annotate cell types, quantify marker expression and identify spatial relationships.
In this study, we used a machine learning segmentation approach that can detect the cytoplasm and processes of each brain cell. Cell instance segmentation was performed using the pretrained, convolutional neural network-based deep-learning models available in the ariadne.ai SPATIAL platform. This segmentation method captures neurons, astrocytes, microglia/macrophages and oligodendrocytes/OPCs based on neuronal nuclei (NeuN), glial fibrillary acidic protein (GFAP), ionized calcium-binding adapter molecule 1 (IBA1) and OLIG2 expression, respectively (Fig. 1d–f and Extended Data Fig. 2a,b). A total of 471,181 cells were segmented in the initial CODEX-CNS dataset, of which 267,970 were in the GM, 192,545 were in the WM and 10,666 were in the meninges. Cells segmented from the GM and WM were used for subsequent analyses. Different cell types exhibited distinct regional distributions, with neurons present mainly in the GM (39.35% of all cells) and oligodendrocytes in the WM (78.41% of all cells) (Fig. 1f). For each brain area, no significant differences in density of any cell type were observed between AD and age-matched healthy samples (Extended Data Fig. 2c).
AD brains exhibit specific cell–cell interactionsUsing CODEX-CNS, we captured pathological features of the AD brain microenvironment by simultaneously visualizing Aβ and principal brain cell types at single-cell resolution. Diffuse and dense-core Aβ plaques have been described in AD1. We observed colocalization of apolipoprotein E (ApoE) and Aβ staining in dense (Fig. 2a–c, red arrows) and diffuse (Fig. 2a–c, dashed circles) Aβ plaques, consistent with the reported role of ApoE in Aβ plaque formation31. Reactive astrocytes with high levels of GFAP and Vimentin expression were localized primarily around dense Aβ plaques (Fig. 2d,e). In addition to astrocytes, microglia and potentially infiltrating macrophages were detected surrounding Aβ plaques (Fig. 2f–i). As previously reported in AD human brains32,33,34, some of the IBA1+ cells (IBA1 is a marker of macrophages and microglia) around the Aβ plaques expressed CD163 (Fig. 2i)—a marker that is expressed predominantly by border-associated macrophages (BAMs), suggesting that either BAMs have infiltrated the brain parenchyma or some microglia have obtained BAM phenotype in response to the local microenvironment35. In conjunction with glial reactivity, we found that the immediate vicinity of some Aβ plaques lacked normal postsynaptic density protein 95 (PSD95) and synaptophysin punctate staining but contained aberrant spheroid accumulations of synaptophysin and neurofilament (Fig. 2j–l, arrowheads). These observations are consistent with synaptic and neuritic dystrophy near dense Aβ plaques1,36,37.
Fig. 2: Multicellular characterization of the Aβ plaque microenvironment at the proteomic level. The alternative text for this image may have been generated using AI.
a–c, Representative images showing diffuse (dashed circles) and dense (red arrows) Aβ plaques (a) as well as ApoE depositions (b), demonstrating a high degree of colocalization (c). d,e, Representative images of Vimentin+ astrocytes (d) expressing GFAP (e) in close proximity to Aβ plaques. Note that Vimentin is also expressed in blood vessels. f–i, Representative images of astrocytes (GFAP (f) and Vimentin (g)) and microglia/macrophages (IBA1 (h) and TMEM119 and CD63 (i) surrounding an Aβ plaque. j–l, Representative images showing neuronal markers in relation to an Aβ plaque, showing a merged image (j) and individual staining for NeuN and neurofilament (k) and PSD95 and synaptophysin (l). Note the abnormal synaptic protein accumulation in the dense Aβ plaque site (arrowheads). Images are representative of n = 4 samples of frontal cerebral cortex from patients with AD.
Next, we leveraged the simultaneous detection of different cell types to analyze cell–cell interactions in the healthy human brain and their changes in AD (Fig. 3). Preferential cell contact was explored by comparing the frequency of cell interactions within a 15-µm radius from each cell centroid to a permuted background (Fig. 3a and Methods). This analysis revealed preferential contacts between neurons and oligodendrocytes/OPCs (Fig. 3b,c), as well as between microglia and astrocytes (Fig. 3b,c), in the GM of the human frontal cerebral cortex of healthy people. Oligodendrocytes in close vicinity to the neuronal soma, also known as perineuronal oligodendrocytes, provide metabolic support to neurons38,39. However, the biological role of interactions between astrocytes and microglia under physiological conditions remains less explored. Microglia and astrocytes also exhibited frequent interactions with blood vessels (Fig. 3b,c). In WM, oligodendrocytes/OPCs exhibited a higher frequency of interactions with each other compared to interactions with other cell types (Extended Data Fig. 3a,b). This is consistent with the characteristic linear arrangement of oligodendrocytes along neuronal axons as well as the known axon-supportive functions of oligodendrocyte-formed myelin40.
Fig. 3: CODEX-CNS reveals specific cellular interactions in human AD brain. The alternative text for this image may have been generated using AI.
a, Representative image showing the cell interaction analysis approach used in samples of human frontal cerebral cortex from healthy people (n = 4) and patients with AD (n = 4). Cell and blood vessel frequencies are quantified within a 15-µm radius (red circle) from the centroids (blue dots) of each cell. b, Network plots showing the likelihood of close interactions between the main brain cell types in the GM of the human frontal cerebral cortex of healthy people (n = 4). Interaction likelihoods were generated by comparing observed interaction frequencies to a permuted background. Red lines represent high cell-to-cell vasculature interactions, whereas blue lines represent low cell-to-cell vasculature interactions. Line thickness represents deviation of the observed interaction, either positive or negative, from what would be expected under the null hypothesis that cells show no spatial patterning. c, Representative fluorescent images showing the most predominant cell interactions quantitatively detected in the GM of the human frontal cerebral cortex of healthy people (n = 4). d, Comparison of conditional cell interaction likelihoods in GM between AD and healthy brains (HC) (n = 2 per group) by two-sided Student’s t-test. Bars represent obtained t-statistics. *P < 0.1. Exact P values and t-test statistics can be found in the corresponding source data file. e, Representative fluorescent images showing cell interactions detected more frequently in the GM of patients with AD (n = 4) compared with healthy controls (n = 4). f, Comparison of cell protein expression between microglia interacting with other microglia and noninteracting microglia, as well as between neurons interacting with astrocytes and noninteracting neurons in the GM of AD brains (n = 4). Statistical analysis was performed by two-sided Mann–Whitney U test. Significant differences were considered as P < 0.05 and log2FC > 0.5 or < −0.5. Each box extends from the first quartile (Q1) to the third quartile (Q3) of the data, with a line at the median. The whiskers extend from the box to the farthest datapoint. Exact P values and t-test statistics can be found in the corresponding source data file.
We next explored the frequencies of different cell interactions in AD brains compared to healthy brains. Microglia–microglia contacts were more abundant in the GM of AD brains than in control brains (Fig. 3d,e, upper panel), probably due to their tendency to aggregate around Aβ plaques. No significant differences in microglia–microglia contacts between AD and healthy brains were observed in WM (Extended Data Fig. 3c). In the GM of AD brains, we detected a higher expression of CD163 and human leukocyte antigen DR isotype (HLA-DR) in microglia interacting with other microglia compared to noninteracting microglia (Fig. 3f). Significant differences in proliferating cell nuclear antigen (PCNA) expression were not observed (Fig. 3f), suggesting that microglial accumulation in the GM of AD brains results from cell migration probably prompted by pathological cues rather than from cell proliferation41. We also observed a tendency towards an increased interaction between astrocytes and both neurons and oligodendrocytes/OPCs, as well as vice versa, in the GM of AD brains compared to healthy controls (Fig. 3d,e, bottom panel). At the same time, we found that neurons interacting with astrocytes present higher levels of γH2A.X—a marker of DNA damage—than neurons not interacting with astrocytes (Fig. 3f). These findings suggest that astrocytes communicate with damaged neurons in the context of AD.
Taken together, this analysis provides a deeper understanding of cellular communication in the human frontal cerebral cortex and identifies differences in specific cell–cell interactions between AD and healthy human brains.
Distinct microglial morphologies across tissue microenvironmentsAlthough extensive work employing sophisticated computational pipelines has been conducted to analyze microglial morphology in mouse models42,43,44,45, a detailed morphometric characterization of human microglia is needed. To profile morphological phenotypes amongst myeloid cells in the human brain (using healthy controls and AD samples, n = 4 per group), we conducted unsupervised clustering on all IBA1+ segmented cells based on 12 morphological features (Methods), which were computed using masks for cells, somas, processes, branches and the cell convex hull (which measures cell solidity) (Fig. 4a and Extended Data Fig. 4a). Our initial analysis identified three main clusters that we annotated as Rounded (high cell circularity and absence of processes), Intermediate (few and thick processes) and Ramified (high number of processes and branches) (Fig. 4b,c and Extended Data Fig. 4b,c). To explore heterogeneity within the Ramified cluster, we applied a subclustering analysis that further stratified these microglia into three subclusters (Ramified 1–3), distinguished mainly by cell and soma size, soma circularity, number of processes and branches and process length (Fig. 4b,c and Extended Data Fig. 4b). Furthermore, we observed a correlation between morphological features and protein expression (Supplementary Fig. 3). Of note, cell circularity and solidity were associated highly with the expression of monocyte and macrophage markers CD14 and CD163, whereas features related to cell ramification were associated with the expression of the microglia marker transmembrane protein 119 (TMEM119) (Supplementary Fig. 3). The proportion of these morphologically distinct cell clusters varied across different compartments of the frontal cerebral cortex, with the Intermediate cluster being more prevalent in the WM, and the Ramified 2 and Ramified 3 clusters being more prevalent in the GM (Fig. 4d,e and Extended Data Fig. 4d). No statistically significant differences in the proportions of morphological clusters were observed between AD and control brains.
Fig. 4: Morphological analysis of myeloid cells in the human frontal cerebral cortex. The alternative text for this image may have been generated using AI.
a, Representative schematic image showing cell, soma, process and branch detections used for the obtention of morphological parameters. b, t-SNE plot visualizing 63,873 myeloid cells colored by supercluster (left: Rounded, Intermediate and Ramified) and subclusters (right: Ramified 1, 2 and 3) identified after applying Leiden clustering to IBA1+ segmented cells of the human frontal cerebral cortex (n = 8) based on morphological parameters. Heatmaps show the mean morphological feature value within each cluster scaled by the minimum and maximum value. c, Representative images of cell masks displaying the characteristic morphological features observed in the five identified clusters. d, Representative tissue map showing the spatial distribution of the morphological clusters identified in the human frontal cerebral cortex from a healthy person. Each dot represents one cell. Dashed lines delimit the WM area. e, Pie charts showing the percentage of each morphological subcluster in GM (top panels) and WM (bottom panels) areas from AD (n = 4) and healthy control (n = 4) brains. f, Schematics illustrating the method used for the neighborhood analysis applied to all myeloid cells identified. The expression of different proteins is quantified in a 30-µm radius from the cell centroid of each segmented IBA1+ cell. g, Heatmaps showing the association between the identified morphological clusters and the proteins expressed in their neighborhood within the GM of the human frontal cerebral cortex from donors with AD (n = 4) and healthy control donors (n = 4). Asterisks denote significance (*P < 0.05, **P < 0.01, ***P < 0.001) as obtained from two-sided Student’s t-tests comparing values within each cell cluster to values from all other cell types for a given protein. Scale bar: rescaled average z-scored protein percentages in each group. Exact P values and t-test statistics can be found in the corresponding source data file.
As changes in microglial morphology could arise from alterations in their microenvironment, we further examined the cellular neighborhood of the five morphologically defined myeloid cell clusters throughout the human frontal cerebral cortex of all eight samples. We performed a custom neighborhood analysis quantifying the abundance of different markers present within a radius of 30 µm from each myeloid cell centroid (Fig. 4f and Methods). In both GM and WM, the rounded morphology was associated significantly with blood vessel markers and PCNA (Fig. 4g and Supplementary Fig. 4). This morphology was also associated with ApoE except in the GM of patients with AD, where high levels of ApoE colocalize with Aβ plaques. In addition, a positive association between the Ramified 3 morphology and microtubule-associated protein 2 (MAP2) expression was observed regardless of the disease condition, suggesting that a high degree of branching in microglia is associated with dendrites (Fig. 4g). Ramified 3 morphology was also associated with NeuN in GM of control brains, but not in AD brains (Fig. 4g). Notably, a significant spatial association between the Ramified 2 morphology and its proximity to Aβ, ApoE and NeuN was observed exclusively in the GM of patients with AD (Fig. 4g). By contrast, in the GM of control brains, but also in the WM of AD brains (where Aβ plaques are less prevalent), this morphology was associated with neurofilament (Fig. 4g and Supplementary Fig. 4). This result suggests that highly ramified cells with large somas may be associated with pathological features of AD. Overall, these data indicate that the aged human brain has well-defined morphological microglial phenotypes, which are distributed differentially across GM and WM as well as the surrounding tissue microenvironment.
Brain myeloid cells form five protein-based clusters characterized by their spatial distributionBeyond morphological features, discerning protein phenotypes of myeloid cells and their spatial organization in brain tissue is essential for understanding their diversity and function in disease. Using CODEX-CNS, we performed Leiden unsupervised clustering in a total of 63,873 IBA1+ segmented cells (Fig. 5a) across eight frontal cerebral cortex samples from patients with AD and aged-matched controls.
Fig. 5: Microglia/macrophage protein signatures correlate with specific tissue microenvironments in the human frontal cerebral cortex. The alternative text for this image may have been generated using AI.
a, Representative image showing segmented IBA1+ cells used for the clustering analysis. b, t-SNE plots visualizing 63,873 myeloid cells colored by supercluster (left: A and B) or subcluster (right: MO, PVM, BLM, MG1 and MG2) identified after applying Leiden clustering to IBA1+ segmented cells of the human frontal cerebral cortex (n = 8) based on protein expression. Heatmaps show the mean protein expression levels within each cluster divided by the maximum expression value. c, Representative fluorescent images showing the characteristic protein expression in each identified cluster. Images are representative for n = 4 AD samples and n = 4 healthy controls analyzed in 7 independent experiments. d, Stacked barplot showing the proportion of the morphological clusters in each protein cluster. e, Representative tissue map showing the spatial distribution of the myeloid protein clusters in the human frontal cerebral cortex from a healthy person. Each dot represents one cell. Dashed lines delimit the WM area. f, Pie charts showing the percentage of each protein cluster in GM (top panels) and WM (bottom panels) areas from AD (n = 4) and control (n = 4) brains. g, Heatmaps showing the association between the identified protein clusters and the proteins expressed in their neighborhood within the GM of the human frontal cerebral cortex from donors with AD (n = 4) and healthy control donors (n = 4). Asterisks denote significances (*P < 0.05, **P < 0.01, ***P < 0.001) as obtained from two-sided Student’s t-tests comparing values within each cell cluster to values from all other cell types for a given protein. Exact P values and t-test statistics can be found in the corresponding source data file. Scale bar: rescaled average z-scored protein percentages in each group. h, Representative fluorescent images showing colored protein-based cluster cell masks and the association with their proximal neighborhood.
Two myeloid populations (A and B) were identified based on the expression of IBA1, TMEM119, CD74, CD14, CD163, CD68, CD11b, CD11c, HLA-DR and CD45 (Fig. 5b and Extended Data Fig. 5a–c). Population A demonstrated a monocyte/macrophage phenotype and population B demonstrated a microglial phenotype based on the presence or absence of CD163 (BAM marker) and TMEM119 (microglia marker; Fig. 5b). To further explore the heterogeneity of these two populations, we performed a subclustering analysis that resulted in five myeloid cell populations (Fig. 5b). The five clusters were annotated based on the expression of TMEM119 and/or CD163, as well as their location in the tissue (Methods). Annotated clusters included: monocytes (MO), perivascular macrophages (PVMs), BAM-like microglia (BLM), microglia 1 (MG1) and microglia 2 (MG2). Most of the cells from the BLM subpopulation expressed both CD163 and TMEM119 proteins, indicating a unique phenotype that crosses that of microglia and PVMs (Extended Data Fig. 5d). These five myeloid clusters were mapped back onto the tissue samples and their phenotypes were validated in situ (Fig. 5c and Supplementary Fig. 5). These protein clusters were identifiable by both the ariadne.ai machine learning segmentation approach and our custom Otsu’s Thresholding-based Segmentation and Merge open-source algorithm (Methods), using reference mapping (Supplementary Fig. 6).
We next assessed the correspondence between clusters defined by morphology and those defined by protein expression. Whereas monocytes and PVMs belonged mostly to the rounded morphology cluster, BLM, MG1 and MG2 displayed a greater heterogeneity of morphologies (Fig. 5d), indicating morphological heterogeneity in each protein-based microglial subpopulation. Spatial mapping of segmented myeloid cells revealed different proportions of these subpopulations in GM and WM (Fig. 5e,f and Extended Data Fig. 5e). For all samples, MG1 and MG2 clusters were the most abundant, whereas monocytes were the least abundant (Fig. 5f). However, MG2 was the most predominant cluster observed in GM and MG1 was the most predominant cluster observed in WM (Fig. 5f). The expression of the markers CD74, CD68, CD11c and HLA-DR in MG1 is consistent with the activated microglial phenotype reported in WM areas during physiological aging of mice and humans46,47. Moreover, we observed a significantly higher proportion of PVMs and monocytes in GM compared to WM. No statistically significant differences in cluster proportions were detected between AD and healthy brains.
We then explored whether the identified protein-based subpopulations were associated with specific microenvironmental features, or neighborhoods. As expected, PVMs were associated positively with vascular markers and PCNA (Fig. 5g,h and Supplementary Fig. 7a,b). Of note, we detected a significant association between monocytes and vascular markers specifically when considering their cell masks as their neighborhood (Supplementary Fig. 7a). This is due to the colocalization of monocytes with blood vessels. In GM areas, MG1 was associated positively with neuronal markers (Fig. 5g,h). The BLM subpopulation was associated significantly with Aβ, ApoE and GFAP in GM of AD brains (Fig. 5g,h). This result suggests that BLM migrate to Aβ plaques in AD brains. Of note, PVMs rather than BLM were associated with ApoE in control brains (Fig. 5g and Supplementary Fig. 7b). This could be explained by the expression of ApoE by vascular smooth muscle cells and pericytes under physiological conditions48,49. These data indicate distinct neighborhood preferences of myeloid subpopulations throughout brain tissue, highlighting variations between AD and control subjects.
The BLM subpopulation forms the strongest association with dense Aβ plaquesObserving that certain morphological (Ramified 2 subpopulation) and protein-based microglial subpopulations (BLM subpopulation) are associated significantly with Aβ expression in their neighborhood, we next used CODEX-CNS to understand their relationship with different Aβ plaque types. We trained a machine learning model to identify Aβ plaques and differentiate them into dense and diffuse types (Fig. 6a,b). For each IBA1+ segmented cell, we measured the distance from its centroid to the nearest Aβ plaque (Fig. 6c). Since myeloid populations differ between GM and WM areas based on their morphology and protein expression (Figs. 4e and 5f), we analyzed their distance to Aβ plaques only in GM, where the plaques are predominant. Our results demonstrated heterogeneity in morphological clusters next to both dense and diffuse Aβ plaques, with slight variation in cluster proportions based on their distance from Aβ plaques (Fig. 6d, left panels). This indicates a weak association between morphological clusters and Aβ plaques.
Fig. 6: Myeloid cells in close proximity to dense Aβ plaques represent a spatial and temporal state between PVMs and microglia. The alternative text for this image may have been generated using AI.
a, Representative fluorescent image showing Aβ staining in the frontal cerebral cortex from an AD sample. Image is representative of n = 4 AD samples analyzed in 4 independent experiments. b, Representative images showing dense and diffuse Aβ plaque segmentations. c, Spatial map showing myeloid cells colored by their distance to the nearest Aβ plaque. d, Stacked barplots showing the average proportion of each myeloid morphology-based (left panels) and protein-based (right panels) clusters in relation to dense (top panels) and diffuse (lower panels) Aβ plaque proximity in the GM of AD brains (n = 4). e, Representative fluorescent images showing staining of IBA1, CD163 and HLA-DR markers in dense (upper panel) and diffuse (lower panel) Aβ plaques. Image is representative of n = 4 AD samples analyzed in 4 independent experiments. f, Representative images of multicolor IF labeling validating the presence of HLA-DR+CD68+ myeloid cells in proximity to dense Aβ plaques (white arrowheads). Images are representative of n = 10 AD brains. g, Protein clustering t-SNE plot with pseudotime visualization of myeloid cells. Line color represents the pseudotime values. h, Neighborhood analysis of the pseudotime values in AD (n = 4) and healthy control (n = 4) samples showing markers for vasculature (claudin-5, SMA, collagen IV), neurons (NeuN) and Aβ plaques. i, Box and whisker plots showing the mean z-scores of vascular markers (claudin-5, collagen IV) expressed in the neighborhood of each myeloid protein-based cluster identified within the GM of the human frontal cortex (n = 4 AD samples, n = 4 healthy controls). Differences were first confirmed by one-way ANOVA Benjamini–Hochberg-adjusted P value < 0.05, followed by post hoc Tukey test. Asterisks denote per-comparison significances (*P < 0.05, **P < 0.01, ***P < 0.001) obtained from the post hoc Tukey test. Each box extends from the first quartile (Q1) to the third quartile (Q3) of the data, with a line at the median. The whiskers extend from the box to the farthest data point lying within 1.5× the interquartile range from the box. Flier points are those past the end of the whiskers, although these were not excluded from statistical analysis. ANOVA P values, post hoc Tukey P values, confidence intervals and Q test statistics can be found in the corresponding source data file. j, Distance analysis of the myeloid protein-based clusters with respect to their nearest segmented blood vessel. Overall significance assessed by one-way ANOVA upon raw cell distances split by cluster, followed by Benjamini–Hochberg adjustment. Pairwise significances were calculated by post hoc Tukey test and Tukey’s Q critical values were used to determine universal 95% confidence interval widths around each group mean (see Methods for plotting details). Comparisons to BLM cluster (represented in blue) are highlighted as either significant in red (P < 0.05) or insignificant in gray (P ≥ 0.05). ANOVA P values, post hoc Tukey P values, confidence intervals and Q test statistics can be found in the corresponding source data file.
Examining protein-based myeloid cell subpopulations and distance from Aβ plaques, we found that the BLM subpopulation comprises the highest percentage of cells (~40%) in close proximity (0–5 µm) to dense Aβ plaques, with this percentage decreasing at greater distances from the plaques (Fig. 6d,e, upper right panels). Of the cells in close proximity (0–5 µm) to diffuse Aβ plaques, only ~20% were BLMs, and this proportion showed little variation based on distance from the plaques (
Comments (0)