
Remember me
In clinical practice, thyroid nodules are common, with a higher prevalence in women. These nodules are found in approximately 50% of healthy individuals and, in most cases, do not result in substantial symptoms. Approximately 80–90% of thyroid nodules are estimated to be benign. Patients at risk for developing thyroid cancer are those with a history of head-and-neck radiation exposure and a family history of thyroid cancer.[1]
The primary goal of managing these nodules is to exclude malignancy; this is often achieved through neck ultrasonography (US) and thyroid fine-needle aspiration cytology (FNAC). The US is a valuable, non-invasive tool for identifying nodules harboring possible malignancy. Radiological findings such as microcalcifications, taller-than-wide nodule dimensions, solid irregular nodule borders, and hypoechogenicity can raise suspicion of thyroid cancer.[2]
Thyroid cytology is a simple diagnostic tool for thyroid nodules, thereby decreasing unnecessary surgeries in most benign cases, with a reported mean sensitivity and specificity of 83% and 92%, respectively.[3] However, there are conflicting data about the accuracy of FNAC in larger thyroid nodules, particularly those larger than 4 cm. Several researchers have shown similar FNAC performance between larger and smaller nodules,[4] while other studies have found higher rates of false-negative FNAC in larger thyroid nodules, and some have even recommended immediate surgery for nodules larger than 4 cm regardless of the FNAC results.[5]
Based on these inconsistent findings, we aim in this study to evaluate the accuracy of thyroid FNAC in detecting malignancy in smaller nodules compared to larger nodules and to determine whether the probability of indeterminate or non-diagnostic thyroid FNAC is higher when the size of the nodule is larger.
MATERIAL AND METHODS Design and patientsOur study is a retrospective analysis that took place at King Abdul-Aziz University Hospital, Jeddah, Saudi Arabia. Ethical approval was obtained from the Biomedical Research Ethics Committee at King Abdulaziz University, with a reference number of 81–23, with a reference number of 81–23 and following the Declaration of Helsinki.[6] Due to the retrospective and non-interventional nature of the study, participants’ informed consent was waived.
We included all adult patients who underwent total or hemithyroidectomy from 2016 to 2022 and had pre-operative evidence of thyroid nodules on US imaging. Included patients should have available pre-operative nodule FNAC and postoperative histology. Patients with missing US or FNAC or histopathology data or pediatric patients were excluded from the study.
Various patient details were collected, including age, gender, pre-operative thyroid-stimulating hormone levels, the size of the nodule in the US in cm, the US risk category according to the 2015 American Thyroid Association (ATA) guidelines for thyroid nodules,[7] results of the FNAC, and the postoperative histopathology outcome specifying if it was benign or malignant. Age was divided into 40 years or less versus above 40 years based on the mean age of thyroid cancer in Saudi Arabia.[8,9]
FNA characterizationFNAC findings were labeled based on the Bethesda system for reporting thyroid cytopathology. They were divided into non-diagnostic, benign, follicular lesion of undetermined significance/atypia of undetermined significance (FLUS/AUS), follicular neoplasm (FN) or suspicious for FN, suspicious for malignancy (SUSP), and malignant.[10] This addition provides readers with essential criteria, aiding in the interpretation and compatibility of our FNAC results with standardized classifications.[11]
True negative FNAC cases are benign FNAC that yielded a benign histopathology. True-positive FNAC cases are the malignant FNAC that yielded malignant histopathology. True positive and true negative cases were collectively labeled as true FNAC tests. All FNAC were collected under US guidance, the obtained thyroid US-guided DNA sample was used to prepare conventional smears beside liquid base preparations. The cell block was added whenever floating materials were detected.
Statistical analysisMeans with standard deviations and medians with Q1 and Q3, and frequencies with percentages were used to describe continuous and categorical variables, respectively. The overall study sample was categorized based on the sample’s histopathology into malignant or benign tumors. We used the Shapiro–Wilk test to determine the normality of the continuous variables. To compare descriptive statistics between malignant and benign tumors, we used the t-test and the Chi-square test for means of normally distributed variables and frequency distributions of categorical variables, respectively. To determine whether the probabilities of indeterminate, non-diagnostic, and true FNAC vary by nodule size, we calculated the overall probabilities. Then, we calculated different probabilities at smaller and larger nodule sizes using cutoffs at 2, 3, and 4 cm values. All analyses were performed with Statistical Analysis Software (SAS) 9.4 (SAS Institute, Cary NC) with a significance level of 0.05.
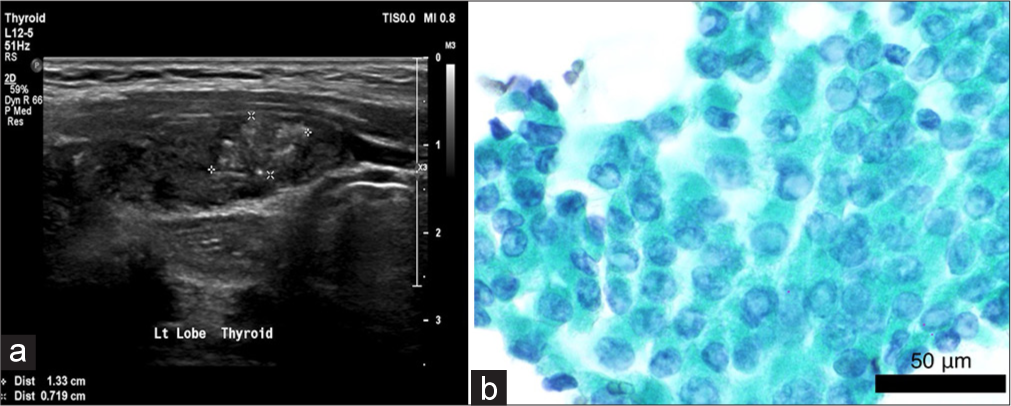
RESULTS Baseline characteristics of the study sampleWe had 345 patients who fulfilled the inclusion criteria; the majority were female (86.7%) and older than 40 years of age (53.9%). Approximately half of the patients had benign post-operative histology, and the other half were found to have thyroid cancer. The median nodule size was higher for benign nodules (3.1 cm), whereas for malignant nodules, the median size was 2.7 cm. Most benign nodules had low suspicion US features (49.6%), and most of the malignant sample had high-risk US features (48.1%). The majority of the cohort had indeterminate (FLUS/AUS, FN, SUSP) thyroid cytology results, accounting collectively for 49.3% of the cohort, followed by benign cytology in 29.3%, malignant cytology in 12.8%, and finally non-diagnostic cytology in 8.7%. Table 1 illustrates the baseline characteristics of the study sample. Figures 1, 2a, and b illustrate examples of thyroid nodules of different sizes and characteristics with the corresponding cytology.
Table 1: Baseline characteristics of the study sample.
Label Total n=345 Histopathology Test statistic value P-value Benign n=172 (49.9) Malignant n=173 (50.1) Age, years, Mean±SD 42.97±13.83 43.52±13.30 42.43±14.36 t=0.73 0.4653 Pre-operative TSHa, Median (Q1, Q3) 1.6 (0.8, 2.7) 1.3 (0.7, 2.3) 1.8 (1.1, 3.0) Z=3.81 0.0001 Size of the nodule, cm, Median (Q1, Q3) 3.0 (1.9, 4.2) 3.1 (2.0, 4.5) 2.7 (1.7, 4.0) Z=2.22 0.0266 Age categories, n (%) χ2=0.85 0.3564 ≤40 years 159 (46.1) 75 (43.6) 84 (48.6) >40 years 186 (53.9) 97 (56.4) 89 (51.4) Sex, n (%) χ2=1.55 0.2128 Female 299 (86.7) 153 (89.0) 146 (84.4) Male 46 (13.3) 19 (11.0) 27 (15.6) Type of surgery, n (%) χ2=25.09 <0.0001 Hemithyroidectomy 82 (24.0) 59 (34.3) 23 (13.5) Hemithyroidectomy followed by total thyroidectomy 17 (5.0) 3 (1.7) 14 (8.2) Total thyroidectomy 243 (71.1) 110 (64.0) 133 (78.2) Size of nodule, n (%) χ2=4.97 0.0833 <2 cm 88 (25.5) 35 (20.3) 53 (30.7) 2–4 cm 168 (48.7) 88 (51.2) 80 (46.2) >4 cm 89 (25.8) 49 (28.5) 40 (23.1) USb features, n (%) χ2=31.54 <0.0001 Benign 11 (4.0) 10 (7.1) 1 (0.8) Very low suspicion 9 (3.3) 5 (3.5) 4 (3.0) Low suspicion 112 (40.9) 70 (49.6) 42 (31.6) Intermediate suspicion 52 (19.0) 30 (21.3) 22 (16.5) High suspicion 90 (32.8) 26 (18.4) 64 (48.1) Bethesda, n (%) χ2=88.87 <0.0001 Non-diagnostic or unsatisfactory 30 (8.7) 15 (8.7) 15 (8.7) Benign 101 (29.3) 77 (44.8) 24 (13.9) AUSc 82 (23.8) 49 (28.5) 33 (19.1) FNd or suspicious of FN 49 (14.2) 24 (14.0) 25 (14.5) Suspicious of Malignancy 39 (11.3) 5 (2.9) 34 (19.7) Malignant 44 (12.8) 2 (1.2) 42 (24.3)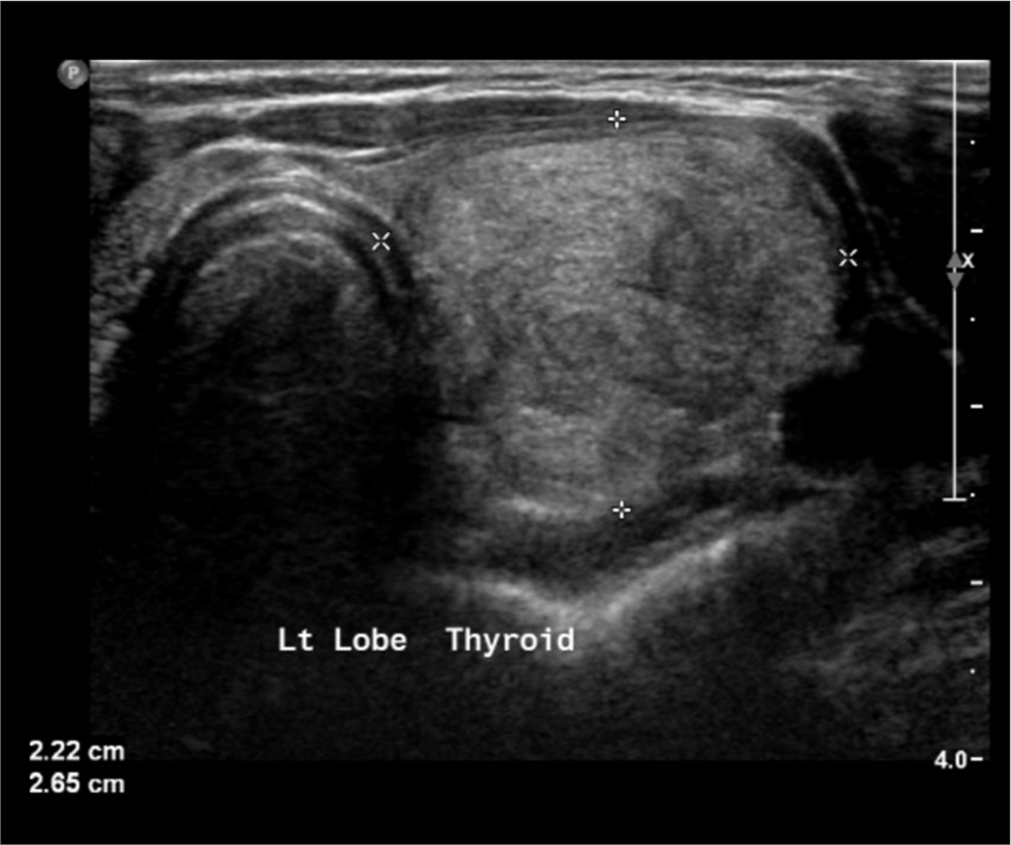
Export to PPT
Export to PPT
Correlation between the nodule size and the probability of obtaining an indeterminate or non-diagnostic cytologyIndeterminate and non-diagnostic FNAC results were found in 200 cases (30 non-diagnostic or unsatisfactory + 170 indeterminate cytology). Therefore, out of the total sample size of 345 patients, 200 (58.0%) had indeterminate or non-diagnostic FNAC.
When assessing if a larger size per se increases the likelihood of obtaining a non-diagnostic or an indeterminate sample, we looked into the overall proportion of indeterminate or non-diagnostic FNAC through different cutoff nodule sizes. Nodule size cutoffs are less than, more than, or equal to 2 cm, 3 cm, and 4 cm. We found that the proportion of indeterminate or non-diagnostic FNAC was relatively constant across the different nodule sizes, as illustrated in Table 2. The proportion of patients with indeterminate or non-diagnostic cytology was 58% in both patients <4 cm and ≥4 cm. Furthermore, patients with nodule size <2 cm had a marginally similar probability of indeterminate or non-diagnostic nodules to nodules ≥2 cm at 60.2% and 57.2%, respectively. Thus, there is no relationship between the nodule size and the probability of obtaining an indeterminate or non-diagnostic cytology.
Table 2: Association between the nodule size and probability of indeterminate or non-diagnostic FNAC.
The overall proportion of indeterminate or non-diagnostic FNACa. (n=200) 58.0 (%) Cutoff at 2 cm Cutoff at 3 cm Cutoff at 4 cm Cutoff at 2 and 4 cm <2 ≥2 <3 ≥3 <4 ≥4 <2 2–4 >4 60.2 57.2 60.2 55.8 58.0 58.0 60.2 56.6 58.4 FNAC performance according to the nodule sizeThe frequency of FNAC results that were true was 119 subjects (77 benign FNAC and histopathology + 42 malignant FNAC and histopathology). Therefore, out of the total sample size of 345, 119 (34.5%) had true and accurate FNAC results based on final histopathology. The proportion of true FNAC while varying the cutoff thresholds for nodule size did not differ between the different nodule size categories, indicating similar performance of the FNAC throughout the small and large sizes, as seen in Table 3. The proportion of patients with true FNAC results was 34.3% in patients with nodules <4 cm in size and 35.0% in patients with nodules ≥4 cm in size. In addition, the same probability of true FNAC was found when comparing nodules that are 2–4 cm in size versus nodules that are >4 cm in size, at 34.5% and 36%, respectively.
Table 3: Association between the nodule size and probability of a true or accurate FNAC.
The overall proportion of true FNACa. (n=119) 34.5 (%) Cutoff at 2 cm Cutoff at 3 cm Cutoff at 4 cm Cutoff at 2 and 4 cm <2 ≥2 <3 ≥3 <4 ≥4 <2 2–4 >4 33.5 35.0 33.3 35.6 34.3 35.0 33.0 34.5 36.0 DISCUSSIONThyroid cytology is a simple diagnostic tool for thyroid nodules, with an overall reported sensitivity and specificity 72% and 99%.[12] Thereby, it decreases unnecessary surgeries in most benign cases. In this study, our results indicated that nodule size does not affect the probability of obtaining an indeterminate or non-diagnostic FNAC. In addition, our results indicated no difference in the accuracy of the FNAC between smaller and larger thyroid nodules.
Similarly, multiple other studies concluded that greater nodule diameter is not linked to the diagnostic utility of US-guided FNAC.[13,14] Moreover, many other more recent studies have had similar results, with no relation found between different nodule sizes and the false-negative rate (FNR) of FNAC. In one study, the FNR for FNAC was low at (4.1%).[15] Furthermore, another study compared the FNR between nodules ≥4 cm and smaller nodules <4 cm. FNAC FNR was 6.6% in nodules ≥4 cm compared to 4.2% in nodules <4 cm. The FNR was mainly driven by the follicular and Hurthle cell carcinomas in nodules ≥4 cm in size.[16]
At the same time, several other studies have suggested that the diagnostic accuracy of FNAC in nodules larger than 3–4 cm is significantly lower compared to smaller nodules. In a study comprised of 323 nodules with benign pre-operative FNAC, nodules ≥3 cm in size had an FNR of 11.7%, and the FNR was 4.8% for nodules <3 cm.[17] The former-mentioned study and also another similar study by Kim et al. suggested direct surgery for any thyroid nodule above 3 and 4 cm in size, respectively.[5]
A study by Koo et al. on 690 thyroid nodules concluded that the diagnostic accuracy for FNAC drops as the size of the nodule increases. In their study, nodules between 1 and 4 cm had a diagnostic accuracy ranging between 94.4% and 99%, while in nodules above 4 cm, the diagnostic accuracy dropped to 87.5%.[18] A systematic review that included studies up to July 2013 concluded that larger nodule sizes reduce cytological accuracy.[19] In contrast, a similar –however – more recent systematic review that collected studies up to December 2017, concluded the opposite, where nodule size did not influence the FNAC accuracy.[20]
We believe that studies proposing lower FNAC accuracy in larger nodules are limited by many factors. First, some were conducted among different populations with different epidemiology of thyroid cancer and different surgical practices.[21] Second, some of these studies, especially the older ones, included FNAC performed by palpation, not ultrasound-guided. Based on a systematic review and meta-analysis comparing the diagnostic accuracy of US-guided versus palpation-guided thyroid FNAC, the accuracy of US-guided FNA was found to be significantly superior. The diagnostic sensitivity and specificity by palpation were 76% and 77%, respectively, while the sensitivity and specificity using US guidance were 90% and 80%, respectively.[22]
Third, a lot of these studies were before the era of standardized US risk stratification systems, such as the 2015 ATA nodule guidelines and TIRADS-ACR guidelines. These clinical guidelines and stratification systems have assisted immensely in better diagnostic decision-making and fine-tuning management planning. Similarly, the Bethesda system for thyroid cytology reporting has evolved remarkably over the past decade. In fact, an analysis conducted to compare the FNAC performance before and after the implementation of the Bethesda cytology system found that it decreased the frequency of non-diagnostic, FN, and SUSP. It also increased the diagnoses of benign cytology.[23]
Fourth, some studies have concluded that lower sensitivity of FNAC in larger nodules might be related to sampling error or an incidental thyroid microcarcinoma.[24] Indeed, when Zhu et al. retrospectively reexamined their discordant FNAC, that is, the false-negative and the false-positive cases, they found that the chief etiology of false-negative diagnoses was sampling error in 86.7% of the cases, whereas interpretation error led to most of the false-positive diagnoses.[25] To avoid such error, it was suggested by some experts that multiple passes (2–5) should be executed from all parts of large nodules to diminish the risk of false-negative results. Alternatively, a core-needle biopsy can be utilized for thyroid nodules >2 cm with intermediate to high-risk US risk stratification as it was found to be diagnostically superior to FNAC in these circumstances and also with lower non-diagnostic rates.[26-28]
Finally, with the introduction of NIFTP nomenclature in 2016[29] the malignancy rates of benign and malignant FNAC specimens decreased significantly. This reduction was particularly pronounced in three indeterminate Bethesda categories.[30,31] Furthermore, the implementation of gene expression classifiers (GEC) on indeterminate cytology, namely, AUS/FLUS and FN categories, resulted in 61% less diagnostic surgeries, regardless of the nodule size.[32,33] Due to the high negative predictive value of these tests, such as Afirma GEC and Thyroseq V3 (96% and 97%, respectively), the management of thyroid nodules has evolved dramatically over the past few years.[34]
Our study is strengthened by being a more contemporary view of thyroid nodules that implements the standardized US and cytology reporting systems within the same population. In this study, we utilized the gold standard of diagnosis, which is post-surgical histopathology. To the best of our knowledge, no previous study has investigated the correlation between nodule size and the probability of indeterminate or non-diagnostic cytology. Conversely, the limitations of our study are that it is retrospective and that not all thyroid cytology was read by an independent cytologist; hence, inter-observer variability is possible.
SUMMARYWe found no correlation between thyroid nodule size and the probability of indeterminate or unsatisfactory FNAC. The diagnostic accuracy of FNAC is comparable among different nodule sizes. FNAC can reliably guide the decision for surgery for larger and smaller thyroid nodules along with the diagnostic and clinical data.
AVAILABILITY OF DATA AND MATERIALSThe datasets used in this study are available on request.
ABBREVIATIONSATA: American Thyroid Association
FLUS/AUS: Follicular lesion of undetermined significance/atypia of undetermined significance
FN: Follicular neoplasm
FNAC: Fine needle aspiration cytology
FNR: False-negative rate
GEC: Gene expression classifiers
SAS: Statistical Analysis Software
SD: Standard deviation
SUSP: Suspicious for malignancy
TSH: Thyroid-stimulating hormone
US: Ultrasonography
Comments (0)