Patients
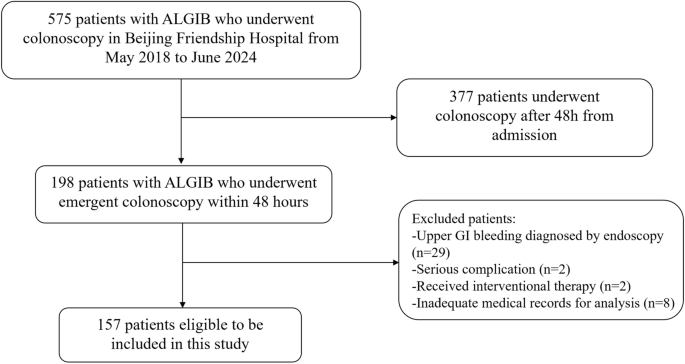
This study included 305 cases of CRC treated surgically at Shinshu University Hospital between 2014 and 2022. All patients were monitored for a minimum follow-up period of 2 years. Tumor differentiation was assessed, with well-differentiated, moderately-differentiated, and poorly-differentiated adenocarcinomas included in the analysis. Based on previously published criteria [17], well-differentiated and moderately-differentiated adenocarcinomas were classified as low-grade, whereas poorly-differentiated adenocarcinomas were categorized as high-grade. Among these patients, 57 cases were excluded for the following reasons: 40 cases were negative for the positive control (housekeeping gene) in the TMA, and 17 cases had no tumor tissue at the primary site within a TMA. Ultimately, 248 cases of CRC were enrolled.
Clinical and pathological data, including patient age, sex, tumor differentiation, prognosis, lymph node involvement, vascular invasion, tumor-infiltrating lymphocytes (TILs), and TNM classification, were extracted from medical records. Tumor staging and differentiation were defined following the eighth edition of the Union for International Cancer Control (UICC) classification [18] and the fifth edition of the World Health Organization (WHO) classification [19]. Histological evaluation of all specimens was independently performed by two pathologists (T.U. and M.I.). TILs in tumor-infiltrating regions were scored using a four-tier system: 0 (none), 1 (mild), 2 (moderate), and 3 (marked) [20]. For subsequent analyses, TIL scores were categorized as low (scores 0 and 1) or high (scores 2 and 3).
OS was defined as the duration between the date of surgical resection and death or last follow-up. Recurrence-free survival (RFS) was defined as the time from surgical resection to disease recurrence or the last follow-up without recurrence. This study adhered to the ethical principles outlined in the Declaration of Helsinki and received approval from the Clinical Trial Review Committee of Shinshu University School of Medicine (approval number: 5836).
Histopathology and Tissue Microarray (TMA) Construction
All specimens were fixed in 10 or 20% neutral-buffered formalin and embedded in paraffin. For the construction of a TMA, blocks containing sufficient tumor tissue from the invasive frontline were selected from formalin-fixed paraffin-embedded tissue archives. Tissue cores (3-mm diameter) were punched out from each block using thin-walled stainless steel needles (Azumaya Medical Instruments Inc., Tokyo, Japan) and arrayed into a recipient paraffin block. Serial 4-µm-thick sections were cut from the TMA blocks, and one section was stained with hematoxylin and eosin for histological assessment.
Immunohistochemistry and Evaluation
IHC staining for CD4, CD8, FOXP3, and CD163 was performed on serial TMA sections to evaluate immune cell subsets. The staining was carried out using a fully automated staining system (BOND-III; Leica Biosystems, Newcastle, UK) with the following primary antibodies: CD4 (clone 4B12, ready-to-use; Leica Biosystems), CD8 (clone C8/144B, ready-to-use; Leica Biosystems), FOXP3 (clone 236A/E7, 1:100 dilution; Abcam, UK), and CD163 (clone 10D6, ready-to-use; Leica Biosystems).
The evaluation methods differed by marker. For CD4⁺, CD8⁺, and FOXP3⁺ T cells, three areas with the highest cell density were selected from each core, and cell counts per high-power field (HPF; 10 × ocular, 40 × objective) were performed. An average of the three fields was used for analysis, and the median of these counts served as the cutoff to classify cases into low and high infiltration groups. For CD163, expression was evaluated semiquantitatively using the immunoreactivity score (IRS), which was calculated by multiplying the staining intensity (SI; 0–3 scale) by the percentage of positive cells (PP; 0–4 scale), as previously described [21]. Cases were then classified into high and low CD163 expression groups based on the median IRS value.
All histological features and staining results were independently evaluated by two experienced pathologists (T.U. and M.I.).
INHBB RNA In Situ Hybridization
The detection of INHBB mRNA was performed using the RNAscope® LS 2.5 Probe – Hs-INHBB (cat. no. 435748; Advanced Cell Diagnostics, Hayward, CA, USA) according to the manufacturer’s instructions, using unstained sample tissue slides. Briefly, tissue sections were pretreated with heat and protease prior to hybridization as previously described [22]. Brown punctate dots observed in the nucleus or cytoplasm were considered positive signals. Standard Mm-PPIB (ACD-313902) was used as a positive control to ensure interpretable results.
INHBB expression was quantified under a 40 × objective lens (Olympus BX53 microscope) according to the five-grade scoring system recommended by the manufacturer: no staining (0), 1–3 dots/cell (1 +), 4–9 dots/cell (2 +), 10–15 dots/cell and/or < 10% dots in clusters (3 +), and > 15 dots/cell and/or > 10% dots in clusters (4 +). For further analysis, samples were classified into low INHBB expression (grades 0, 1 + , and 2 +) and high INHBB expression (grades 3 + and 4 +). We analyzed the association between INHBB expression and clinicopathological parameters and prognosis in patients with CRC.
Single-Cell RNA Sequencing Analysis of INHBB Expression in CRC
The single-cell RNA sequencing (scRNA-seq) analysis of INHBB expression was conducted using a publicly available dataset (Accession Number: GSE132465) obtained from the NCBI Gene Expression Omnibus (GEO) database. This dataset comprised 23 tumor samples and 10 normal samples derived from CRC tissues. Data processing and analysis were conducted using the Seurat R package (v4.1.0). Raw count matrices were normalized to a total expression of 10,000 molecules per cell and subsequently scaled. Highly variable genes across cells were identified and utilized for principal component analysis (PCA) to reduce dimensionality. To assess cellular similarities and perform clustering, the FindNeighbors and FindClusters functions were used. The visualization of cellular heterogeneity was achieved by applying uniform manifold approximation and projection (UMAP) using the RunUMAP function. The expression distribution of INHBB marker genes was assessed across the clusters, allowing for cell type annotation.
Statistical Analysis
Categorical variables were expressed as frequencies, and differences between subgroups were assessed using Fisher’s exact test. The Mann–Whitney U-test was used to compare immune cell infiltration levels (CD4⁺, CD8⁺, CD163⁺, and FOXP3⁺ cells) between the INHBB high-expression and low-expression groups. To visualize the distribution of immune cell counts, violin plots were generated using the ggplot2 package. The OS was analyzed in the entire cohort of 248 patients (stage 0–IV) and the RFS analysis was limited to 202 patients with non-metastatic (stage 0–III) disease. The OS and RFS were estimated by the Kaplan–Meier method, and between-group comparisons were performed using the log-rank test. Prognostic factors were analyzed through univariate and multivariate Cox proportional hazards regression models. Statistical significance was defined as p < 0.05. All statistical analyses were performed using EZR (Easy R), version 1.66, a graphical interface for R developed by the R, Foundation for Statistical Computing (Vienna, Austria).



Comments (0)