
Remember me
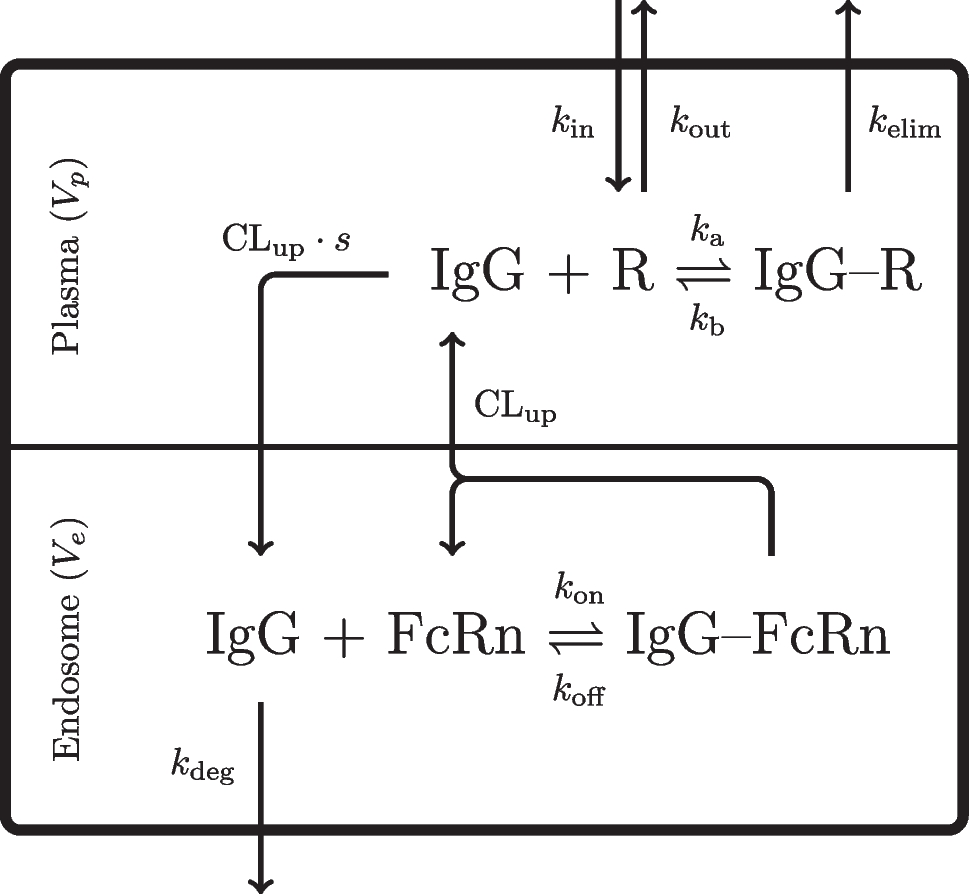

Simulations of P-gp activity were performed using a mass-action kinetic model for P-gp efflux that was derived in Tran et al. [36], as schematically represented in Fig. 1. It resembles the common experimental transwell permeability assay for measuring in vitro drug permeability across a monolayer of cells expressing P-gp. Here, a drug is dosed at either the apical chamber (AC) or the basolateral chamber (BC), after which the drug concentration on the other side of the membrane is measured over time. From this, quantitative measures on the passive diffusion rate (P) and P-gp mediated transport can then be determined [39]. As this situation closely resembles the in vivo situation at the BBB, where a monolayer of brain endothelial cells separates blood (apical chamber) from the brainECF (basolateral chamber), the transwell permeability assay is a common choice for IVIVE based prediction of P-gp mediated transport at the BBB [14,15,16,17].
Fig. 1
Schematic representation of the P-gp kinetic model [36]. The model represents the in vitro setup commonly used for transwell permeability assays. Here, a monolayer of a P-gp expressing cell line is used to determine the permeability of compounds across the monolayer. The drug is dosed at either the apical or the basolateral chamber, after which the drug concentration in the receiver chamber is measured over time. From this, information on the drug’s rate of diffusion as well as its interaction with P-gp can be derived. In the model, a drug can passively diffuse across the membranes to and from the cytoplasm. PAC= the passive permeability coefficient for drug diffusion from the apical side to the cytoplasm. PCA= the passive permeability coefficient for drug diffusion from the cytoplasm to the apical side. PBC= the passive permeability coefficient for drug diffusion from the basolateral side to the cytoplasm. PCB= the passive permeability coefficient for drug diffusion from the cytoplasm to the basolateral side. Whenever drug is present in the inner leaflet of the apical membrane, it can bind to P-gp with the association rate constant (kon). Subsequently, it can either be effluxed to the apical chamber (with the efflux rate constant ke) or dissociate back into the inner leaflet with the dissociation rate constant (koff)
The model derived in Tran et al. describes the variation of drug concentrations in the apical chamber, the basolateral chamber, the cytoplasm and the inner and outer leaflets of both membranes separately [36]. After a drug is dosed in either the apical or basolateral chamber, the drug can diffuse through the monolayer and can interact with P-gp, after which it could be effluxed to the apical chamber.
Drugs diffuse through the membrane according to their passive diffusion rate P (expressed in dm/s), which can be multiplied by the surface area (SA) of the membrane to obtain a passive diffusion clearance. PAC and PCA represent the diffusion rate from the apical chamber into the cytoplasm and vice versa, and PBC and PCB the passive diffusion rate from the basolateral chamber into the cytoplasm and vice versa. PAC and PBC may have different values, however, here we assume that the diffusion rates across the apical and basolateral membranes are equal, so that:
$$\:\beginP_=P_\end$$
(1)
$$\:\beginP_=P_\end$$
(2)
Although P-gp is a transmembrane protein, its binding site is specifically located in the inner leaflet of the apical membrane [40]. As such, only the drug present in the apical inner leaflet is assumed to interact with P-gp. Drug binding to P-gp is described through the association rate constant kon (expressed in 1/M/s). Then, after binding to P-gp, drugs can either dissociate back into the inner leaflet with a dissociation rate constant koff (expressed in 1/s) or they can be effluxed to the apical chamber by P-gp, described with the efflux rate constant ke (expressed in 1/s).
The major assumption under which the model in Tran et al. is derived, is that instantaneous equilibration occurs between each lipid monolayer and the aqueous compartment directly facing it. As such, the apical chamber is in instantaneous equilibrium with the apical outer leaflet, the cytoplasm with both the apical and basolateral inner leaflets, and the basolateral chamber with the basolateral outer leaflet [36]. The extent of partitioning between the lipid monolayer and the aqueous compartment is described through a drug’s partition coefficient (K). The kinetic model uses three partition coefficients: KAO, KIL and KBO, representing partitioning into the apical outer leaflet, the inner leaflets and the basolateral outer leaflet, respectively. They are defined as:
$$\:\beginK_=\frac}}\end$$
(3)
$$\:\beginK_=\frac}}\end$$
(4)
$$\:\beginK_=\frac}},\end$$
(5)
where CAO, CIL and CBO are the lipid phase drug concentrations in the apical outer leaflet, inner leaflets and basolateral outer leaflet, and CAC, CCP and CBC are the drug concentrations in the apical chamber, cytoplasm and basolateral chamber, respectively. Following the assumption of instantaneous equilibrium, the drug concentration in each lipid phase (e.g., in the inner leaflet, CIL) is then equal to the concentration in the aqueous phase facing the lipid phase multiplied by the relevant partition coefficient (e.g., CIL = CCPKIL).
The kinetic model also accounts for unexplained loss from the system that might be observed for some drugs in vitro. It is assumed that the drug is removed with a rate constant kv (expressed in 1/s). In our simulations, we assume very little loss, and fixed kv to 1*10− 6/s, as described for amprenavir (which had negligible loss) in Tran et al. Following these modelling assumptions, the kinetic model is given by a system of ordinary differential equations (ODEs) [36]:
$$\:\beginV_\frac_}=P__A\left(C_-C_\right)-\:k_vV_C_+_k_eC_\end$$
(6)
$$\beginV_\frac_}&=P__A\left(C_-C_\right)\\&+\:P__B\left(C_-C_\right)\:-\:k_vV_C_\end$$
(7)
$$\:\beginV_\frac_}=P__B\left(C_-C_\right)-\:k_vV_C_\end$$
(8)
$$\:\begin\frac_}=\:-k_K_C_C_+\left(k_+k_e\right)C_\end$$
(9)
$$\:\begin\frac_}=\:k_K_C_C_-\left(k_+k_e\right)C_\end$$
(10)
where CAC, CCP, and CBC are the drug concentrations in the apical chamber, cytoplasm and basolateral chamber, respectively. CPgp,free and CPgp,bound correspond to the free and bound P-gp concentrations. Because of the assumption of instantaneous equilibration, the volumes used in the ODEs are defined as VA,tot, VB,tot , and VC,tot which represent, respectively, the whole apical, basolateral or cytoplasmic volume accessible to the drug, as given by:
$$\:\beginV_=V_A+K_V_\end$$
(11)
where VA is the apical chamber volume, VAO is the volume of the apical outer leaflet and KAO is the partition coefficient between the apical chamber and the apical outer leaflet. Similar expressions are found for VB,tot and VC,tot:
$$\:\beginV_=V_B+K_V_\end$$
(12)
$$\:\beginV_=V_C+K_V_\end$$
(13)
We assume that at the start of the simulation (t = 0), there is no drug in the system, apart from in the apical chamber. Therefore
$$\:\beginC_\left(0\right)=Dose\end$$
(14)
$$\:\beginC_\left(0\right)=0\end$$
(15)
$$\beginC_\left(0\right)=0\end$$
(16)
$$\:\beginC_\left(0\right)=\:0\end$$
(17)
$$\:\begin\:C_\left(0\right)=\:C_\end$$
(18)
where Dose is the administered drug dose, and \(\:_\:\)represents the total P-gp concentration in the system. Note that at any given moment, CPgp,free + CPgp,bound = \(\:_\).
An overview of all the parameters, variables, explanations and units used in the model are given in Table 1.
Table 1 Overview of all variable and parameter abbreviations as used in the kinetic binding model, their descriptions, the units used in the model and their value if it is a fixed valueDetermining the P-gp expression-activity relationship (EAR)As a measure of P-gp activity we use the amount of a drug that is effluxed by P-gp during the simulation. At any given timepoint t, the amount (moles) of a drug effluxed by P-gp (Aeffluxed) is given as:
$$\:\beginA_\left(t\right)=\:k_eC_\left(t\right)_\end$$
(19)
where ke is the efflux rate constant, CPgp, bound(t) is the concentration of P-gp bound to drug in the apical inner leaflet at timepoint t (see Eq. 10), and 0.5*VIL is the volume of the apical inner leaflet, since VIL represents the total volume of both inner leaflets.
We are interested in the cumulative amount of drug effluxed from the start (t = 0) until time tend, which we denote as \(\:_\left(_\right)\). This can be determined as
$$\:\beginA_\left(t_\right)=_0^}A_\left(t\right)dt\end$$
(20)
In our simulations \(\:_\) was set to 6 h (21600 s), to correspond to the experiments by Tran et al.
To determine the P-gp EAR, two simulations are done. First, one at a reference P-gp expression (e.g., 1000 µM, which is set as 100%), and then one with a different P-gp expression (x%). The relative P-gp activity at x% P-gp expression (rEARx%) is then described as:
$$\:\begin\text\text\text}_\text}=\:\frac}}\ast100\%\end$$
(21)
If rEARx% = x%, this means that the P-gp EAR is considered linear. Whenever rEARx% deviates from x%, the P-gp EAR moves towards non-linearity (see Fig. 2 for a visual guide on interpreting the rEARx%).
Fig. 2
Visual guide on the rEARx%. The black dot indicates the reference simulation with 100% P-gp expression. The red line represents a linear EAR, and the red points indicate such a linear EAR, where rEAR50% = 50%, and rEAR200% = 200%. The green line showcases a strongly non-linear EAR where rEAR50% = 95%, and rEAR200% = 102%
Determining the EAR for P-gp substratesSimulations of the P-gp EAR were first performed for a set of seven P-gp substrates (amprenavir, digoxin, ketoconazole, loperamide, quinidine, verapamil and vinblastine). The kinetic parameters of these compounds were estimated previously in Lumen et al. [38], and are provided in Table 2. The partition coefficients between the lipid and aqueous phases (i.e., KAO, KBO, KIL) were previously experimentally determined in unilamellar liposomes with membrane lipid compositions that match the general composition of the apical and basolateral inner and outer leaflets [38].
Table 2 Parameter values reported by Lumen et al. [38] for seven P-gp substrates. All parameters were fitted to experimental in vitro data, except for the partitioning coefficients (KAO, KBO and KIL) that were derived from in vitro experimentsTo obtain the P-gp EAR for these drugs, simulations were performed assuming administration of 1 µM drug at t = 0 in the apical chamber. The reference P-gp expression in these simulations (i.e., 100% P-gp) was equal to the P-gp expression estimated by Lumen et al. in MDCKII-MDR1 cells, namely 1000 µM. The rEARx% was subsequently determined at P-gp expression levels of 2%, 7%, 15%, 30%, 50%, 200% and 300% of the reference P-gp concentration for each drug, from which the EAR for these drugs under the given dose and initial P-gp expression was determined.
Determining the relative P-gp activity at 50% P-gp expression (rEAR50%) for virtual drugsTo better understand the P-gp EAR, we simulated the model across a wide range of model parameter values and their respective combinations. For these simulations, PAC and PBC were assumed to be equal. The kinetic parameters koff and ke were varied ranging from 102 to 107 s− 1 (koff) and 0.03–30 s− 1 (ke). Moreover, the drug concentrations in the apical chamber (0.1–100 µM) and reference P-gp expression (101 – 105 µM) were also varied. Every unique combination of the values was then simulated, and thereafter rEAR50% was obtained. The rEAR50% was used as a measure to distinguish a linear from a non-linear P-gp EAR, but in principle other values could also be chosen to analyse this.
SoftwareThe P-gp kinetic binding model was simulated in RStudio [41] running R version 4.3.3, using the freely available R package for solving of ODE systems, rxode2 version 3.0.4 using the LSODA ODE solver. For data visualization, the R package ggplot2 version 3.5.2 was used.
Comments (0)