
Remember me




Ultrasound elastography for breast lesion characterization has been used for over 20 years. There are 2 sonographic imaging techniques for noninvasive assessment of tissue stiffness: strain elastography (SE) and shear wave elastography (SWE).1–4 In SE, a strain map is generated reflecting the relative stiffness between adjacent tissues after the application of an external force (from physiological motion or transducer compression). Although qualitatively useful, the strain depends on the stress applied, which is generally unknown. However, in breast elastography, there is a unique finding when comparing the B-mode to SE lesion size. When compared with the maximum length of the lesion of B-mode, the maximum length of the lesion is larger on SE in malignant lesions and smaller in benign lesions. This elastography–to–B-mode length ratio has been shown to have a high sensitivity and specificity for breast lesion characterization.5 In SWE, a shear wave is generated within the target tissue via the application of acoustic radiation force. This shear wave propagates perpendicular to the beam axis with the shear wave speed (SWS) dependent on tissue stiffness. Because the SWS is orders of magnitude slower than acoustic waves, the same ultrasound transducer can be used to track shear wave propagation. The SWE, unlike SE, produces quantitative results.5 Early versions of SE had a steep learning curve, but in most systems now available, the learning curve is identical to SWE. The Breast Imaging Reporting and Data System (BI-RADS) suggests the use of ultrasound elastography to upgrade BI-RADS 3 lesions and downgrade BI-RADS 3 and BI-RADS 4A lesions.6
Multiple in vivo studies have shown that 2D-SWE and SE can characterize breast lesions with high sensitivity and specificity since malignant lesions are often significantly stiffer than benign lesions.7–13 However, 2D-SWE is less accurate than SE as up to 25% of cancers are artifactually soft or “blue” on 2D-SWE and do not reach threshold values for defining malignancy.9,14 This short fall of 2D-SWE compared with SE occurs on every ultrasound system and is felt to be due to the histology of the malignancy.8 This has been shown to be an artifact due to the marked stiffness and hypoechogenicity of the cancer, which can be identified in many cases with the use of a quality/confidence map that assesses the quality of the shear waves.8 In these cases of false-negative cancers on SWE, the SE images are always suggestive of a malignancy.2 In this article, a new Food and Drug Administration (FDA)–approved 2D-SWE algorithm is evaluated that substantially eliminates the false-negative cases on SWE thus markedly improving the diagnostic accuracy of SWE to characterize breast lesions as benign or malignant.
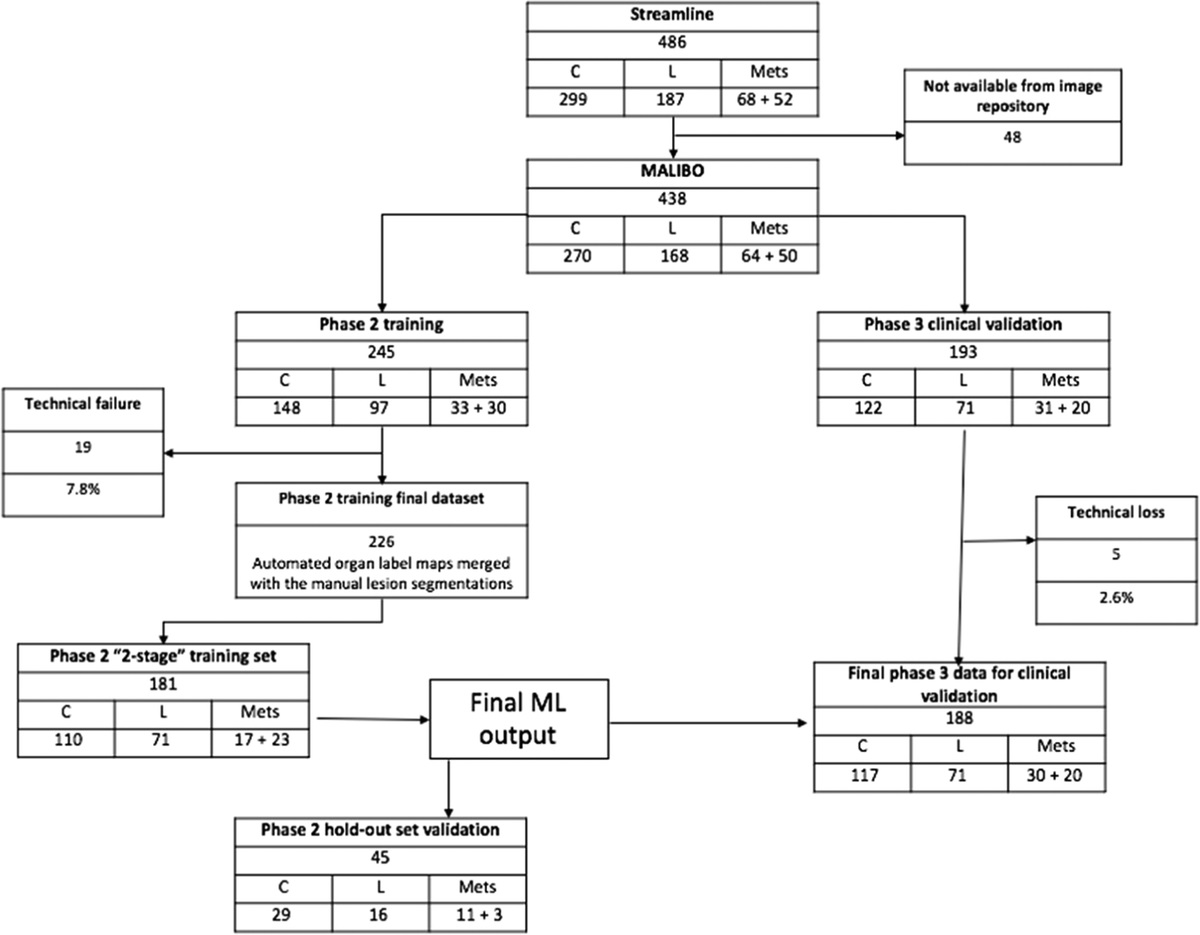
MATERIALS AND METHODS ParticipantsThis single-center retrospective observational study from prospectively collected data was approved by our local institutional review board and was Health Insurance Portability and Accountability Act compliant. Equipment support was provided by Siemens Healthineers (Issaquah, WA). The nonconsultant authors had control of the data and information that might present a conflict of interest for the other employee or consultant authors. All measurements were performed by the nonconsultant authors. Patients scheduled for a screening or diagnostic breast ultrasound from April 25, 2019 to May 2, 2022 performed on an ultrasound system modified to save raw data from shear wave examinations were included in this study. There were 2069 breast 2D-SWE acquisitions saved. After removing acquisitions taken in areas without a lesion and poor-quality acquisitions, there were 1193 evaluable acquisitions. Removing duplicate images from the same lesion, as well as those without biopsy diagnosis or stability over 2 years, there were 298 patients with 394 lesions. Figure 1 is the flowchart on patient/lesion selection.
 FIGURE 1:
 Flowchart of patient and lesion selection.
Ultrasound ExaminationBreast ultrasound examinations were performed on a Siemens Sequoia ultrasound unit (Issaquah, WA) modified to store raw shear wave data using a linear 10-MHz probe with FDA-approved 2D-SWE using the standard algorithm (SA). Examinations were performed by 1 of 6 sonographers, all with at least 3 years' experience in performing breast elastography, or 1 radiologist with at 20 years' experience in performing breast elastography. A light touch technique15 was used in acquiring the image. Both SE and 2D-SWE were obtained on each lesion in the same setting. Strain elastography of the lesion was obtained as previously described.2 When more than one 2D-SWE data acquisition was performed, the acquisition with the least number of artifacts was used for analysis. Results of the new FDA-approved algorithm (NA) were not used in diagnosis. Raw shear wave data obtained from these lesions were proceeded using the SA and the NA. A 5-mm region of interest was placed in the highest stiffness within the lesion or adjacent 3 mm rim on the SA image based on visual inspection of the stiffness map and then calculated in the same location on the NA image. Maximum stiffness values in m/s in this location from both algorithms were recorded. Strain elastography was obtained and recorded on the lesions as previously described.2,7 The elastography–to–B-mode distance ratio (E/B) of <1.0 was considered benign, whereas ≥1.0 was considered malignant.
DiagnosisAll images were obtained before biopsy. Lesion biopsies were performed using a 12-gauge core needle under ultrasound guidance. Three or four samples were obtained and evaluated by 1 of 4 pathologists each with greater than 10 years' experience in evaluating breast biopsies. Lesions were considered benign if biopsy proven or remained stable on ultrasound images for 2 years. Clinical diagnosis of mastitis13 was confirmed with resolution after treatment and was included as benign lesions. All malignant lesions were biopsy proven with final pathology, tumor grade, and tumor markers recorded. The lesion BI-RADS score assigned on mammography (if performed) and ultrasound report at the time of initial evaluation were recorded.
Statistical AnalysisQuantitative variables were described as mean, SD, and range and/or median and interquartile range. Categorical variables were described as counts and percentages. The area under the receiver operating characteristic curve (AUROC) and statistics were presented using the binomial exact 95% confidence interval (CI). Fisher exact test was used to compare results between SA and NA and between NA and SE. The analyses were performed using Stata v16.1 (StataCorp). P values less than 0.05 were considered statistically significant.
RESULTSThere were 266 benign lesions and 128 malignant lesions. The mean patient age was 56.3 ± 16.1 years (range, 21–93 years). The mean age for patients with benign lesions was 51.1 ± 15.5 years (range, 21–93 years), whereas for malignant lesion was 63.8 ± 14.5 years (range, 38–92 years; P < 0.01). The mean lesion size was 12.0 ± 8.2 mm (range, 2–46 mm). The mean benign lesion size was 10.7 ± 8.0 mm (2–46 mm), whereas the mean malignant lesion size was 14.9 ± 7.8 mm (4–36 mm; P < 0.01). There were 201 benign (>2-year follow-up or clinically diagnosed as mastitis) and 193 biopsied lesions (65 benign, 128 malignant). The mean stiffness value obtained in the lesion or surrounding 3 mm (SD) for benign lesions was 2.37 m/s (1.26 m/s) for SA and 3.51 m/s (2.05 m/s) for NA, whereas for malignant lesions, 4.73 m/s (1.71 m/s) for SA and 8.45 m/s (1.42 m/s) for NA. For SE, there was 235 benign lesions with an E/B ratio of <1.0 (235/266; negative predictive value [NPV], 88.3%) and 31 benign lesions with a ratio of ≥1.0 (31/266, 11.7%). For malignant lesions, there was 128 lesions with a ratio >1.0 (128/128, 100%) and 0 lesions with a ratio of <1.0 (0/128, 0%). Demographics of the patients and lesion characteristics are listed in Table 1.
TABLE 1 - Demographic Data of Patients and Lesions Characteristic Mean SD Min Max Male/female 8/290 Age 56.3 y 16.1 y 21 y 93 y Age benign lesions 51.1 y 15.5 y 21 y 93 y Age malignant lesions 63.8 y 14.5 y 38 y 92 y Benign/malignant 266/128 Biopsies/2 year F/U 193*/201 Lesion size all 12.0 mm 8.2 mm 2 mm 46 mm Benign lesion size 10.7 mm 8.0 mm 2 mm 46 mm Malignant lesion Size 14.9 mm* 7.8 mm 4 mm 36 mmP < 0.001
*Includes 13 cases of mastitis diagnosed clinically.
F/U, follow-up.
Differences of the stiffness values for the benign and malignant lesions were statistically significant for both SA (P < 0.0001) and NA (P < 0.0001). The BI-RADS mammography and ultrasound scores assigned at the time of the examination are presented in Table 2. Table 3 lists the pathology of the lesions. The results using the SA and NA are presented in Table 4. The optimal cutoff value using NA was 5.63. However, to increase the sensitivity at the expense of specificity, a cutoff value of 5.0 m/s was selected. Results using a cutoff value of 5.0 m/s are presented in Table 5.
TABLE 2 - BI-RADS Scores for the Mammogram and Ultrasound Examinations at Time of SWE Acquisition BI-RADS Score Mammography Ultrasound Not performed 48 0 1 119 0 2 63 152 3 19 69 4A 53 28 4B 43 60 4C 12 31 5 37 54 ≥4 145 173PASH, pseudoangiomatous stromal hyperplasia; DCIS, ductal carcinoma in situ; IDC, invasive ductal cancer; LCIS, lobular carcinoma in situ; LDC, lobular ductal carcinoma.
SA, standard algorithm; NA, new algorithm; AUROC, area under the receiver operating characteristic curve; PPV, positive predictive value; NPV, negative predictive value; PLR, positive likelihood ratio; NLR, negative likelihood ratio; DOR, diagnostic odds ratio.
SA, standard algorithm; NA, new algorithm; PPV, positive predictive value; NPV, negative predictive value; PLR, positive likelihood ratio; NLR, negative likelihood ratio.
The AUROC increased from 0.87 (95% CI, 0.83–0.91) to 0.95 (95% CI, 0.93–0.97) with the use of the NA using the optimal cutoff value. The difference is statistically significant (P < 0.0001). The NPV increased from 0.89 (95% CI, 0.85–0.94) to 0.99 (95% CI, 0.97–1.00). The AUROC curve for SA is presented in Figure 2, and the AUROC for NA is presented in Figure 3. Box plots of the results are presented in Figure 4.
 FIGURE 2:
 AUROC for the results of using the standard algorithm.
 FIGURE 3:
 AUROC for the results of using the new algorithm.
 FIGURE 4:
 Box plot for the both the standard algorithm and the new algorithm.
When a threshold value of 5.0 m/s (within the lesion or surrounding 3 mm) was selected, the sensitivity increased from 0.45 (95% CI, 0.36–0.53) using the SA to 1.00 (95% CI, 1.00–1.00) using the NA, whereas the specificity decreased from 0.94 (95% CI, 0.91–0.97) using the SA to 0.81 (95% CI, 0.76–0.85) using a cutoff value of 5.0 m/s. The difference is statistically significant (P < 0.0001 for both sensitivity and specificity). The NPV increased from 0.78 (95% CI, 0.73–0.82) to 1.00 (95% CI, 1.00–1.00). Table 5 presents the results with the use of a 5.0 m/s threshold.
Based on the positive likelihood ratio (PLR) and negative likelihood ratio (NLR) values using a 5.0 m/s threshold, the probability of malignancy changes is presented in Table 5. Table 6 is the probability of malignancy with positive and negative tests by BI-RADS Category (Max SWV) using the NRL of 0.00 obtained from the NA.
TABLE 6 - Probability of Malignancy With Positive and Negative Tests by Ultrasound BI-RADS Category (Max SWV) Using the NRL for the New Algorithm Pretest Posttest (Negative) Posttest (Positive) BI-RADS 3 2.0% 0.00% (0.00%–0.00%) 9.76% (7.84%–12.26%) BI-RADS 4A 10.0% 0.00% (0.00%–0.00%) 37.06% (31.66%–43.22%) BI-RADS 4B 50.00% 0.00% (0.00%–0.00%) 84.13% (80.66%–87.26%) BI-RADS 4C 95.00% 0.00% (0.00%–0.00%) 99.02% (98.75%–99.24%) BI-RADS 5 100.00% 100.00% (100.00%–100.00%) 100.00% (100.00%–100.00%)Results for studies using the max shear wave speed with a cutoff value of 5.0 m/s. Each row represents the upper limit for each BI-RADS category. The pretest probability for each category is equal to the lower limit of the antecedent category. Values reported as mean (95% confidence interval).
The false-negatives on SA include ductal carcinoma in situ (DCIS) 1 (2.0%), invasive ductal cancer (IDC) 40 (78.4%), IDC with papillary features 1 (2.0%), IDC with mucinous features 3 (5.9%), IDC with DCIS 5 (9.8%), and ILC with lobular carcinoma in situ (LCIS) 1 (2.0%). False-positives from the NA included mastitis/abscess 8 (31.4%), 2-year follow-up no change 4 (15.7%), fibroadenoma 4 (13.7%), stromal fibrosis 2 (7.8%), fat necrosis 2 (5.9%), intraductal papilloma 2 (5.9%), sclerosing adenosis 2 (3.9%), foreign body reaction 2 (3.9%), lactating changes 1 (2.0%), pseudoangiomatous stromal hyperplasia 1 (2.0%), fibrosis with inflammation 1 (2.0%), complicated cyst 1 (2.0%), scar 1 (2.0%), and infected cyst 1 (2.0%). There were no false-negatives.
Table 7 lists the results based on the ultrasound BI-RADS score for benign lesions, whereas Table 8 lists the results based on the ultrasound BI-RADS score for malignant lesions. With the NA, 64/68 (94.1%) of BI-RADS 3 lesions could be downgraded to BI-RADS 2, whereas 15/23 (65.2%) of BI-RADS 4A, 5/19 (26.3%) BI-RADS 4B, and 1/4 (25%) of BI-RADS 4C could be downgraded to BI-RADS 2.
TABLE 7 - Benign Lesions on Pathology or 2-Year Follow-up With Results Using the SA, NA, and E/B Techniques Based on the Ultrasound BI-RADS Category Score US BI-RADS BR 2 BR 3 BR 4A BR 4B BR 4C BR 5 Total SWE NA B 149 (98.0%) 64 (94.1%) 15 (65.2%) 5 (26.3%) 1 (25.0%) 0 (0.0%) 234 (88.0%) SWE NA M 3 (2.0%) 4 (5.9%) 8 (34.8%) 14 (73.7%) 3 (75%) 0 (0.0%) 32 (12.0%) SWE NA total 152 68 23 19 4 0 266 SWE SA B 151 (99.3%) 65 (95.6%) 21 (91.3%) 13 (68.4%) 2 (50.0%) 0 (0.0%) 252 (94.7%) SWE SA M 1 (0.7%) 3 (4.4%) 2 (8.7%) 6 (31.6%) 2 (50.0%) 0 (0.0%) 14 (5.3%) SWE SA total 152 68 23 19 4 0 266 SE B 149 (99.3%) 55 (80.9%) 19 (82.6%) 12 (63.2%) 0 (0.0%) 0 (0.0%) 235 (88.3%) SE M 3 (0.7%) 13 (19.1%) 4 (17.4%) 7 (36.8%) 4 (100.0%) 0 (0.0%) 31 (11.7%) SE total 152 68 23 19 4 0 266US, ultrasound; SWE, shear wave elastography; NA, new algorithm; SA, standard algorithm; SE, strain elastography; B, benign; M, malignant.
US, ultrasound; SWE, shear wave elastography; NA, new algorithm; SA, standard algorithm; SE, strain elastography; B, benign; M, malignant.
Using the SA in cancers, there were 31 (24.2%) high SWS within the lesion, 46 (35.9%) with high SWS rim only, and 51 (39.8%) with no elevated SWS. With the NA, there were 121 (94.5%) high SWS within the lesion, 7 (5.5%) with high SWV rim only, and 0% with no SWS elevation. Figure 5 and Figure 6 show examples of before and after cases for malignant lesions, which are low SWS on SA and high SWS on NA. Figure 7 is an example of a rim of high SWS on SA, which is high SWS within the lesion.
 FIGURE 5:
 Images of the same lesion processed using (left) the SA method and (right) the NA method from a 79-year-old female patient who presented with abnormal screening mammogram. On the SA, the lesion shear wave speed was 1.40 m/s, whereas on the NA, the shear wave speed was 7.90 m/s. On biopsy, the lesion was an invasive pleomorphic lobular cancer, ER+, PR−, HER2−, Ki-and 67 80%. On the SA, the lesion was a false-negative, whereas on the NA was a true-positive.
 FIGURE 6:
 Images of the same lesion processed using (left) the SA method and (right) the NA method from a 50-year-old female patient who presented palpable mass left breast. The patient's diagnostic 3D mammogram was negative. Patient's breast density on mammography is extremely dense. Ultrasound was performed. On the SA, the lesion shear wave speed was 1.28 m/s, whereas on the NA, the shear wave speed was 7.23 m/s. On biopsy, the lesion was an invasive lobular cancer ER+, PR+, HER2−, and Ki-67 10%. On the SA, the lesion was a false-negative, whereas on the NA was a true-positive.
 FIGURE 7:
 Images of the same lesion processed using the SA method (A) and the NA method (B) from a 40-year-old female patient who presented with a palpable mass right breast and an irregular mass on 3D mammography. Ultrasound with biopsy was performed. On the SA, the lesion with a rim of high shear wave speed is noted (7.5 m/s); however, the cancer itself is “soft” (color coded mostly green). On the NA, the tumor itself has a high stiffness value (>10.0 m/s), confirming the tumor is extremely stiff. Having the tumor color coded as markedly stiff increases confidence, the lesion is malignant. The lesion was an invasive ductal cancer, grade 3 with micropapillary, and mucinous differentiation with high-grade ductal carcinoma in situ with comedonecrosis, ER+, PR+, HER2−, and Ki-67 30%.
DISCUSSIONThe NA was developed to address the high false-negative rate of the SA. The NA was designed to overcome the problem of stiff cancers by significant improvements to the detection and discrimination of shear waves in low signal to noise lesions. By using a new SWE breast algorithm with a threshold value of 5.0 m/s (within the lesion or surrounding 3 mm), the sensitivity increased from 0.45 (0.36–0.53) to 1.00 (1.00–1.00) using the NA compared with the SA, whereas the specificity decreased from 0.94 (0.91–0.97) to 0.81 (0.76–0.85). The NPV increased from 0.78 (0.73–0.82) to 1.00 (1.00–1.00). By using the NA, the results using SE and 2D-SWE are substantially similar. It is important to note t
Comments (0)