
Remember me


This was an observational multicentre cohort study in which patients were stratified by age (≥ 70 and < 70 years) and triage urgency (non-urgent (blue and green) and (very) urgent (yellow, orange and red); see Fig. 1). We used data from the Netherlands Emergency department Evaluation Database (NEED). The NEED is the Dutch quality registry of Eds and contained data from seven Eds in six Dutch hospitals: two tertiary care centres with an annual census of 16,000–20,000 ED visits, and 4 urban hospitals with approximately 20,000–36,000 ED visits annually, typical numbers for Dutch ED’s. The two of the seven included tertiary care centres in the Netherlands are University Medical Centres and level 1 trauma centres and have all facilities (Thoracic and neuro surgery, Percutaneous Coronary Intervention, Intra Arterial Thrombectomy, ICUs, etc.). One is located in the eastern part of the Netherlands and one is located in the western part of the Netherlands. The four teaching hospitals are located in different regions in the Netherlands. They have a varying range of facilities but not all facilities. Together they are a representative sample of the Dutch ED landscape. In general, work flows in the Netherlands are aimed to finish ED work-up within 4 h. Since blood tests, radiological testing (especially CT scans and ultrasounds) and consultations of other specialties account for most of the time spend in the ED [18], it is attempted to initiate this as early as possible. In many Dutch EDs, blood tests are taken by nurses by the time of triage (advance triage). In some hospitals, there are extra radiologists in training present in the ED during busy hours (evening shifts) or an acute radiologist is present in the ED. In many hospitals, patients from the ED are initially admitted to an Acute Admission Ward. In most participating EDs of this study, there are 24/7 emergency physicians. One study showed that from 63 of 94 EDs in the Netherlands in 2012, the mean ED LOS of patients discharged from the ED was 119 (SD 40) min. while the mean ED LOS of patients admitted to the hospital was 146 (SD 49) min [13].
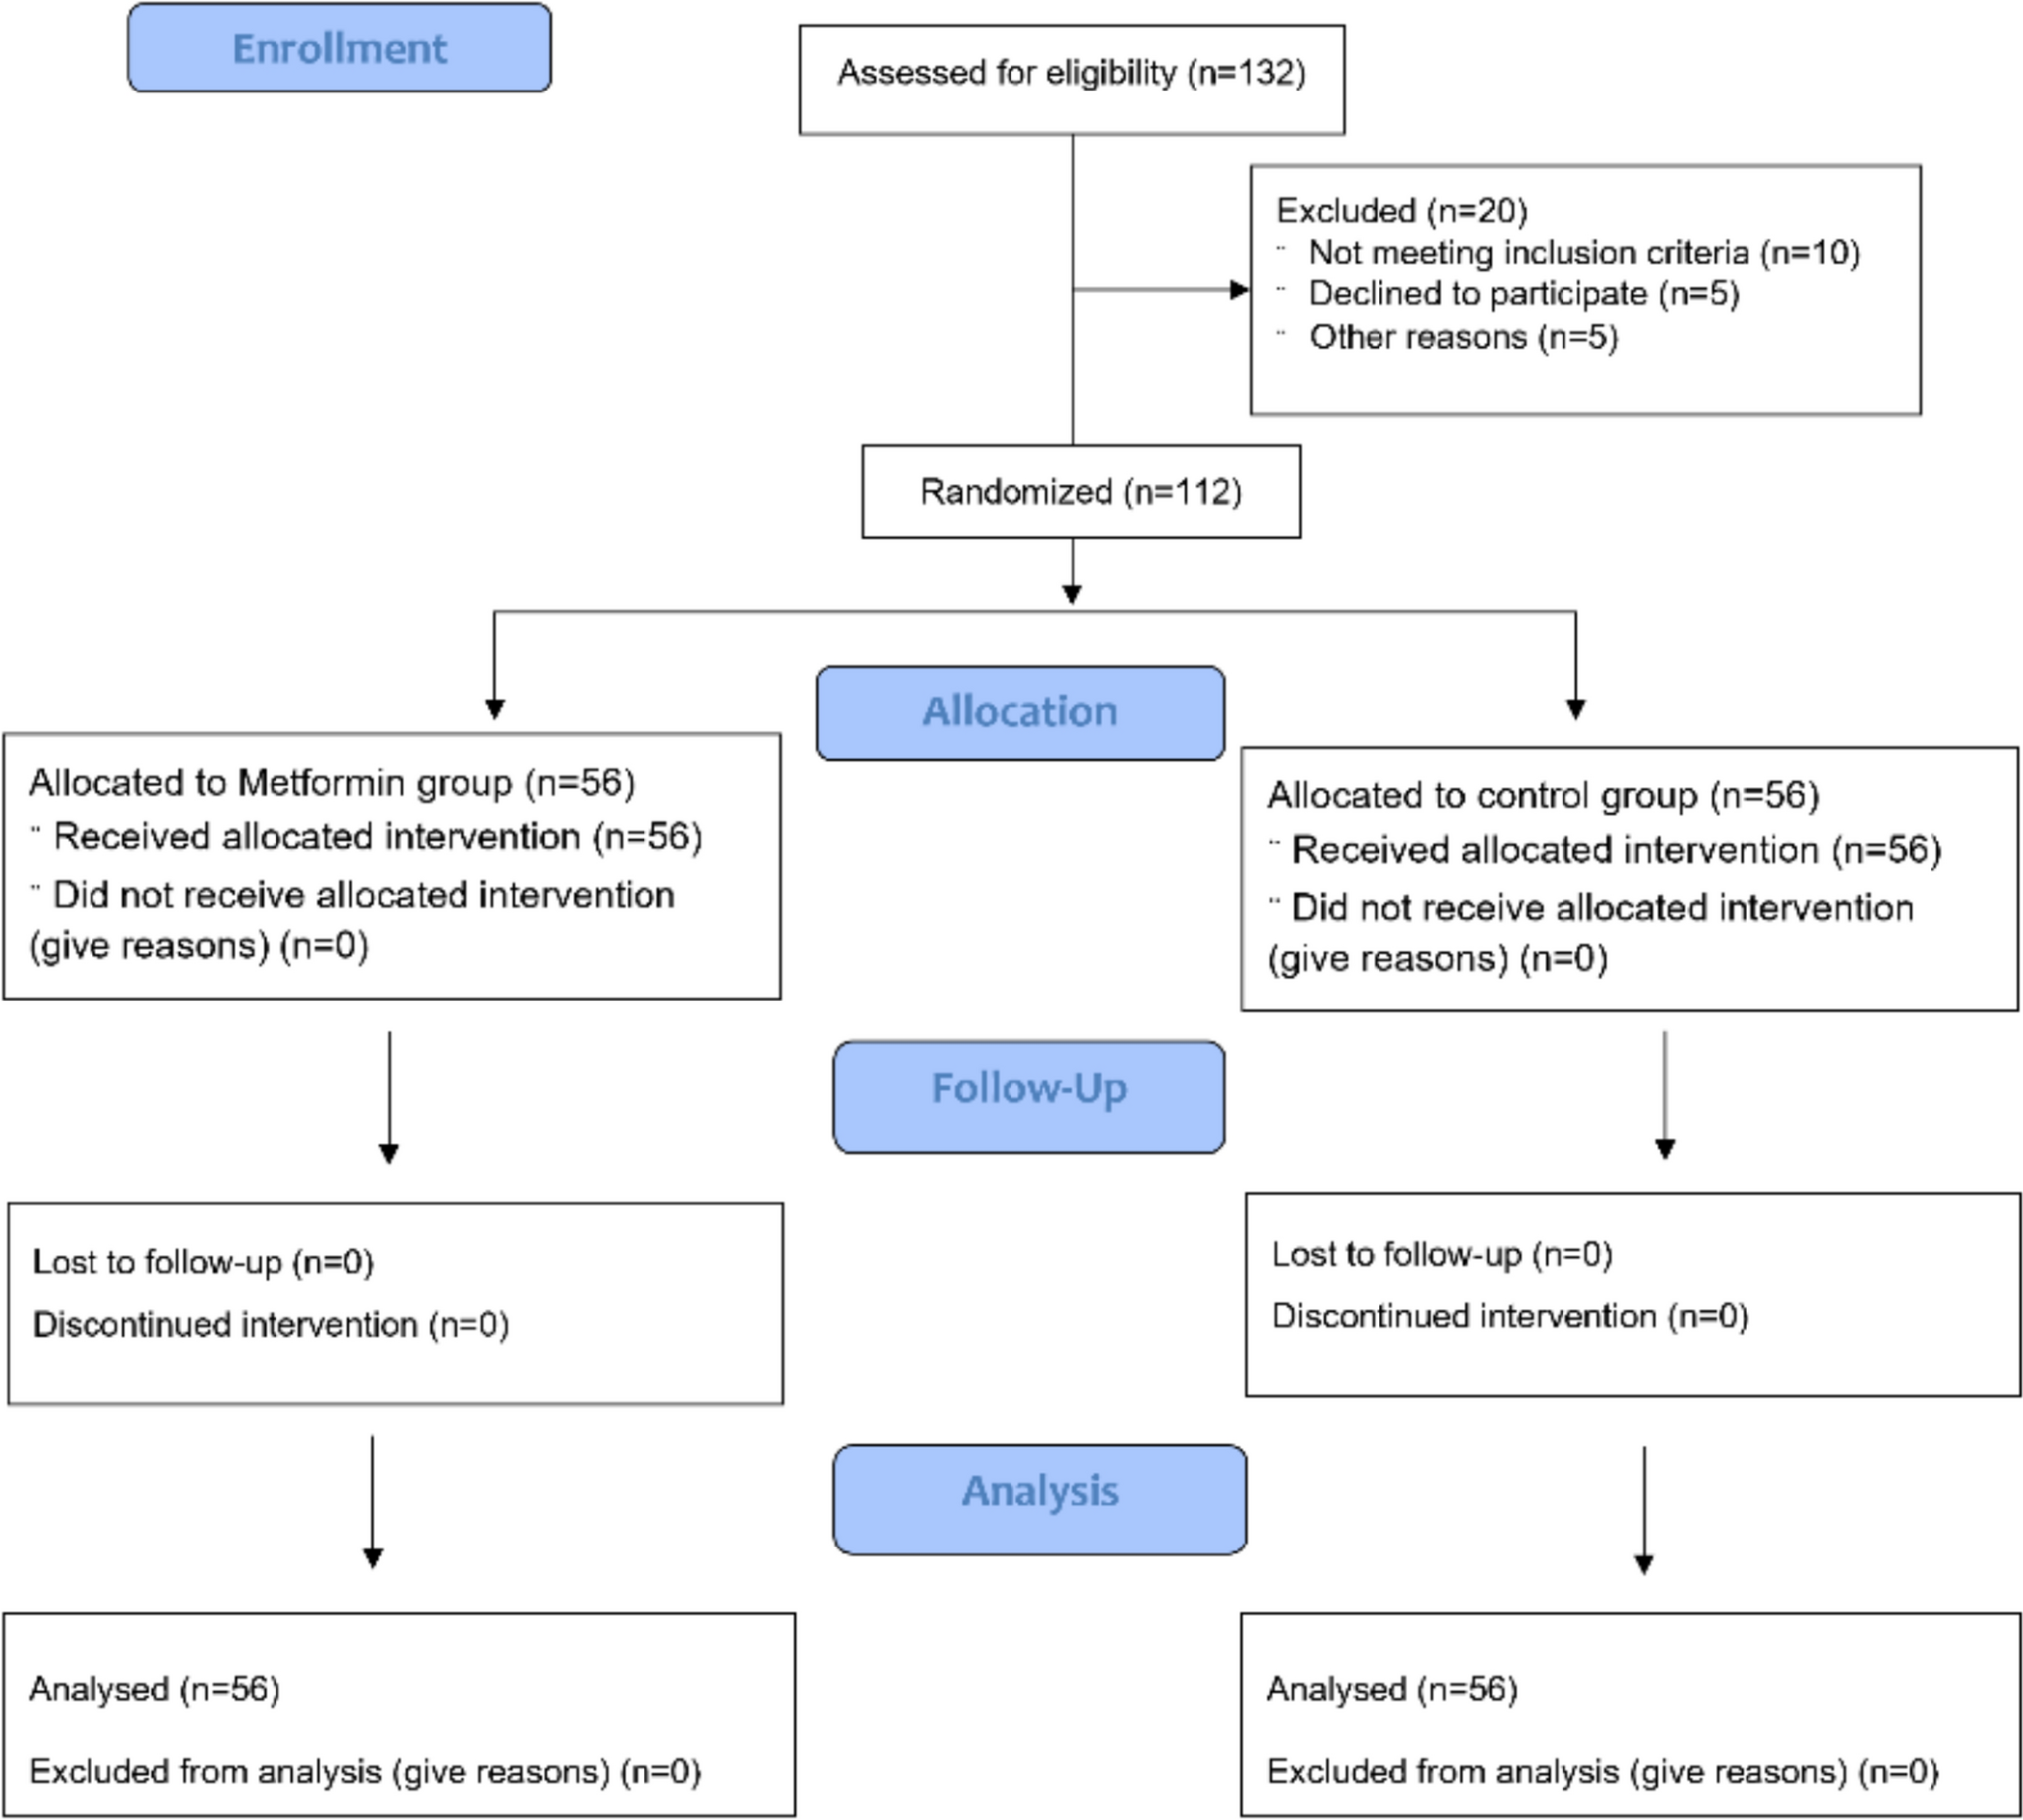
Fig. 1
Patient inclusion and flow through study. Disease severity was indicated by triage category (non-urgent: green/blue, urgent: yellow/orange/red). aOther reasons: discharge against medical advice, left without seeing doctor, self-initiated departure, left before completion of treatment, transfer to another hospital, scheduled outpatient check-up or out-of-hours GP service. ED emergency department; GP general practitioner
The medical ethics review committee of the Radboudumc (METC Oost) declared that the research did not fall under the Medical Research Act, and waived the need for informed consent since this was an observational study (file no. 2023-16299).
Study populationInclusion criteriaConsecutive ED patients who visited the ED between 1 January 2017 and 31 December 2022 were included.
Exclusion criteriaPatients aged 17 years or younger.
Data collectionFrom the participating hospitals and included patients, information is collected through the NEED about patient, ED and hospital characteristics. Detailed information about the information acquired in the NEED is available in Supplemental File 1.
Study parametersDetailed information about study parameters is available in Supplemental File 1.
Briefly, the following variables were collected: Patient characteristics: Demographics (age, gender), triage category and presenting complaints, vital signs, time and method of referral and arrival, type and number of diagnostic tests. As a proxy for comorbidity and complexity of patients we used the number of consultations in the ED and performance of laboratory or radiological tests [18, 19]. ED length of stay has been calculation by subtraction of the time of ED registration at the ED registration desk from the time of ED discharge.
Study outcomesThe primary outcome was hospital LOS equal to or exceeding the median LOS. Patients who were brought into the ED already deceased (which may occur in cases requiring cardiopulmonary resuscitation) or who died while in the ED were excluded, primarily based on the rationale that the ED LOS was unlikely to have exerted any influence on their outcome.
Sample size calculationWe used the rule of thumb that approximately 5–10 events per variable are needed to prevent overfitting in association models [20, 21]. We aimed to adjust for ~ 23 potential confounders in the regression analysis with hospital LOS ≥ 3 days as outcome. We therefore needed approximately 230 events per age/disease severity category to prevent overfitting. On average, we have 0.33 × 700,000 = 233,333 hospitalized patients [15, 22]. Of whom approximately 116,500 will be hospitalized for more than median hospitalization duration of 3 days. We expected, therefore, to have more than enough events per variable to adjust for the planned 23 potential confounders.
Statistical analysisDescriptive statisticsData were presented as mean (standard deviation (SD)) when normally distributed. Skewed data were presented as median (interquartile range (IQR)). Categorical data were presented as number (%).
Differences among strata with respect to outcomes were assessed as follows: Continuous data were compared using student t-tests or Mann–Whitney U-tests, as appropriate. Descriptive categorical data were analyzed using chi-square tests.
Objective 1 and 2: main statistical analysesIn Fig. 1, a schematic representation of the study design and analysis plan is shown. We considered age and triage urgency to be effect modifiers of the primary associations of interest. Our hypothesis was that the association between ED LOS and hospital LOS would be different in ED patients aged 70 years or older compared to ED patients younger than 70 years, and in ED patients with low and high triage urgence. For this reason, we developed multivariable regression models for hospital LOS in the two age categories (< and ≥ 70 years) and the two triage categories (low and high triage urgency). Because we considered that the primary determinant ED LOS might not to be linearly associated with the primary outcomes, we categorized ED LOS in categories < 4 h, 4–8 h, and > 8 h. The 4 h cut-off was chosen because in the Netherlands (but also other countries) 4 h is often considered a time span in which ED work-up, i.e. taking history, physical examination, diagnostic testing and decision making, can be finished. To assess whether ED LOS was associated with the primary outcome, we developed association models [20, 21] using multivariable logistic regression analyses with backward stepwise elimination of variables with P > 0.05. In the multivariable regression analyses, the following potential confounders were included: patient demographics (age and sex), presenting complaint (most frequent top 10), vital signs (measured or not) Glasgow coma scale (GCS), number of consultations in the ED, laboratory and radiology testing ED (0 = no, 1 = yes) and discharge destination (ward/MCU/ICU; as a measure of disease severity). Because comorbidities are not registered in the NEED, we used proxies (consultations, laboratory and radiology testing) of co-morbidities and complexity as it was previously shown that these proxies are associated with comorbidities and complexity [18, 19].
Unadjusted and adjusted Odds Ratios (OR) and other outcomes were reported with 95% confidence intervals (95% CI). A P value < 0.05 was considered to be statistically significant. We corrected for multiple comparisons according to the method of Bonferroni. P values were therefore multiplied by 3 as there are 4 age/disease severity groups).
Data were analyzed using SPSS (SPSS, version 29.0, IBM, New York, USA).
We have added analyses without dichotomization, i.e. with predictors as continuous or ordinal variables. We used the R package mgcv15, to fit a generalized additive logistic regression model (GAM) to the binary outcome hospital LOS > 3 days. In this model, the log odds of the outcome depends in an arbitrary way on all predictors (ED-LOS, age and triage category) and all their interactions. Clearly, such a complex model is overparameterized which could lead to poor, unstable performance if left unaddressed. However, it can be handled as part of the fitting procedure by using a quadratically penalized likelihood type approach. Effectively, this method enforces a smooth dependence of the log odds mortality on the three predictors. To visualize the association between the two outcomes and the predictors, we generated a graph. The stratified analyses using multivariable logistic regression analyses allowed us to adjust for multiple confounders, while the GLM allowed us to verify that the results were similar and not changed by the stratification/dichotomization.
Sensitivity analysesTo investigate the impact of the way in which we adjust for disease severity we used various other proxies of disease severity like triage category, GCS, additional testing, and discharge destination in all regression models. In addition, we did a sensitivity analysis without ICU patients. Finally, we tested whether the results were affected by the COVID period by leaving out the patients who visited the ED between 11 March 2020 and 31 December 2022.
Comments (0)