
Remember me

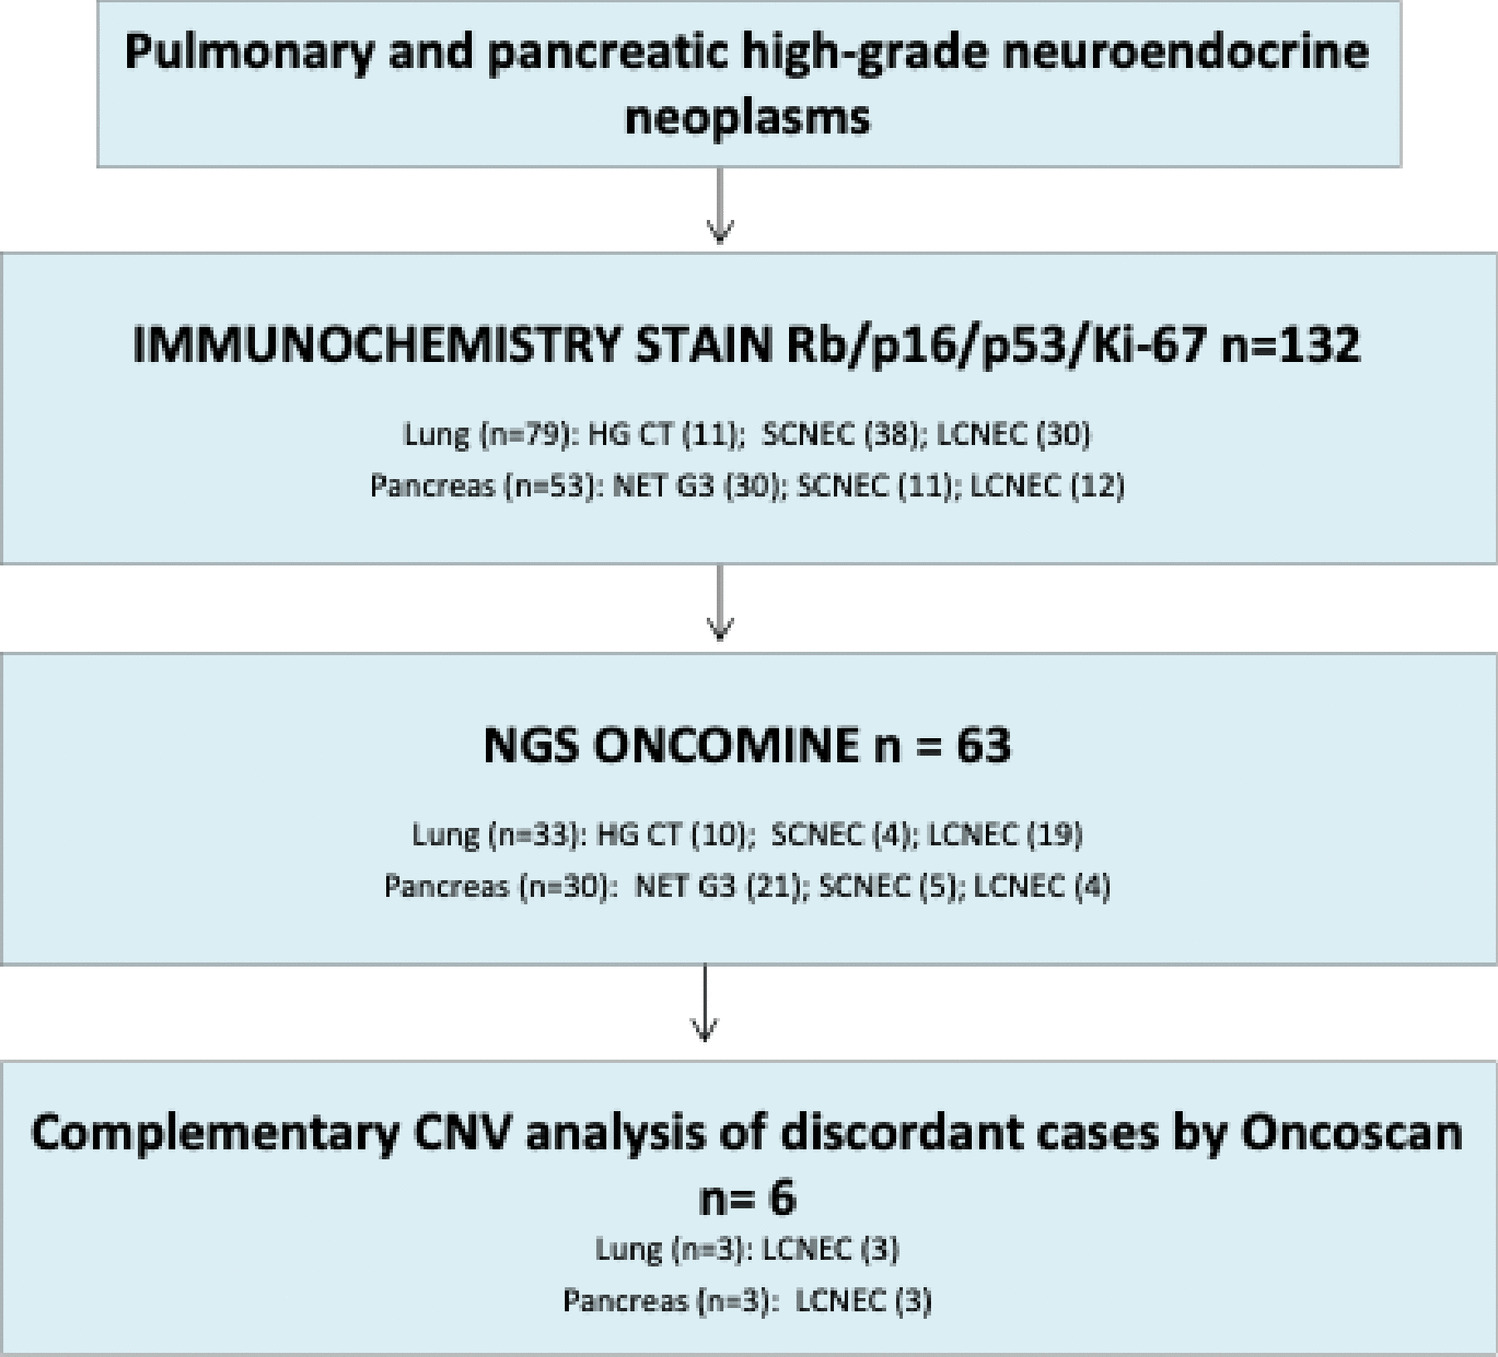


We reviewed pathology reports of 2197 patients who underwent surgery for PTC and received BRAF molecular testing at Seoul St. Mary’s Hospital from January 2021 to December 2023. Among them, 26 cases did not undergo BRAF mutation testing and were excluded. Of the remaining 2171 cases, BRAF p.V600E mutation was detected in 87.2% (1894/2171). The remaining 277 PTCs (12.8%) were BRAF p.V600E-negative, and pan-TRK IHC was performed on 107 of these cases. The immunostaining results were then compared with clinicopathologic findings, histologic features, and molecular testing results. The experimental design of this study is outlined in Fig. 1.
Fig. 1
Study design for gene fusion identification in papillary thyroid carcinoma (PTC). Pan-TRK immunohistochemistry (IHC) was performed on 107 cases of BRAF p.V600E-negative PTC, followed by targeted RNA sequencing in 45 IHC-positive cases to identify gene fusions. Among these, NTRK fusions were detected in 17 cases (38%), RET fusions in 13 cases (29%), and no fusions were identified in 14 cases (31%)
Histopathologic AnalysisAll slides were digitally scanned at 40 × magnification (0.25 µm per pixel) using a Philips Ultrafast Scanner (Philips, Amsterdam, Netherlands) for primary diagnosis. Three pathologists (HL, SYK, and CKJ) independently reviewed all hematoxylin and eosin-stained whole slide images using the IntelliSite Image Management System (Philips). In cases of disagreement, the pathologists reached a consensus through joint review and discussion. Histologic subtypes were classified according to the 5th edition of the World Health Organization Classification of Tumors. Predominant follicular architecture was defined as present when it constituted over 50% of the tumor. Solid, trabecular, or insular growth patterns, along with intratumoral fibrosis, clear cells, and secretory-like cells, were considered present if they comprised more than 10% of the tumor. Cancer staging was assigned following the 8th edition guidelines of the American Joint Committee on Cancer (AJCC) Staging Manual.
BRAF Mutation AnalysisGenomic DNA was extracted from 5-μm-thick sections of formalin-fixed, paraffin-embedded tissue following manual microdissection. The BRAF p.V600E mutation was assessed using real-time PCR clamping technology with the PNAClamp™ BRAF Mutation Detection Kit (Panagene, Daejeon, Korea) [18].
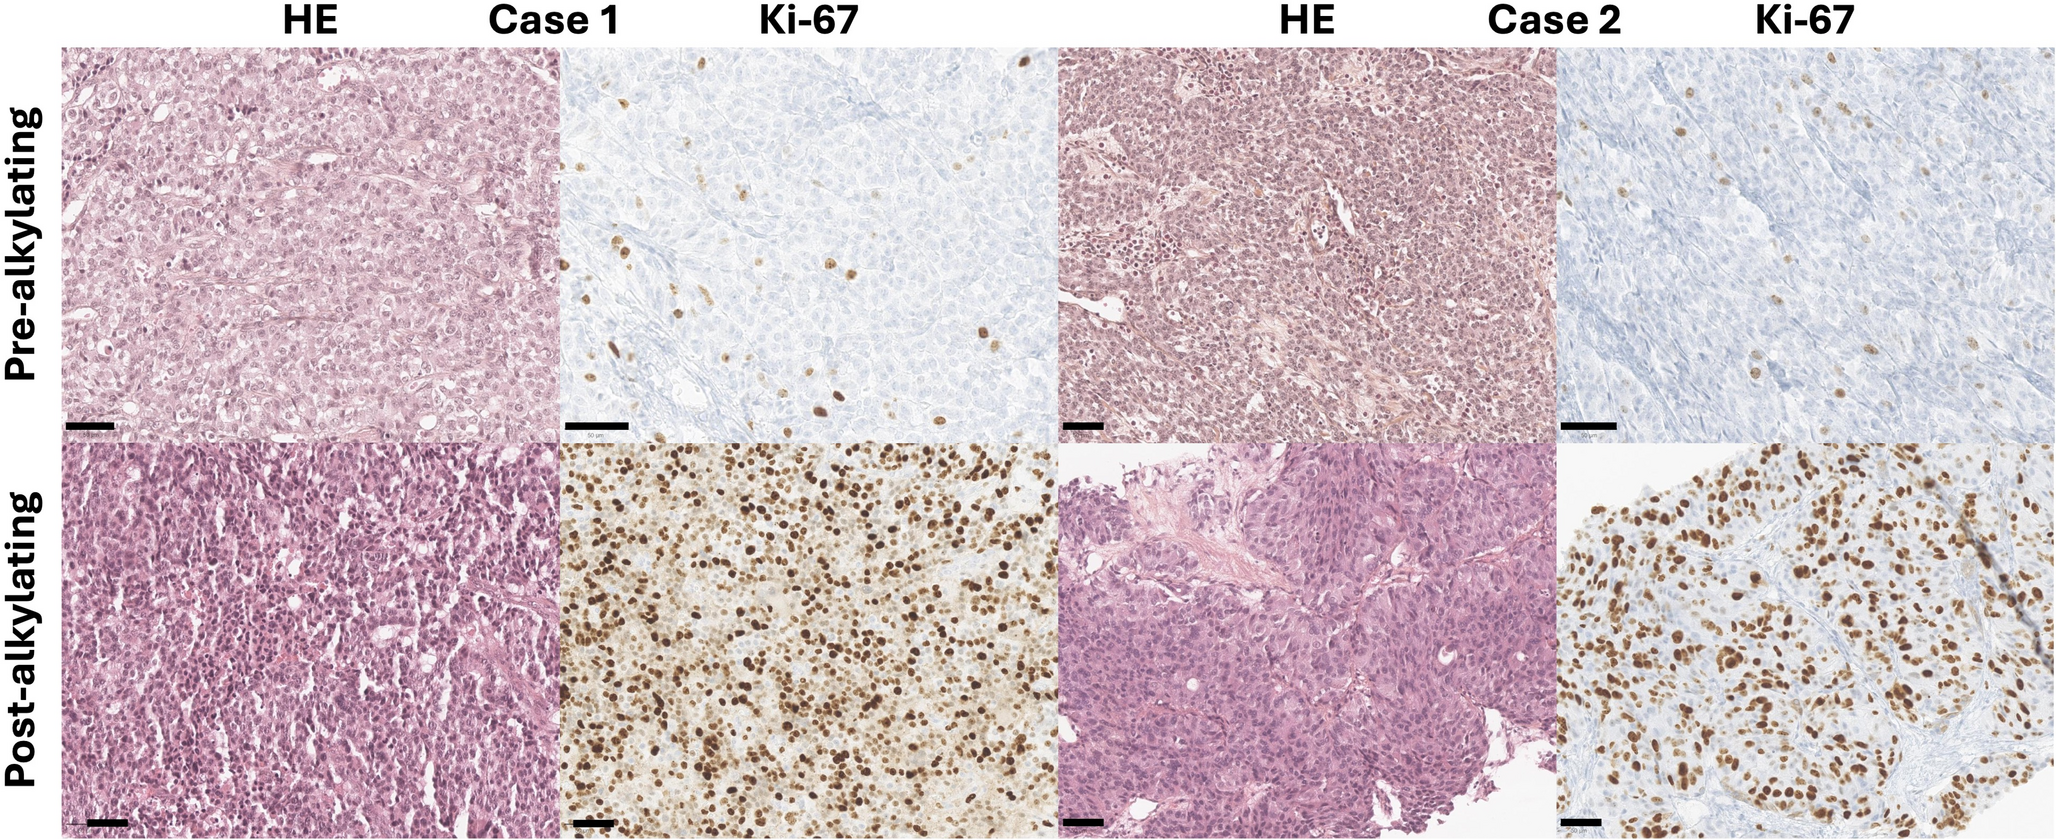
ImmunohistochemistryImmunohistochemical staining for pan-TRK was conducted using the EPR17341 Ventana assay (Roche Diagnostics, Tucson, AZ, USA) according to the manufacturer’s protocol on an automated Ventana BenchMark ULTRA Staining System (Roche Diagnostics). The immunoreaction was visualized with the Ventana OptiView DAB Immunohistochemical Detection Kit. For digital image analysis, all slides were scanned at 20 × magnification with a NanoZoomer S360 Digital Slide Scanner (Hamamatsu Photonics, Hamamatsu, Japan). Scanned IHC images were processed using QuPath software (version 0.4.3) [19]. Immunohistochemical evaluation included assessment of staining localization (membranous, cytoplasmic, nuclear, or mixed) and intensity, quantified by an H-score (Fig. 2). The H-score was calculated by multiplying a four-tiered intensity score (completely negative cells; 0, weakly positive cells; 1 + , moderately positive cells; 2 + , and strongly positive cells; 3 +) by the percentage of positively stained cells [20, 21].
Fig. 2
Representative pan-TRK immunohistochemistry images with corresponding H-scores. A Papillary thyroid carcinoma (PTC) with TFG::NTRK1 fusion (case 1) exhibits strong cytoplasmic and membranous staining, with the highest H-score in this study (251.8). B PTC with TPM3::NTRK1 fusion (case 5) displays membranous staining, with an H-score of 126.5. C PTC with ETV6::NTRK3 fusion (case 13) shows membranous staining, with an H-score of 74.6. D A fusion-negative PTC (Case 45) demonstrates cytoplasmic staining, with the lowest H-score in this study (25.6). E This panel illustrates staining heterogeneity observed in a representative immunohistochemically stained image. F Staining intensity in panel E is analyzed and categorized into four levels for H-score calculation: 0 (blue), 1 + (yellow), 2 + (orange), and 3 + (red), illustrating the distribution of pan-TRK staining
Gene Fusion AnalysisWe performed RNA-based targeted deep sequencing as previously described [22], using the in-house-validated ThyChase panel (ConnectaGen, Seoul, Korea), which covers 87 clinically relevant thyroid cancer-related fusions. These include 10 NTRK fusion types, such as NTRK1 with partner genes IRF2BP2, TFG, TPM3, TPR, SQSTM1, SSBP2, and NTRK3 with partner genes ETV6, RBPMS, SQSTM1, and EML4. The panel also includes 22 RET fusion types with partner genes CCDC6, ERC1, FKBP15, GOLGA5, HOOK3, KIAA1217, KTN1, NCOA4, PCM1, PRKAR1A, TRIM24, TRIM33, TRIM27, SPECC1L, TBL1XR1, AKAP13, DLG5, SQSTM1, CCDC186, AFAP1L2, PPFIBP2, and KIF5B. Other included fusion types are BRAF (with partner genes AKAP9, AGK, LMO7, BCL2L11, CCNY, FAM114A2, OSBPL1A, OSBPL9, MACF1, POR, SND1, MKRN1, ZC3HAV1, PICALM, NFYA, AP3B1), THADA (IGF2BP3, LOC389473, LOC100505678, TRA2A), ALK (STRN, EML4, GFPT1, GTF2IRD1, CCDC149), FGFR2 (WARS, KIAA1598, OFD1, VCL), PPARG (CREB3L2, PAX8), UACA (LTK), MET (TFG), SS18 (SLC5A11), RNF213 (SLC26A11), ROS1 (CCDC30), RAF1 (AGGF1), and EZR (ERBB4).
Briefly, cDNA was synthesized from 10 ng of RNA using the SuperScript IV VILO Master Mix (Thermo Fisher Scientific, Waltham, MA), and sequencing libraries were prepared with the Ion Plus Fragment Library Kit (Thermo Fisher Scientific). Sequencing was conducted on the Ion S5 system (Thermo Fisher Scientific). A fusion event was considered positive if at least 100 high-quality end-to-end reads spanning the fusion junction were identified.
Statistical AnalysisAssociations between clinicopathologic features and gene fusion status were assessed using the chi-square and Fisher’s exact tests, depending on sample size and expected frequency conditions. Continuous variables were analyzed with an independent t-test or Mann–Whitney U test, as appropriate. All statistical calculations were performed using SPSS software (version 19.0.0; IBM Corp., Armonk, NY). A p-value of less than 0.05 was considered to indicate statistical significance.
Comments (0)