2.1 Study Design and Population
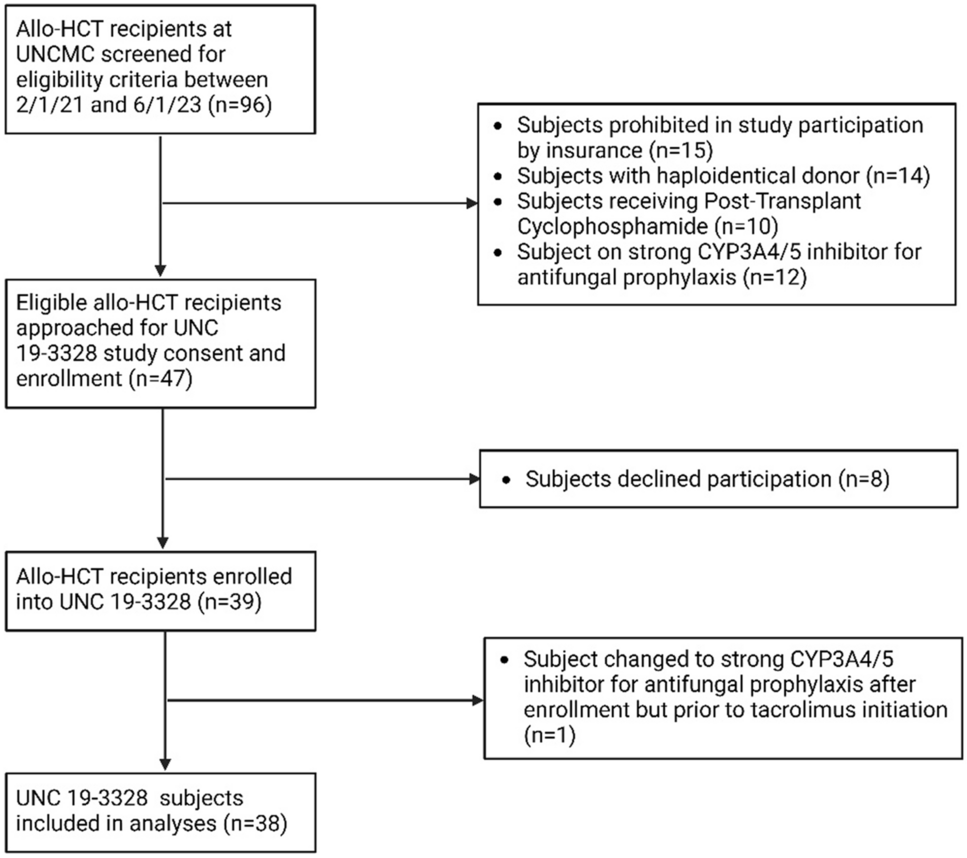
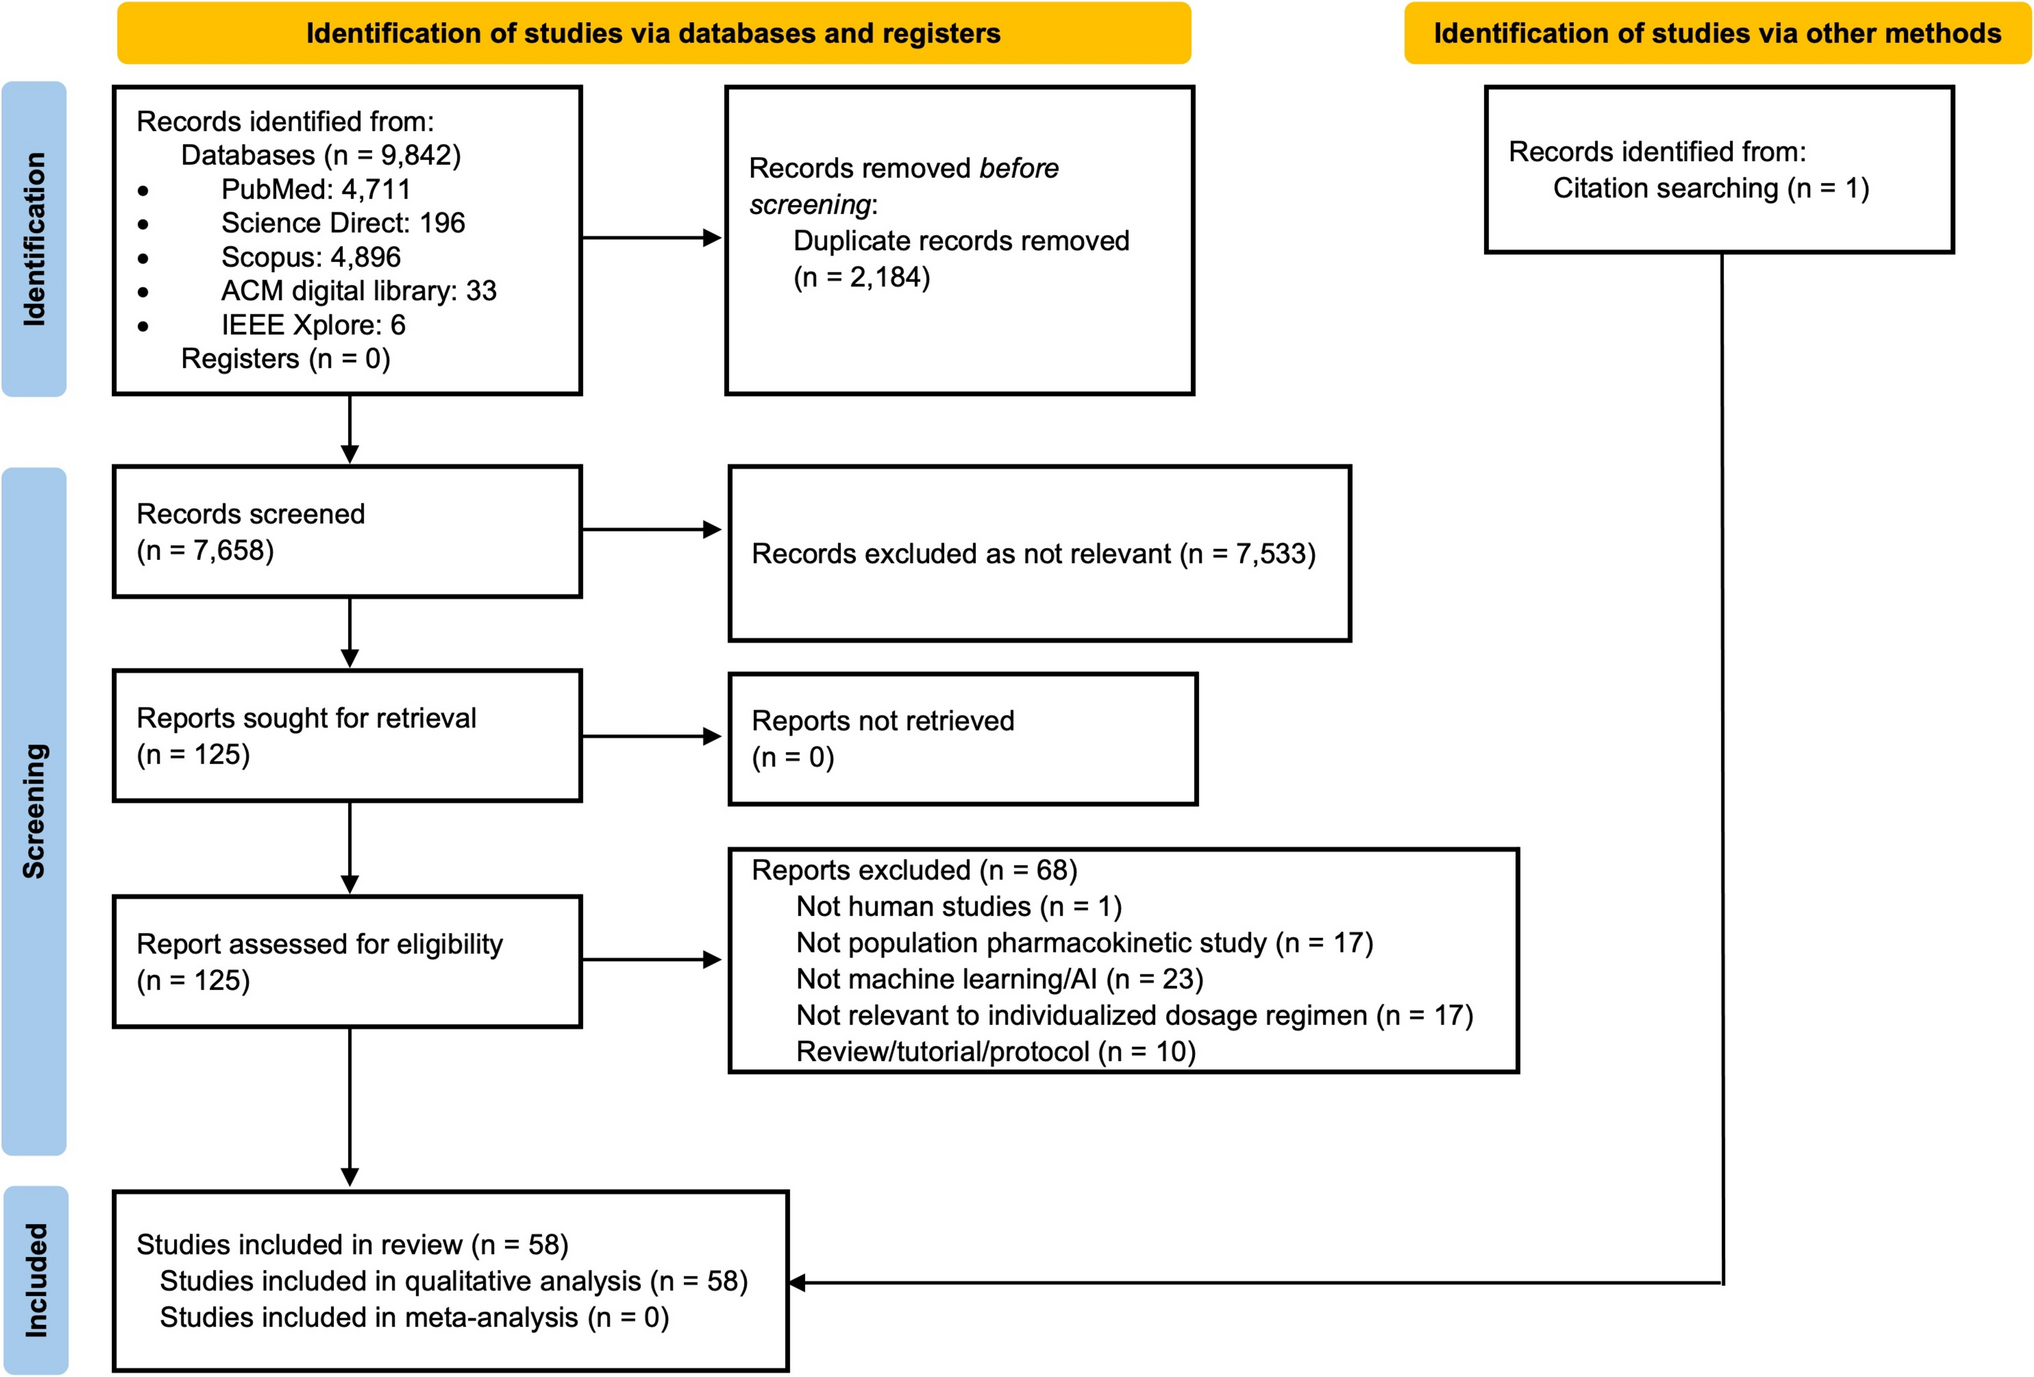
The characteristics of the studies included in the development of the popPK model, including balcinrenone dosing and sampling schedules, are presented in Supplementary Table S1. In total, data from the following clinical studies were used: three studies in healthy participants (NCT03843060, NCT03804645, and NCT04798222), one study in participants with renal impairment but without HF (NCT04469907 [14]), and two studies in participants with HF and CKD (NCT03682497 [13] and NCT04595370 [15]). All studies were conducted in accordance with ethical principles that had their origin in the Declaration of Helsinki and were consistent with International Council for Harmonisation Good Clinical Practice and the AstraZeneca policy on Bioethics and Human Biological Samples. All participants signed the informed consent before study initiation.
2.2 Bioanalytical Method
Plasma samples collected for balcinrenone analysis were assayed using liquid chromatographic-tandem mass spectrometric methods that were validated in accordance with current regulatory guidance. The lower limit of quantification (LLOQ) for the analytical method used to analyze the plasma samples was 2 nmol/L for the phase 2b study (NCT04595370) and 10 nmol/L in all other studies. Additional details for each study can be found in the Supplementary Materials.
2.3 Pharmacometric Model Development
In the first step of model development, data from single-dose and short-term studies (NCT03843060, NCT03682497, NCT04469907, NCT04798222, and NCT03804645) were used to develop an initial popPK model (i.e., to determine the structure of the model, including the absorption model) and to assess the impact of food state and dose on balcinrenone PK (two known extrinsic factors, observed in previous clinical studies). Data from the phase 2b study (in participants with HF and CKD [NCT04595370]) were not included in this initial assessment, since in this study mostly predose samples were collected and very limited postdose PK data were available, which could inform the absorption part of the popPK model. Once the initial model was developed, data from the phase 2b study were added and the model was refitted using the updated dataset. Interindividual variability and error structure were reevaluated.
The absorption model included zero-order infusion into the dosing compartment and sequential first-order absorption. Since food was previously observed to impact balcinrenone PK, different lengths of the zero-order infusion into the dosing compartment were assessed for food state (i.e., fasted and fed states) and estimated from the data. In addition, the impact of food on other PK parameters was explored, including relative bioavailability, absorption rate, volume of distribution, and intercompartmental clearance. To capture the observed differences in the fed versus fasted profiles (i.e., delayed time to Cmax [Tmax], higher AUC, and Cmax, as well as lower Ctrough for the fed state), various combinations of food-effect impact on PK parameters were assessed. During model development, discrimination between models was mainly based on the inspection of graphical diagnostics and changes in the objective function value (OFV) provided by NONMEM. An OFV difference of – 3.84 (larger model–smaller model), corresponding to a p-value of < 0.05 for 1 degree of freedom (DF) for nested models, was used for selecting more complicated models. Plausible parameter estimates that were not associated with excessively high relative standard errors (RSEs) were also taken into account when discriminating between selecting models. Once an adequate fit was achieved with single-dose and short-term studies, data from the phase 2b study (NCT04595370) were included and the initial model was refitted to the updated dataset (all parameters were reestimated, with the initial conditions based on the model fitted using short-term studies). As a next step, covariate impact was assessed using all available data via a stepwise covariate modeling (SCM) procedure.
Since approximately 17% of PK samples were below the limit of quantification (BLQ), the Beal methods M3 and M5 for PK models were explored for handling BLQ observations [18]. In the M3 method, all data (including BLQ observations) are used in the modeling, and for BLQ observations, the likelihood that these observations are indeed BLQ is estimated, while in the M5 method, all BLQ concentrations are set to half the LLOQ (1 nmol/L for the phase 2b study and 5 nmol/L in all other studies) and used for model development [18]. For the initial model development, the M5 method was used for handling BLQ; this was done owing to the longer runtimes and convergence issues when using the M3 method. Therefore, the M3 method—the method considered most optimal when it comes to reducing bias and improving the accuracy of parameter estimates [18]—was only evaluated for the final model.
2.4 Model Evaluation
Model evaluation followed the recommendations by Nguyen et al. [19], including inspection of goodness-of-fit (GOF) plots, RSEs, visual predictive checks (VPCs), and bootstrap. GOF plots included standard sets of observations (DVs) versus population predictions, DV versus individual predictions, conditional weighted residuals (CWRES) versus population predictions, CWRES versus time, and individual weighted residuals versus population predictions. The adequacy of the model was evaluated using simulation-based VPCs. A VPC plots the median as well as the percentiles of the observed data versus time together with the 90% confidence intervals (CIs) for the same percentiles from simulations of the final model. Prediction-corrected VPCs were used to assess performance of all doses simultaneously [20]. Parameter uncertainty was obtained using the covariance step in NONMEM. For bootstrap, 1000 datasets were generated via repeatedly sampling with replacements from the original dataset. Each of the datasets was fitted using the final popPK model, and all model parameters were calculated. The median and the 2.5–97.5% intervals of estimated parameters were calculated.
2.5 Covariate Assessment
The following covariates were assessed for their potential influence on apparent clearance (CL/F) and apparent central volume of distribution (Vc/F): body weight, eGFR (CKD-EPI formula [21]), sex (male/female), race (White, Black or African American, Asian, and Other/Unknown), ethnicity (Hispanic or Latino/Not Hispanic or Latino), comedication with dapagliflozin, and study type. Study type was defined as either single-dose phase 1 studies (including NCT03843060, NCT03804645, NCT04469907, and NCT04798222, with healthy participants and participants with renal impairment) or the multiple-dose phase 1b/2b studies in patients (studies NCT03682497 and NCT04595370, including only participants with HF and CKD). The covariates were on the basis of physiological plausibility, prior knowledge, and exploration of the data. Age was not included in the covariate assessment since it was found to be highly correlated with eGFR (correlation coefficient of – 0.72). Covariates were identified using an SCM procedure implemented within Perl Speaks NONMEM (PsN) software. Stepwise testing of linear and power relationships was performed in a forward inclusion (ΔOFV of 6.63, p < 0.01 for 1 DF) and backward exclusion (ΔOFV of 10.8, p < 0.001 for 1 DF) procedure. In case of categorical covariates, ΔOFV at the respective p-values may be different depending on the DF.
2.6 Model Simulation for Evaluating the Impact of Covariates
The final model was used to generate forest plots illustrating the impact of the identified covariate relationships and derive individual estimated PK metrics. The forest plots were constructed to demonstrate the impact of the selected covariates on the AUC at steady-state (AUCss) of balcinrenone, for the dosing interval (24 h). AUCss for the dosing interval was derived as AUCss = dose × F/CL; a dose of 50mg was used for the calculations.
Uncertainty was included on all fixed effect parameters. The reference participant (a patient with HF and CKD [corresponding to participants of phase 1b/2b studies NCT03682497 and NCT04595370] with an eGFR of 60 mL/min/1.73 m2 who received balcinrenone in a fasted state) was compared with a number of relevant covariate scenarios (such as high versus low renal function, and fed versus fasted state, etc.). Each covariate scenario was simulated 1000 times, with the demographics set to those for the reference participant, except for the covariate to be evaluated. The generated forest plots display the median and 90% CI.
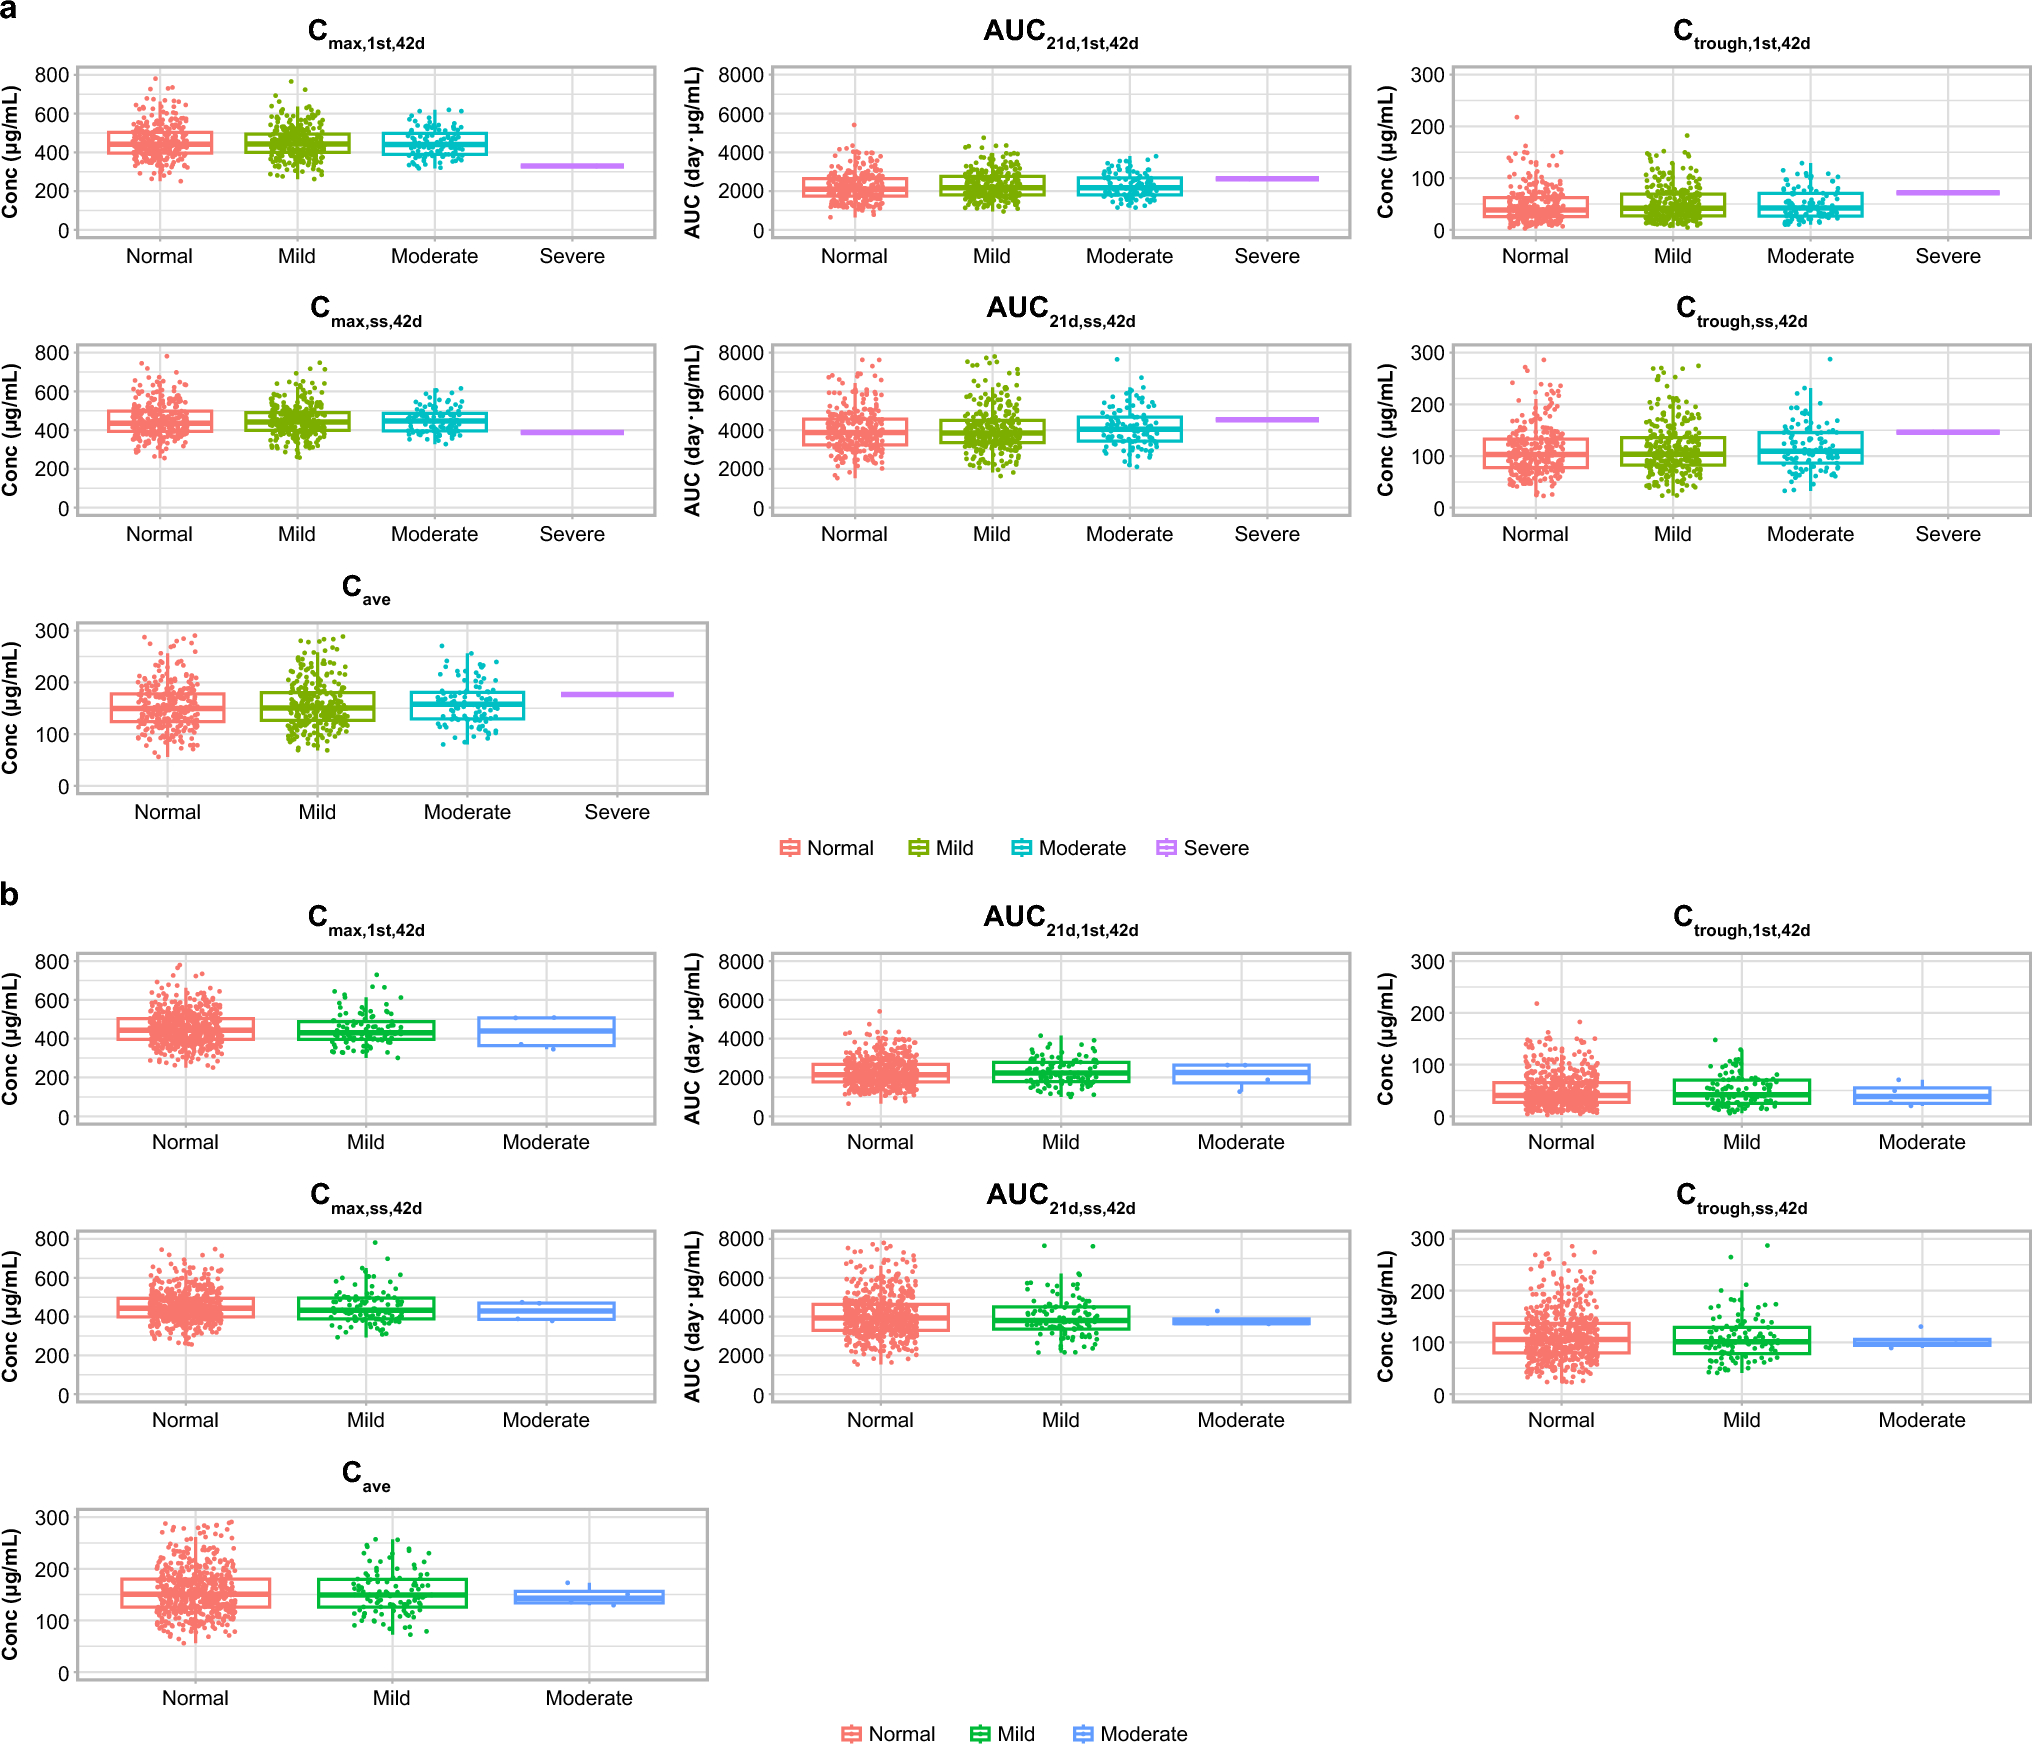
In addition to the forest plots, model-predicted balcinrenone AUCss for the dosing interval was calculated for all participants included in the analysis dataset. The individual CL/F was used to derive the individual AUCss for each participant (derived as AUCss = dose × F/CL). The dose was set to 50 mg for all individuals. These individual AUCss were summarized graphically, stratified by the intrinsic and extrinsic factors of interest.
2.7 Software Details
The software package NONMEM version 7.4 (Icon Development Solutions, Ellicott City, MD, USA, 2009) was used in this popPK analysis. PsN version 4.9 (https://uupharmacometrics.github.io/PsN/docs.html) and R version 4.1.1 (R-project, www.r-project.org) were used for graphical exploratory analysis, executing NONMEM runs, and postprocessing of NONMEM output, e.g., to assess GOF and simulations. The importance sampling method was used for estimation.

Comments (0)