
Remember me
Objective. sleep staging is essential for diagnosing sleep disorders and managing sleep health. Traditional methods require time-consuming manual scoring. Recent photoplethysmography (PPG)-based deep learning models perform well on local datasets but struggle with external generalization due to data drift. Approach. this study evaluates multi-source domain training for improving out-of-distribution generalization in four-class sleep staging (wake, light, deep, rapid eye movement) from raw PPG time-series. The trained deep learning model is denoted SleepPPG-Net2. Additionally, we examined the impact of demographic factors, ethnicity, and obstructive sleep apnea (OSA) on performance. SleepPPG-Net2 was benchmarked against two state-of-the-art models. Main results. SleepPPG-Net2 outperformed benchmark models, improving generalization performance (Cohen’s kappa) by up to 21%. Performance disparities were observed in relation to age, sex, and OSA severity. Significance. SleepPPG-Net2 enhances PPG-based sleep staging and provides insights into demographic and clinical influences on model performance.
Export citation and abstractBibTeXRIS
Sleep plays a critical role in health and well-being (Eugene and Masiak 2015). During sleep, the brain engages in complex activities characterized by dynamic and cyclic patterns (Hobson et al 1986, Hobson 2005). Clinicians have systematically classified sleep neural patterns into distinct stages (wake, light, deep, rapid eye movement (REM)) (Anthony and Allan 1968), facilitating the evaluation and analysis of sleep and enabling the detection of sleep disorders. Physiological signals used to stage sleep include the electroencephalogram, electrooculogram, and electromyogram (Dement and Kleitman 1957) and are scored manually or semi manually according to specific rules of the American Academy of Sleep Medicine (AASM) (Berry et al 2017). These, together with respiratory signals, electrocardiogram (ECG) and video, are conventionally recorded during polysomnography (PSG), the gold standard sleep analysis tool, which is conducted in a clinical setting (Deak and Epstein 2009).
Photoplethysmography (PPG)-based sleep staging is becoming a popular alternative to in-lab PSG. PPG is a noninvasive method that detects volumetric changes in the microvascular tissue bed and serves as an important sensing technology incorporated into contemporary wearable devices, including smartwatches and fitness trackers (Charlton et al 2023).
A considerable amount of research has focused on improving sleep staging accuracy using the PPG signal. Early studies analyzed heartbeat dynamics, examining the magnitude and sign of increments in time intervals between successive heartbeats (Kantelhardt et al 2002), scale-invariant features (Ivanov 2007), and fractal and nonlinear measures (Schmitt et al 2009). PPG-based sleep staging has evolved from methods using rhythm and morphological features, followed by thresholding or machine learning-based classification, and has given rise to a wide variety of deep learning-based algorithms (Walch et al 2019, Korkalainen et al 2020, Sridhar et al 2020, Huttunen et al 2021, Li et al 2021, Radha et al 2021, Zhao and Sun 2021, Habib et al 2023, Kotzen et al 2023). These algorithms can be broadly categorized by their use of beat-to-beat intervals (Sridhar et al 2020, Li et al 2021, Zhao and Sun 2021) versus raw PPG data (Walch et al 2019, Korkalainen et al 2020, Huttunen et al 2021, Radha et al 2021, Habib et al 2023, Kotzen et al 2023) as input to the neural network algorithm.
These algorithms are typically assessed against the gold-standard manual sleep staging, with Cohen’s kappa employed to gauge inter-rater reliability. The majority of research report kappa performance on a local test set within the range of 0.62–0.77 (Huttunen et al 2021, Radha et al 2021, Wulterkens et al 2021, Zhao and Sun 2021, Habib et al 2023). Habib et al (2023) reported a kappa value of k = 0.77 for a four-class classification task; however, the study was limited by a small dataset size (n = 10) and employed a leave-one-subject-out cross-validation technique. A study conducted by Zhao and Sun (2021) obtained k = 0.69 on the cyclic alternating pattern (CAP) sleep dataset (Goldberger et al 2000, Terzano 2001), utilizing a leave-one-subject-out cross-validation method. Of note, data of only 27 out of 69 subjects was used. Few studies (Walch et al 2019, Kotzen et al 2023) have evaluated the generalization performance of their algorithms on target domains. Walch et al (2019) evaluated an algorithm on the unseen multi-ethnic study of atherosclerosis (MESA) dataset but only on a limited portion of the available data, specifically 188 of the 2052 subjects used in this study. In our previous work, we developed SleepPPG-Net (Kotzen et al 2023), a deep learning model which takes the raw PPG data as input. SleepPPG-Net demonstrated state-of-the-art performance on the local test set (Charlton et al 2023) but performance was reduced when evaluated on an independent external test set.
The challenge of generalization performance in physiological time-series analysis is particularly daunting due to the inherent complexity and high variability of human physiology. Although high performance has been reported for deep learning models processing physiological signals (Phan et al 2019, Ribeiro et al 2020, Levy et al 2023), the models tend to generalize poorly or moderately on external datasets (Kotzen et al 2023, Levy et al 2023, Ballas and Diou 2024). This discrepancy is not just a technical issue but a significant barrier in translational research, where the ultimate goal is to apply these algorithms in clinical practice. Therefore, there is a pressing need for the development of generalizable models that not only perform well with initial datasets, but also ensure efficacy when deployed in a variety of health settings and population samples (Behar et al 2023).
This research seeks to expand the applicability of SleepPPG-Net (Kotzen et al 2023) by improving its generalization performance. In particular, by incorporating a multisource-domain training approach, we enhance the representation of the deep learning model by including a diverse population sample encompassing a broad spectrum of demographic and physiological characteristics resulting in the SleepPPG-Net2 model. The intuition is that when training a model on a single dataset, it may overfit its specific domain distribution, while leveraging multiple datasets may enable learning of a more common representation and avoid learning shortcut features, thereby avoiding overfitting. Five independent datasets, comprising a total of 2574 individuals, were used to conduct the experiments. SleepPPG-Net2 was trained using a leave-one-domain-out approach, where the model was trained on four of the five datasets and its out-of-distribution generalization performance was evaluated on the fifth, left-out domain. This research makes the following key contributions:
To evaluate the value of multi-source domain training on out-of-distribution generalization performance for the task of sleep staging from PPG.To investigate the effect of demographic, ethnicity and obstructive sleep apnea (OSA) on the performance.The generalization performance was assessed in accordance with Level one described in Behar et al (2023), i.e. limiting the effects of data drift or shortcut features by external validation on multiple retrospective datasets.
The paper is structured as follows: section 1 provided an introduction to the field of sleep staging from PPG. Section 2 describes the datasets used for the experiments. Section 3 presents the SleepPPG-Net2 training strategy used to develop a generalizable representation of the raw PPG data for sleep-staging. Section 4 presents the results obtained in terms of performance statistics and classical sleep measures.
The MESA (Chen et al 2015, Zhang et al 2018), cleveland family study (CFS) (Redline et al 1995, Chen et al 2015), apnea, bariatric surgery, and continuous positive airway pressure (CPAP) (ABC) (Chen et al 2015, Bakker et al 2018) and home positive airway pressure (HomePAP) (Rosen et al 2012, Chen et al 2015) datasets were obtained via the open National Sleep Research Resource (NSRR, sleepdata.org) while the open access The CAP sleep dataset (Goldberger et al 2000, Terzano 2001) was available via PhysioNet (physionet.org). Usage of these open access datasets for our research was approved by the Institutional Review Board of the Technion-IIT Rappaport Faculty of Medicine (62-2019). We used the raw PPG signal with metadata and the sleep staging scoring of PSG as a reference. Table I presents summary statistics for the five datasets used. PSG recordings with missing PPG data or technical errors and of individuals under 18 years of age were excluded.
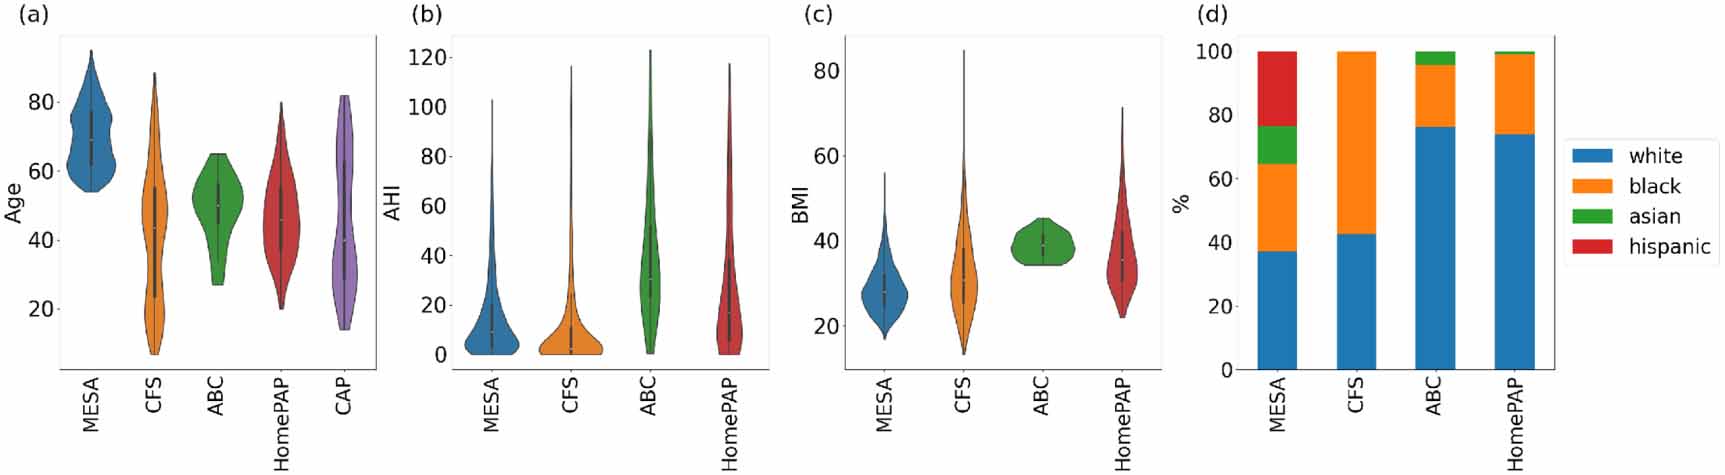
2.1. Datasets2.1.1. MESAThe MESA dataset (Chen et al 2015, Zhang et al 2018) consists of in-home PSG conducted with the Compumedics Somte System (Compumedics Ltd Abbotsford, Australia). The PSG data were collected from 2056 participants in four US communities. Overnight recordings were sent to the Brigham and Women’s Hospital centralized reading center, where trained technicians scored the data according to the AASM rules (Berry et al 2017). The PPG signal was captured using a Nonin 8000 sensor at a frequency of 256 Hz (table 1). Two patients were excluded due to missing data. The dataset represents a generally older age range compared to CFS, ABC, HomePAP and CAP datasets (figure 1), but a diversity of ethnicities including white, black/African American, Asian, and Hispanic (table 1). The MESA dataset is divided into two parts: MESA-train, which comprises 90% of the dataset and MESA-test, which includes the remaining 10% of the dataset. This train-test split was carried out while stratifying per patient and age as described by Kotzen et al (2023).
Figure 1. Data distribution presented in violin plots for (a) age, (b) apnea hypopnea index (AHI) and (c) body mass index (BMI) and bar plot for (d) ethnicity. The AHI, BMI and ethnicity variables were not available for the CAP dataset.
Download figure:
Standard image High-resolution imageTable 1. Datasets characteristics used for the experiments. Number: number of individual each with polysomnography test (PSG). The columns for Mild, Moderate, and Severe indicate the percentages of individuals with obstructive sleep apnea (OSA) in the ranges 5 ≤ AHI  15, 15 ≤ AHI
  30, and AHI ≥ 30, respectively. fs: PPG sampling frequency. Test: Type 1 is an in-lab PSG and Type 2 is a PSG performed at home without a sleep technician. The oximeter brand used in MESA, CFS, and ABC datasets was Nonin and unknown for HomePAP and CAP. MEAN and STD is reported for age, body mass index (BMI), apnea-hypopnea index (AHI).
 46.5
46.5 291714
 256Type 12000–2002CFS (Redline et al 1995)259USA
 40.0
40.0 19910
19910 128Type 22001–2006ABC (Bakker et al 2018)49USA
 55.3
55.3 123551
 256Type 12011–2014HomePAP (Rosen et al 2012)118USA
 54.2
54.2 182131
 25-256Type 12008–2010CAP (Terzano 2001)69Italy
 63.0—————128Type 120012.1.2. CFS
The CFS (Redline et al 1995, Chen et al 2015) includes individuals from 361 families in various communities, observed up to four times over 16 years. For this research, we had access to 320 PSG recordings from the fifth visit. We selected only adult participants (aged over 18 years), which excluded 61 young patients, resulting in 259 PSG. This visit included an overnight, in-lab 14-channel PSG using the Compumedics E-Series System (Abbotsford, Australia). The night recordings were sent to the centralized reading center at Brigham and Women’s Hospital, and data were scored by trained technicians who used Rechtshaffen and Kales (R&K) (Anthony and Allan 1968) criteria for sleep staging and AASM rules for arousals (Berry et al 2017). The PPG signal was recorded using a Nonin 8000 sensor at a frequency of 128 Hz (table 1). The CFS dataset is unique in that it includes participants in a younger age range (figure 1).
2.1.3. ABCThe ABC (Chen et al 2015, Bakker et al 2018) dataset consists of in-lab PSG records collected using the Compumedics E-Series (Abbotsford, Victoria Australia). The primary objective of this dataset was to compare the efficacy of bariatric surgery versus CPAP therapy combined with weight loss counseling for treatment of 49 patients with class II obesity and severe OSA. The PSG data including sleep stages and events were manually scored according to AASM guidelines (Berry et al 2017). This dataset includes the same patients who had three full PSG assessments during the study period. For our purposes, we only used the baseline overnight in-lab PSG data. The PPG signal was recorded using a Nonin 8000 sensor at a frequency of 256 Hz (table 1). The ABC dataset typically showed higher apnea hypopnea index (AHI) and body mass index (BMI) compared to MESA, CFS and HomePAP datasets (1).
2.1.4. HomePAPThe HomePAP (Rosen et al 2012, Chen et al 2015) study was a multisite, non-blinded, randomized controlled trial performed in seven AASM-accredited academic sleep centers. It involved 373 patients selected due to their high probability of having moderate to severe OSA, determined by a clinical algorithm. In our study, we focused exclusively on the full in-lab PSG which amounted to 121 PSG recordings. However, 3 recordings had to be excluded due to the absence of the PPG signal, leaving us with 118 PSG recordings. Since the study was conducted across seven different clinical field sites, the oximeter and recording frequency varied for each patient (between 25 and 256 Hz (table 1). The data scoring was centralized and conducted manually.
2.1.5. CAPThe CAP dataset (Goldberger et al 2000, Terzano 2001) is a collection of 108 PSG recordings of CAP patients contributed by the Sleep Disorders Center of the Ospedale Maggiore of Parma, Italy. The PPG signal was recorded with a sampling frequency of 128 Hz (table 1). CAP, is a feature/component of non-REM (NREM) microstructure that has been shown to signify sleep instability and sleep disturbances (Terzano 2001, Parrino et al 2012). CAP, while a physiological occurrence, is also an indicator of sleep instability and is associated with various sleep-related disorders such as sleep-disordered breathing (Terzano et al 1996), insomnia (Parrino et al 2009), sleep movement disorders (Parrino et al 1996, Hening 2004) (such as periodic leg movements and restless leg syndrome), parasomnias (Kutlu et al 2013)(including REM behavior disorder (RBD)) and neurological conditions (Terzano et al 2006, Parrino et al 2012) (such as nocturnal frontal lobe epilepsy and narcolepsy). A total of 39 patients had missing channels resulting in 69 patients remaining for this dataset. The PSG records were manually scored using the R&K (Anthony and Allan 1968) criteria.
2.2. Labels harmonizationThe AASM guideline (Berry et al 2017) was used as reference for sleep staging definition. These guidelines categorize sleep stages into wake, REM and three NREM stages, namely N1, N2, and N3. In this study, we used a 4-class sleep staging system that includes wake, light sleep (N1/N2), deep sleep (N3) and REM. It is important to note that in the older Rechtschaffen and Kales (R&K) (Anthony and Allan 1968) guidelines, used by CFS, CAP, an additional NREM stage, S4 was included. In aligning the R&K stages with our 4-class system, we included S4 as part of the deep sleep class. Therefore, our mapping consists of wake, light sleep (S1/S2), deep sleep (S3/S4), and REM. The distribution of sleep stage proportions across datasets have been reported in table SI.
3.1. Benchmarks3.1.1. benchmark derived time series (BM-DTS) modelSridhar et al (2020) developed a deep learning model that takes as input the instantaneous pulse rate (IPR), i.e. a time series derived from the interbeat intervals computed from ECGs. The BM-DTS model architecture is based on this original work by Sridhar et al (2020), with some minor modifications, as described in detail by Kotzen et al (2023). The BM-DTS model architecture takes as input the extracted continuous IPR time-series and is composed of three time-distributed residual convolutions and a time-distributed deep neural network. The DTS method hinges on the precise identification of PPG peaks. For this purpose, we used the validated pyPPG (Goda et al 2023) PPG peak detector. BM-DTS was trained on MESA-train and results are provided for MESA-test and all target domains.
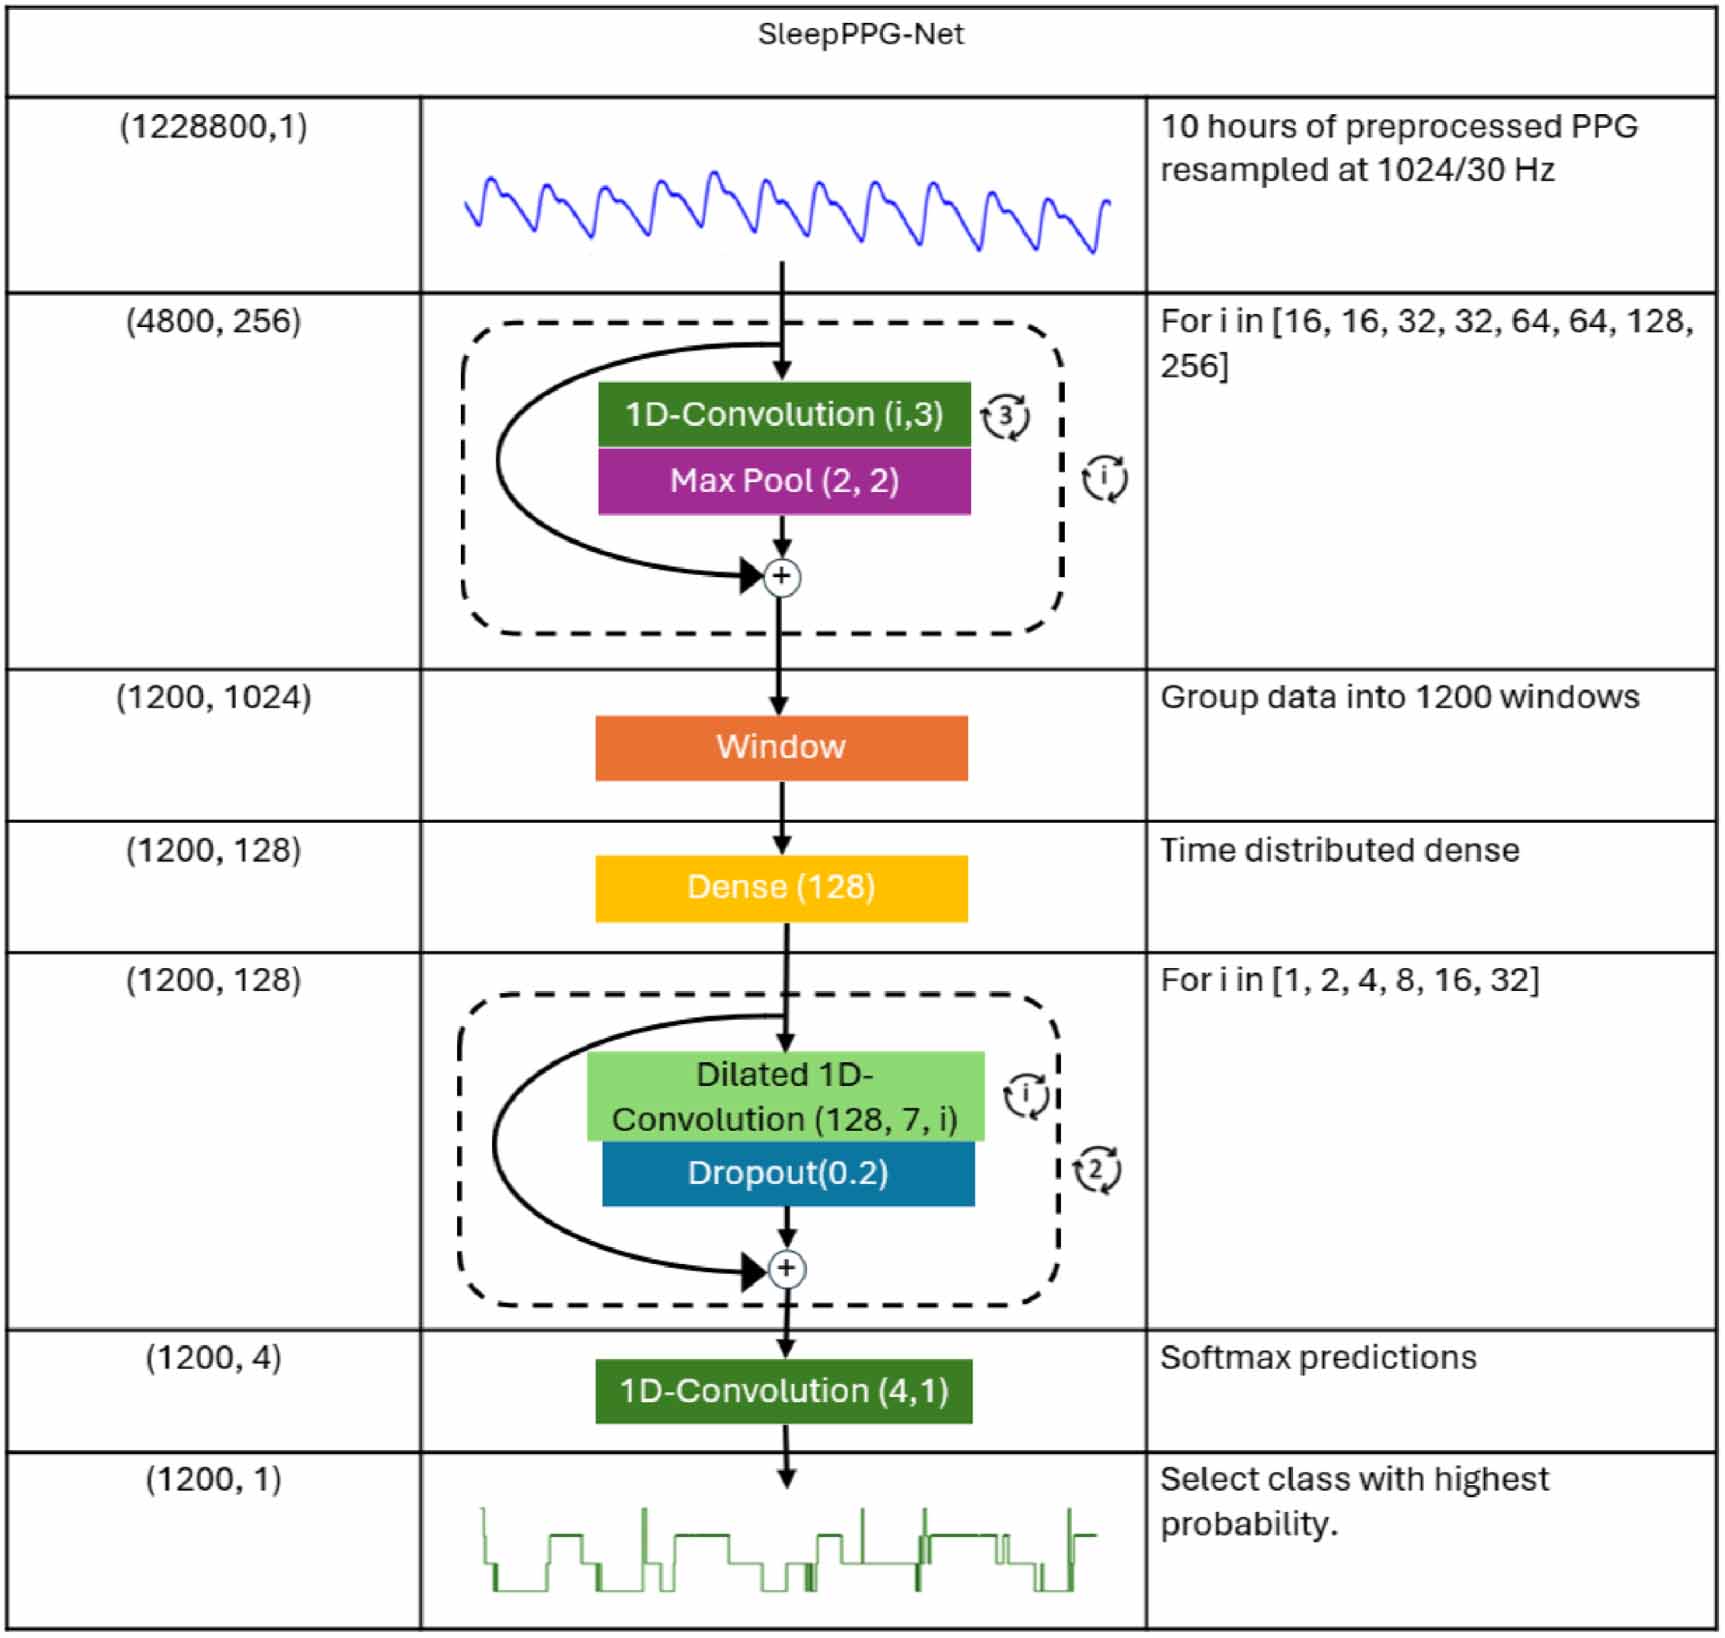
3.1.2. SleepPPG-NetThe following preprocessing treatment was performed on the raw PPG data as originally described by Kotzen et al (2023). A low-pass filter was used to eliminate high-frequency noise and prevent aliasing during the downsampling process. This filter was a zero phase 8th order low-pass Chebyshev Type II filter, with an 8 Hz cutoff frequency and a 40 dB stopband attenuation. The filtered PPG signal was downsampled using linear interpolation at a frequency of 34.13 Hz. The PPG was then clipped within three standard deviations of the mean, and the data was standardized. The SleepPPG-Net architecture (Kotzen et al 2023) consists of a residual convolutional neural network for automatic feature extraction and a temporal convolutional neural network to capture long-range contextual information (figure 2). In this work, SleepPPG-Net was pre-trained using the ECG SHHS (Quan et al 1997, Chen et al 2015) data set of 125 Hz downsampled to 34.13 Hz and then trained on the PPG of the MESA-train dataset (source domain) due to its large size. The performance of SleepPPG-Net is then reported for MESA-test as well as for all target domains. Model training was performed on a single GPU A100 (80Gb) using TensorFlow framework 2.8 and following an hyperparameter tuning procedure using Bayesian search over 100 iterations.
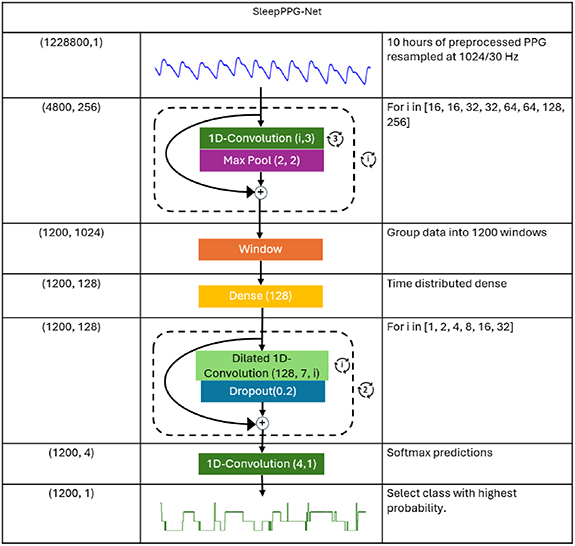
Figure 2. SleepPPG-Net architecture and parameters. © 2023 IEEE. Reprinted, with permission, from Kotzen et al (2023).
Download figure:
Standard image High-resolution image 3.2. SleepPPG-Net2In order to develop a generalizable deep learning model, the model used the same pretrained model that was trained on the ECG SHHS dataset (Quan et al 1997, Chen et al 2015), as used in SleepPPG-Net. Hyperparameters have been reported in table SII. It was then fine-tuned on a joint set of multiple-source datasets (four out of five), while evaluating generalization performance on the single left-out target domain. Since training high-performing deep learning models requires a large number of recordings, we included MESA-train, which comprises 90% of the MESA dataset, in all experiments. Consequently, we report out-of-distribution performance for CFS, ABD, HomePAP, and CAP, which serve as target domains, while MESA is treated as a source domain, with local test set performance on MESA-test (10% of MESA) reported accordingly.
3.3. Performance assessment3.3.1. Performance statisticsThe models output a probability prediction for each of the four sleep stages for each 30 s sleep window. The probabilities were converted into predictions by selecting the class with the highest probability. All padded regions were removed before calculating performance measures. Performance was evaluated using Cohen’s kappa  per patient and overall accuracy Acc and Cohen’s kappa
  . The final scores reported are the median
  , the overall
  (table 2), the overall Acc (table SIII) and the
  -score
  , precision P and recall R (table SIV) for four-class staging. For three- and two-class staging, the same metrics have been reported in tables SV–SX. The performance measures are also reported over the overall confusion matrix representing the prediction summary of the 30 s windows of a given test dataset (figure 4). Finally, the performance measures were computed for the following tasks: four-class (wake, light, deep, REM), three-class (wake, REM, NREM) and two-class (wake, sleep) classifications. The significance of the results was calculated using a Wilcoxon signed rank test with a p-value significance threshold set to 0.05. Table 2 summarizes the performance across individual datasets, whereas figures 6 and SI depict the performance stratified by OSA severity and by the presence of distinct sleep disorders, respectively.
Table 2. Performance for four-class classification, Median kappa ( ), and overall kappa (
 ). MESA is the source domain and the other datasets are target domains. The 95% confidence intervals for the median kappa (
 ) and overall kappa (
 ) were estimated using bootstrapping with 80% resampling over 1000 iterations.


 DTS0.65 (0.64,0.66)0.64 (0.63,0.65)0.63 (0.62,0.64)0.61 (0.60,0.62)0.60 (0.56,0.60)0.59 (0.58,0.61)0.52 (0.50,0.54)0.49 (0.47,0.51)0.35 (0.34,0.36)0.39 (0.37,0.41)SleepPPG-Net0.74 (0.73,0.75)0.74 (0.73,0.74)0.72 (0.72,0.73)0.71 (0.71,0.72)0.67 (0.65,0.69)0.66 (0.65,0.68)0.63 (0.62,0.65)0.64 (0.63,0.65)0.48 (0.45,0.51)0.49 (0.46,0.52)SleepPPG-Net20.75 (0.74,0.75)0.74 (0.73,0.75)0.75 (0.74,0.75)0.73 (0.73,0.74)0.70 (0.68,0.71)0.69 (0.67,0.70)0.69 (0.67,0.70)0.67 (0.66,0.69)0.58 (0.54,0.58)0.53 (0.50,0.56)3.3.2. Sleep measures
In order to provide a better understanding of how these performances translate to support of downstream diagnosis tasks, the following sleep measures were evaluated: total sleep time (TST), sleep efficiency (SE), and fractions of various sleep stages (FRLight, FRDeep, FRREM). The TST measure is instrumental in revealing the model’s ability to accurately track sleep duration. The SE measure helps in understanding how well the patient slept and plays a role in monitoring sleep quality (Visser et al 2015). The fraction stages are important to visualize whether the patient cycled through all stages during the night and at a sufficient percentage. A deficiency in a specific fraction stage suggests the possible presence of a sleep disorder (Howell 2023). Calculating these measures and comparing them to the ground truth enhance our understanding of the clinical usability of the model. We report the mean absolute error (MAE) between the estimated and reference sleep measures for the SleepPPG-Net2 model over the grouped test sets. Sleep measures are defined as:



where, assuming n windows in a recording, the variables Wake, Light, Deep, and REM are binary arrays  , encoding the presence or absence of respective sleep stages. The variable Stage
  refers to the binary array representing the stage for which we are computing the sleep fraction. Stage
![$[i]$](https://content.cld.iop.org/journals/0967-3334/46/12/125001/revision2/pmeaae1a34ieqn24.gif) represents the binary value in the ith window of the Stage array, encoding whether the window is annotated as Stage or not. Scatter plots (figure 5) have been included as means of performance visualization.
represents the binary value in the ith window of the Stage array, encoding whether the window is annotated as Stage or not. Scatter plots (figure 5) have been included as means of performance visualization.
Multivariate linear mixed-effects models were used to evaluate the effects of patient age, sex, AHI, BMI, ethnicity, as well as their interactions on the per-patient kappa performance measure. This analysis was performed on the MESA, CFS, ABC and HomePAP datasets since they had all the relevant metadata. The resulting standardiz
Comments (0)