
Remember me


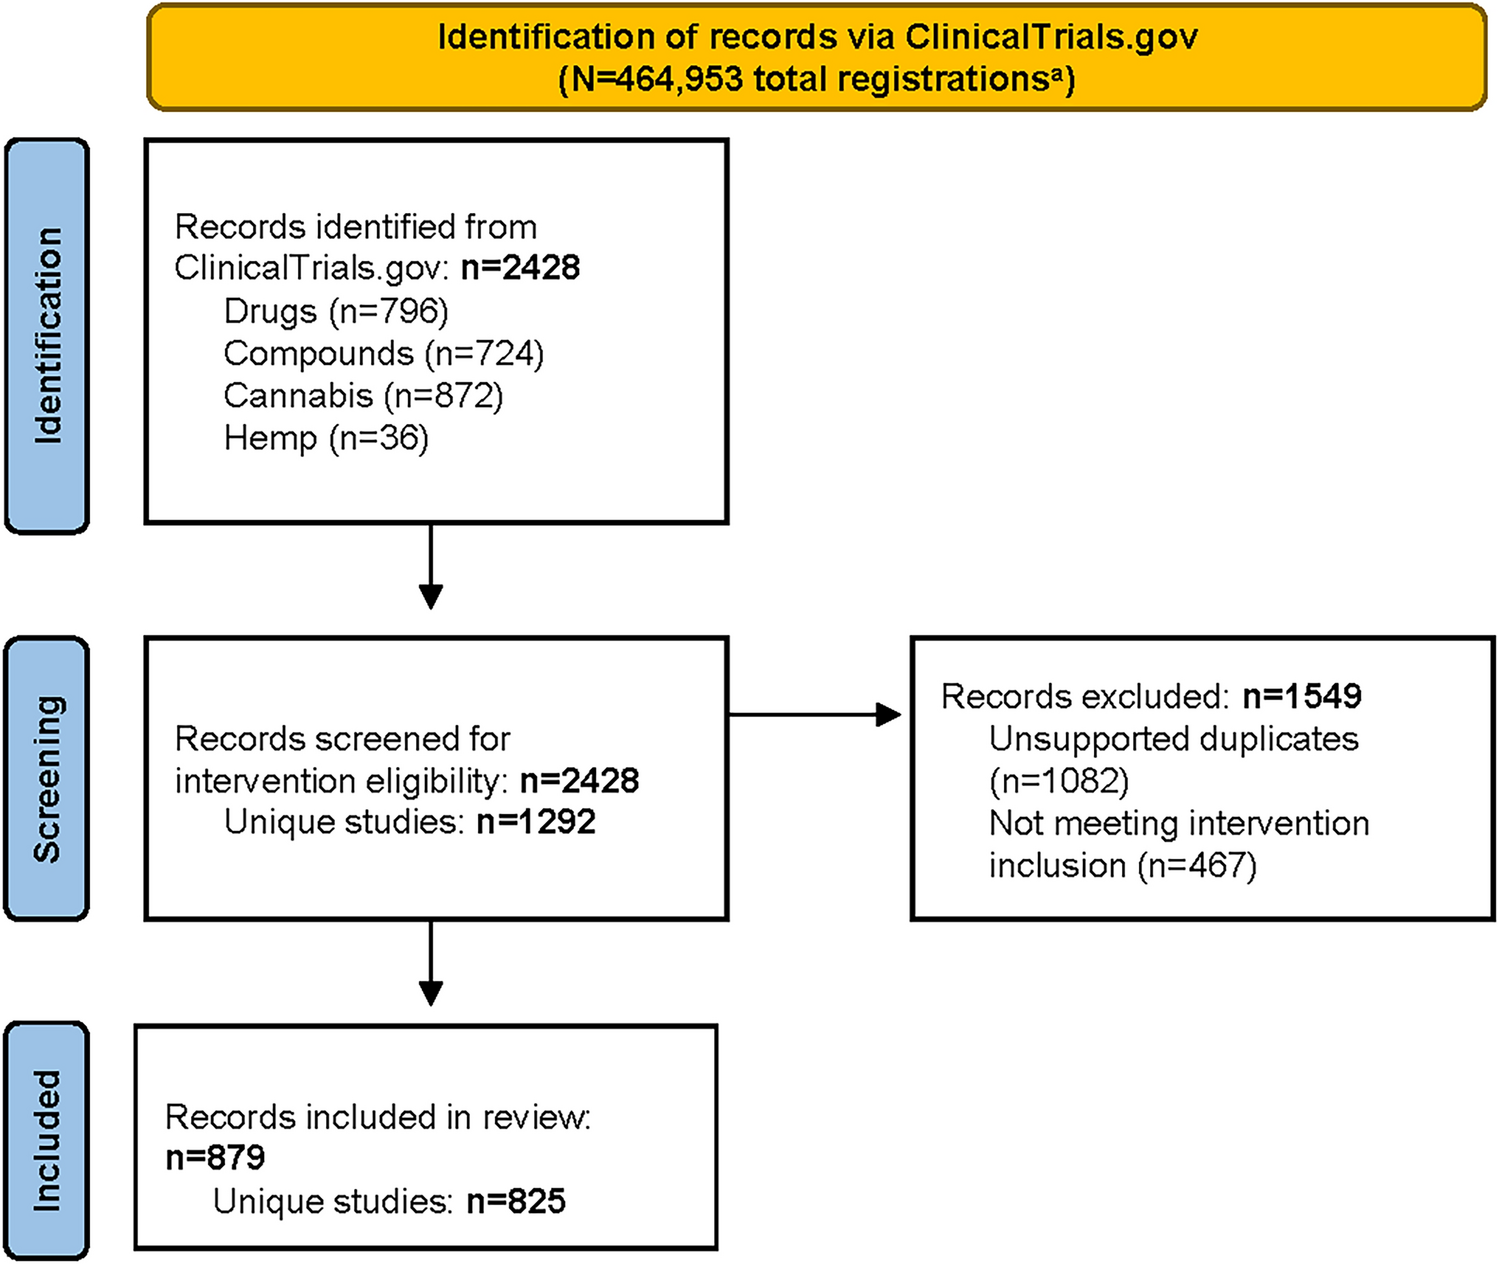
Of 2428 records identified from ClinicalTrials.gov, 1549 were excluded (1082 were duplicates appearing in multiple searches but without multiple applicable interventions, and 467 did not investigate a cannabinoid-based intervention or assess for drug development purposes). Thus, 879 study records that used a cannabinoid-based intervention—including duplicates that had multiple applicable interventions—were included in this analysis. Of these, 825 studies were unique (i.e., did not include duplicates; Fig. 1). Data are presented for unique studies in all analyses except by intervention, for which data are presented for study records, including duplicates.
Fig. 1
PRISMA flow chart for study selection. aTotal studies as of September 1, 2023, from ClinicalTrials.gov Trends and Charts on Registered Studies page [35]. PRISMA Preferred Reporting Items for Systematic Reviews and Meta-Analyses
Study sponsors from the USA, Canada, Israel, Germany, and Australia contributed to 724 (88%) of the 825 total studies, and the USA had the highest contribution by far with 531 studies (64%). In comparison with the overall ClinicalTrials.gov database (N = 550,005), unique studies (n = 825) were more likely to be interventional (90.4% [n = 746] vs 76.4% [n = 420,224]) or expanded access program (EAP) studies (0.8% [n = 7] vs < 0.2% [n = 1005]), and less likely to be observational (8.7% [n = 72] vs 23.2% [n = 127,847]) [31]. Characteristics of studies investigating cannabinoids are summarized in Table 1. Phase 1–3 studies comprised more than half of all unique studies. When stratified by intervention category, drugs were studied proportionally more often in the phase 3 and 4 study records, whereas cannabis skewed toward phase 1 and 1/2. Studies were typically randomized, phase 2, and registered with a sample size of < 50 participants. Drugs were studied proportionally more in interventional studies, whereas cannabis skewed more toward observational studies. Among interventional studies, similar proportions of studies were randomized and nonrandomized. Search counts by individual product and category are shown in Table 2. The majority of phase 3 and 4 trials had MeSH categories of pathological conditions, nervous system diseases, psychiatric disorders, and musculoskeletal diseases (Fig. S2). Psychiatric disorders and substance use disorders were investigated in a greater proportion of phase 1 studies compared with other conditions.
Table 1 Summary of characteristics of studies investigating cannabinoid-based productsaTable 2 Search counts by individual product and category3.2 Conditions/Disease in Registered StudiesOverall, there were 1756 records associated with the 18 MeSH headings assigned to the 825 unique studies (Table S1). The top 5 most common MeSH categories were psychiatric disorders (e.g., schizophrenia, anxiety disorder, traumatic stress disorders; n = 170 [20.6%]), pathological conditions—signs and symptoms (e.g., pain, neuropathies, nausea; n = 153 [18.5%]), nervous system diseases (e.g., epilepsy, multiple sclerosis; n = 127 [15.4%]), substance use disorders (e.g., opioid-related disorders, alcohol use disorder; n = 97 [11.7%]), and healthy (e.g., pharmacokinetics; n = 77 [9.3%]). When only a single condition was included in a study, the most common MeSH categories were pain (n = 147 [27.3%]), substance-related disorders (n = 68 [12.6%]), and epilepsy (n = 60 [11.1%]) (Table S2).
When stratified by intervention category, studies investigating compounds, cannabis, and hemp were more often associated with MeSH categories of psychiatric disorders (275 of 362 studies [76%]), substance use disorders (165 of 205 studies [80%]), and healthy (129 of 163 studies [79%]), whereas studies investigating drugs were more commonly associated with neoplasms (26 of 40 studies [65%]) and immune system disorders (31 of 59 studies [53%]) (Figs 2A, B).
Fig. 2
MeSH categories for A all study records by intervention categorya (n = 1756)b and B top 90% (n = 1604) of MeSH terms by proportion of intervention category. aCategories include drugs (approved drugs from plant-based or synthetic phytocannabinoids); compounds (extracts with defined phytocannabinoid content or unapproved drug products); hemp (products that self-define as hemp oil, hemp derived, or “broad spectrum” with no defined cannabinoid content); and cannabis (all whole cannabis plant products regardless of administration). bMost studies have >1 assigned MeSH category due to the interconnected nature of MeSH terms. MeSH Medical Subject Heading
3.3 Study Participant EnrollmentFor participant enrollment analyses, nine studies were excluded, owing to lack of data or recording of an extreme outlier value, resulting in the inclusion of 816 unique studies. The mean and median enrollment for all unique studies (n = 816) was 104 and 41 participants (interquartile range [IQR] 1–81), respectively. Median enrollment for interventional studies (which does not include observational and EAP studies [n = 746]; see Table 1) was 40 participants (IQR 18–95). Our analysis shows a lower median enrollment in comparison with the median enrollment of approximately 60 participants in ClinicalTrials.gov overall [28, 32,33,34]. When stratified by phase, median enrollment was 52 participants (IQR 30–100) for phase 2–3 trials, 120 participants (IQR 36–288) for phase 3 trials, and 70 participants (IQR 23–179) for phase 3–4 trials (Fig. 3A). These enrollments are lower than the overall ClinicalTrials.gov median enrollment of 119 participants (IQR 50–315) reported for phase 3–4 trials in a large review [34]. However, other overall ClinicalTrials.gov reported values vary widely, such as a phase 3 median enrollment of 252 participants (IQR 99–550) in a 2018 study [33].
Fig. 3
Participant enrollment in ClinicalTrials.gov cannabinoid-based intervention studies by A study phase and B intervention type. The central line in the IQR box marks the median; quartile range × 1.5 is indicated by whisker lines; the dots outside are outliers; the mean is denoted by X. aEight studies did not provide enrollment data and were excluded; one study was excluded due to extremely high enrollment (NCT03944447). Studies with multiple interventions are included in the relevant category for each intervention; duplicate records of single studies are included (total records = 879). Removing studies with phases reported as “Not Applicable” excluded 161 studies from the 825 unique studies. bCategories were defined as: drugs (approved drugs from plant-based or synthetic phytocannabinoids), compounds (extracts with defined phytocannabinoid content or unapproved drug products), hemp oil (products self-defined as hemp oil, hemp-derived, or “broad spectrum” with no defined cannabinoid content), and cannabis (all whole cannabis plant products regardless of administration)
When stratified by intervention category (n = 870 study records, including duplicates), median enrollment (IQR) was 48 participants (0–96) for drugs, 40 (0–80) for compounds, 40 (0–81) for cannabis, and 54 (20–88) for hemp (Fig. 3B). There were no noticeable differences in enrollment between intervention categories.
3.4 Study DurationFor study duration analyses, 17 of the 879 studies identified were excluded, owing to lack of data or recording of an extreme outlier value, resulting in inclusion of 862 study records including duplicates. Mean and median duration for unique studies (n = 808) were 837 days and 717 days (IQR 366–1117), respectively. A total of 402 studies (49.8%) had actual completion dates, and 398 (49.3%) had estimated completion dates; eight studies (1.0%) reported a study duration but not whether their completion date was estimated or actual. Median duration of studies with actual completion dates was 579 days (IQR, 274–1014). When stratified by intervention category, the longest studies with actual completion dates were those that investigated cannabis (Fig. S3A). Median study duration was shorter for compound studies versus drug studies, although compound studies had more outliers (> 1.5 × IQR). The longest median (IQR) study durations were for early phase 1 (832 days [IQR 330–1343]) and phase 1/2 (821 days [504–1051]) studies (Fig. S3B).
3.5 Sponsoring InstitutionA total of 267 different sponsors (Appendix 2) were listed across the studies. Of the 825 unique studies, 581 (70.4%) were sponsored by academic institutions/hospitals, 168 (20.4%) by pharmaceutical companies, 54 (6.5%) by commercial entities, 21 (2.5%) by government, and 1 (0.1%) by an individual.
Results for sponsoring institutions stratified by intervention category and study phase are shown in Figure S4. The proportion of study records including duplicates (n = 879) in which the study was sponsored by academic institutions/hospitals was 60.0% for drug studies (172 of 287 studies), 74.4% for compound studies (285 of 383 studies), 82.0% for cannabis studies (146 of 178 studies), and 64.5% for hemp studies (20 of 31 studies) (Fig. S4A). When unique studies (n = 825) were stratified by phase, pharmaceutical companies sponsored most of the phase 3 trials, whereas academic institutions/hospitals sponsored more diverse phases of trials, and commercial entities sponsored the lowest proportion of registered clinical trials (Fig. S4B).
3.6 Chronological TrendsThe number of registered cannabis studies increased chronologically during the three time periods investigated, with 168 studies initiated up to 2013 (mean and median participant enrollment, 91 and 42 [IQR 24–85]), 199 studies from 2014–2018 (89 and 36 [IQR 18–80]), and 450 studies from 2019 (116 and 50 [IQR 20–104]). The overall trend showed an increasing number of studies when plotted by actual or estimated start date (Fig. S5).
Comments (0)