
Remember me
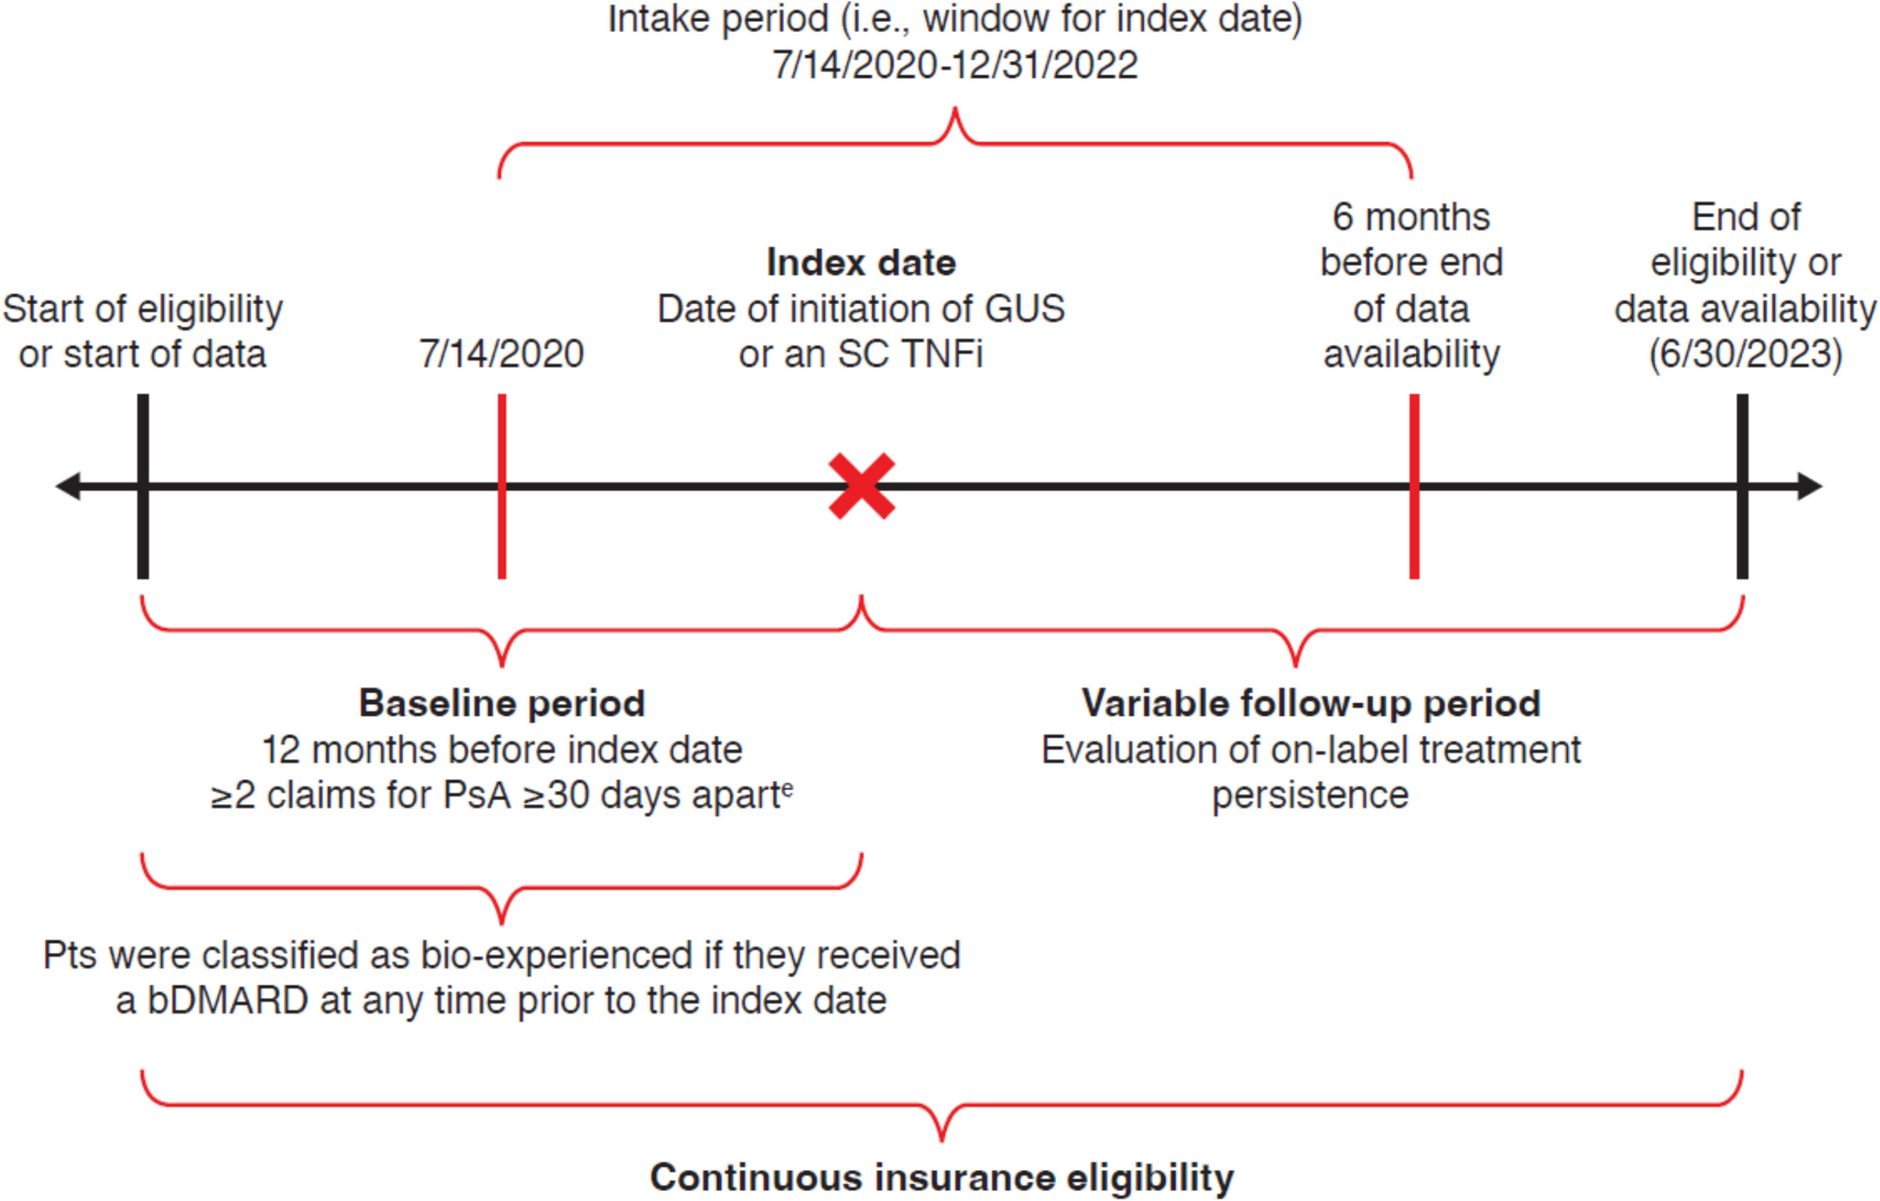
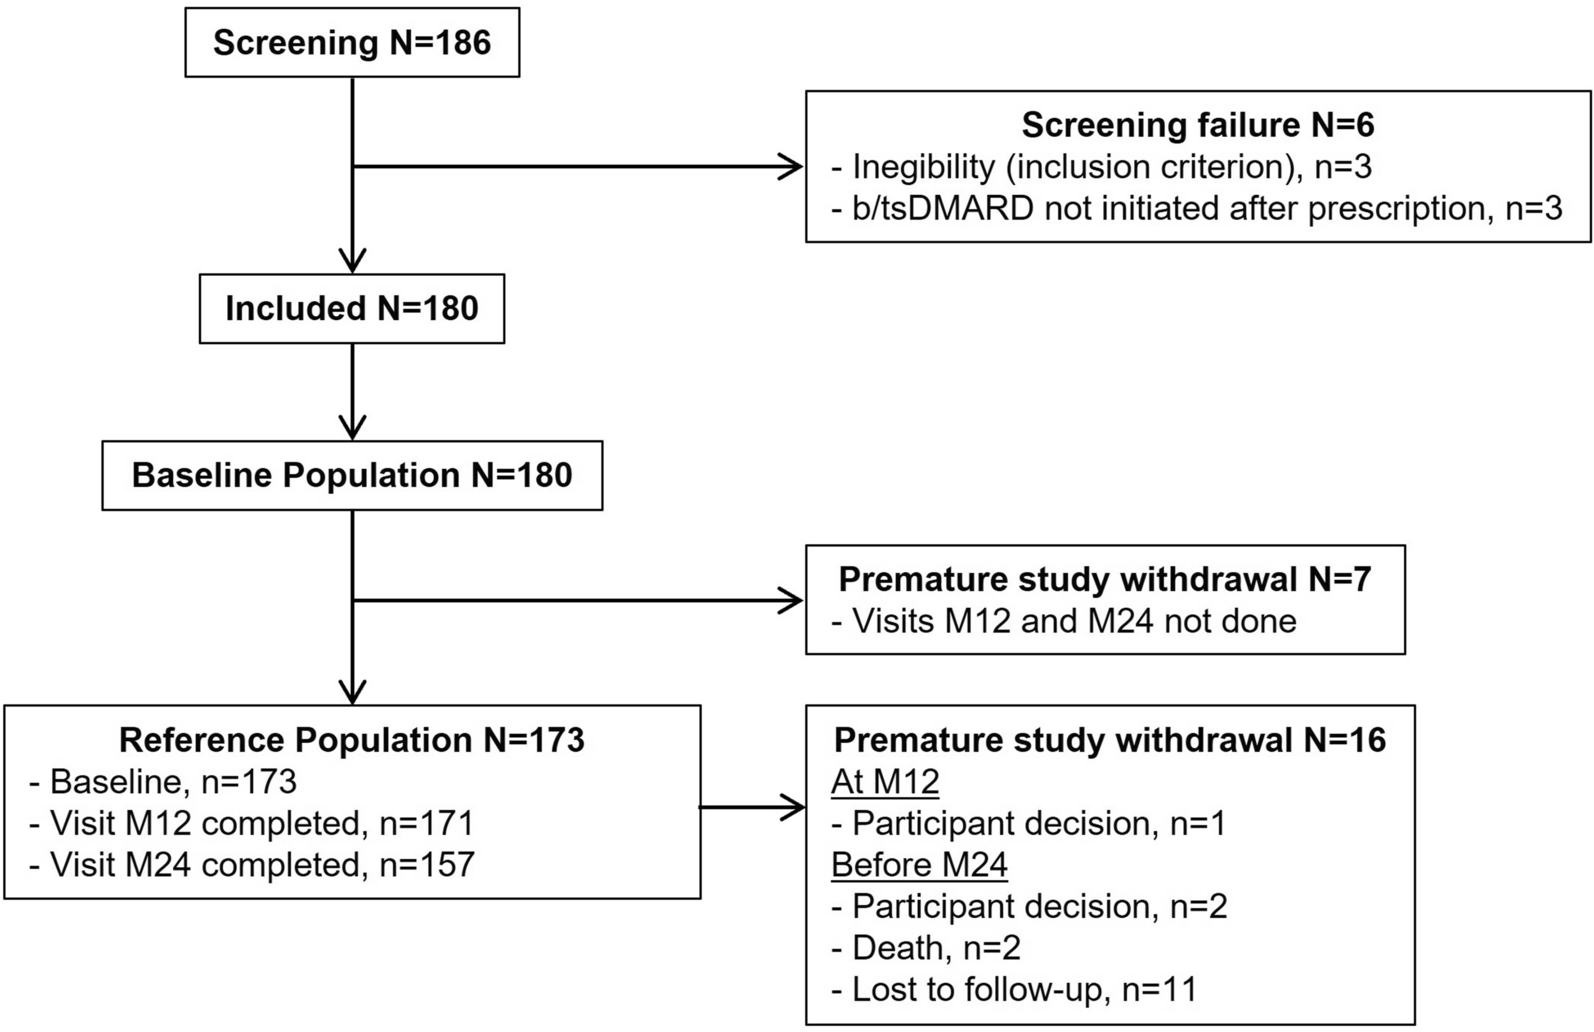

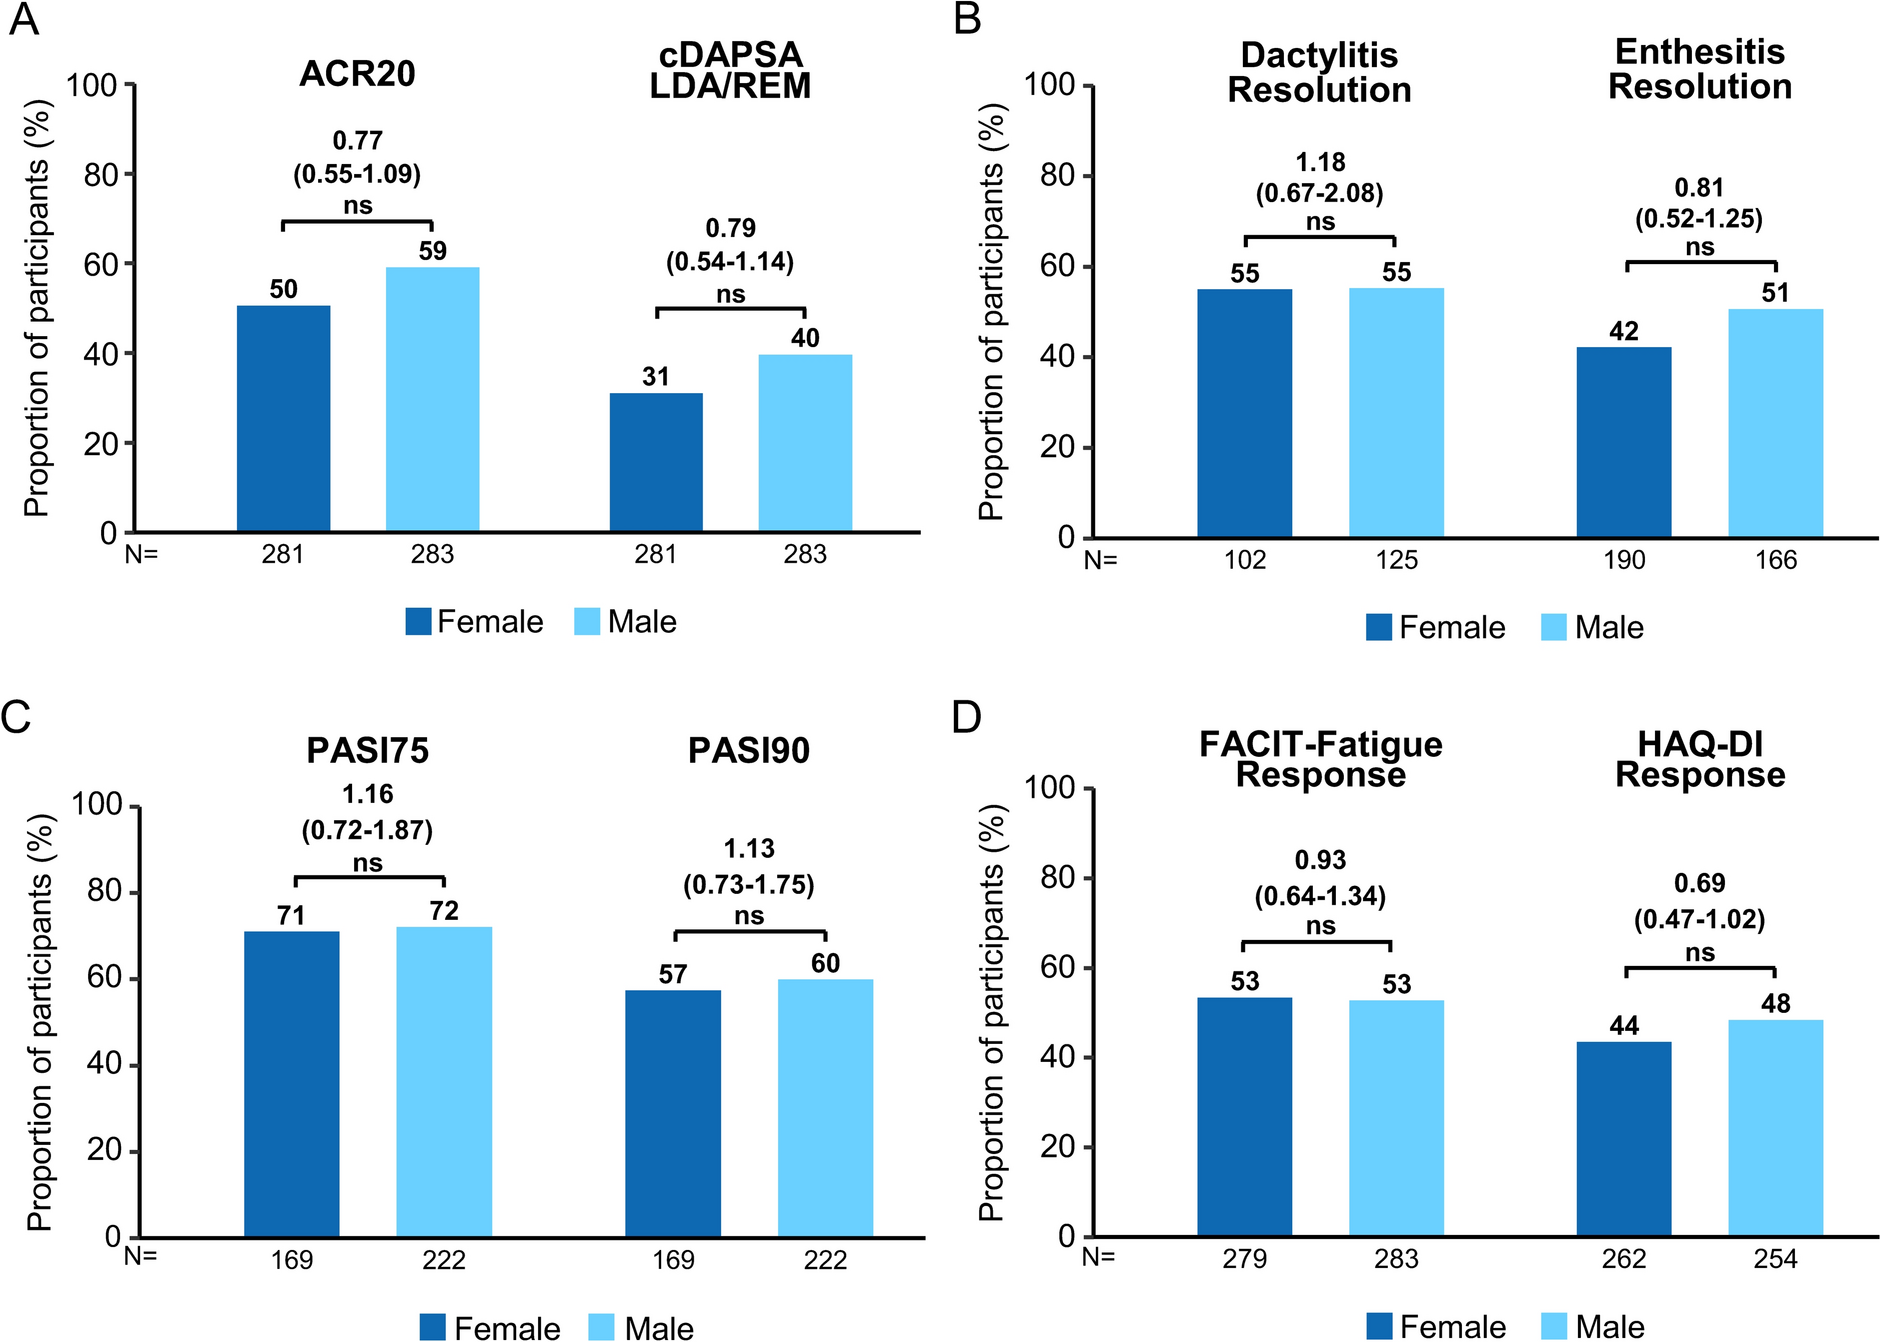
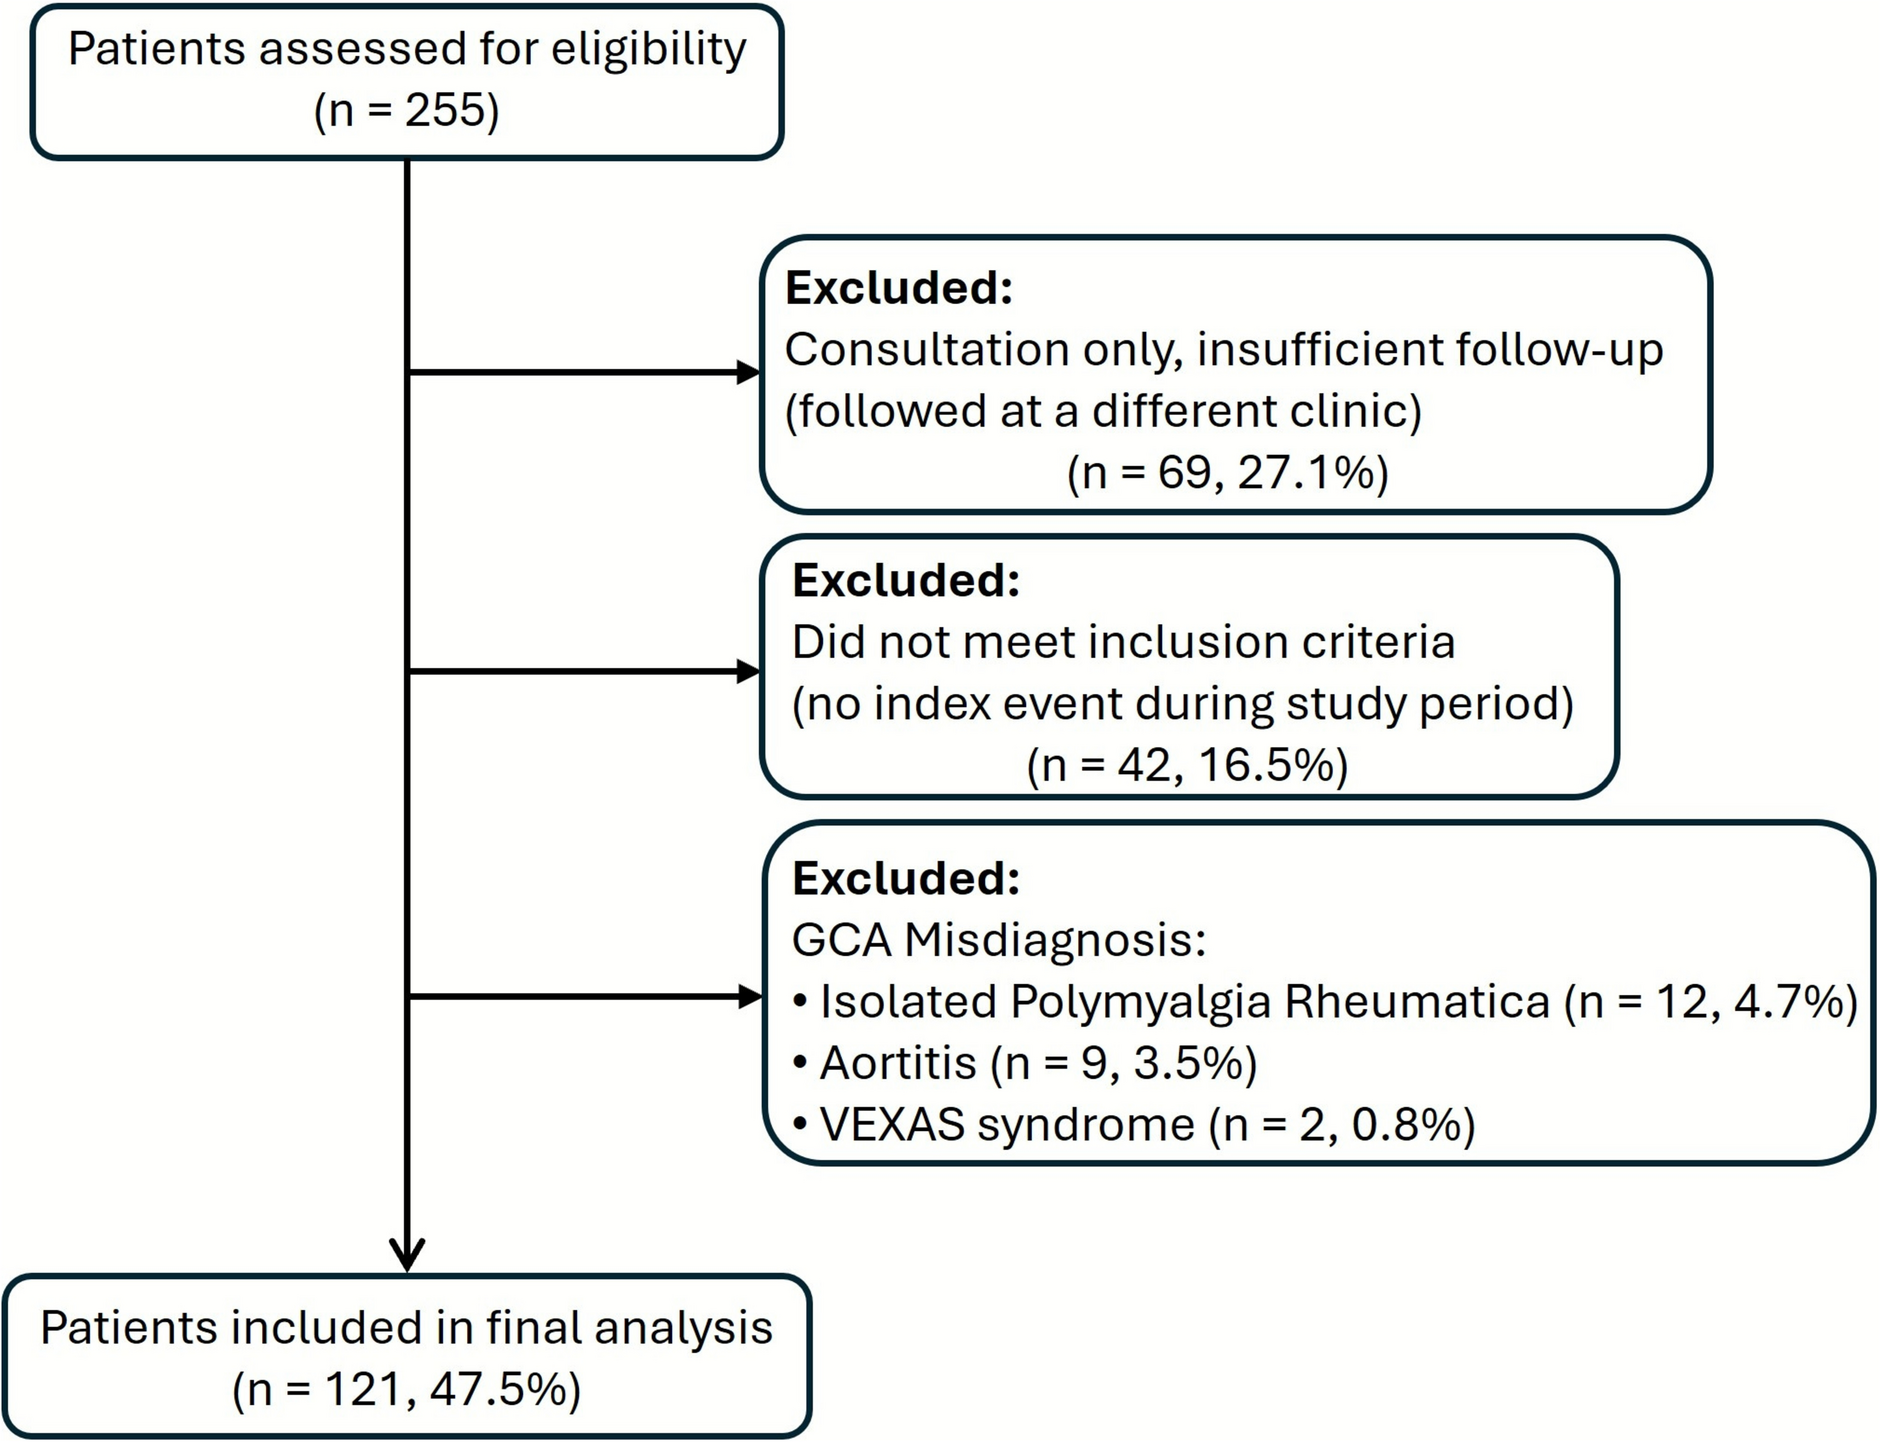
A total of 255 patients were assessed for eligibility (Fig. 1 and Table 1). Of these, 134 were excluded for the following reasons: patients were seen for opinions/consultations only with insufficient follow-up time as they were actively followed at other centers (69, 27.1%), patients did not experience an index event during the study period (42, 16.5%), and misdiagnosis of GCA (23, 9.0%) including cases of isolated PMR (12, 4.7%), isolated aortitis (9, 3.5%) (isolated aortitis was not classified as GCA unless the large vessel phenotype was compatible), and VEXAS syndrome (2, 0.8%) (not target population). Ultimately, patients (121, 47.5%) fulfilling the inclusion and exclusion criteria were included in the final analysis and all patients (121, 100%) met the 2022 American College of Rheumatology (ACR)/European Alliance of Associations for Rheumatology (EULAR) classification criteria for GCA. All patients in the GC + OIS group were treated with MTX as the primary steroid-sparing agent. A few patients switched from GC + MTX to GC + LEF (3, 3%) or from GC only to GC + Cyclo (1, 1%) when other treatments were not possible. No other conventional synthetic disease-modifying antirheumatic drugs (DMARDs), biologic agents, or JAK inhibitors were used within this subgroup during the study period.
Fig. 1
Patient disposition. GCA giant cell arteritis
Table 1 Patient dispositionBaseline CharacteristicsThe GCA study population included 121 patients living with GCA, predominantly female (83, 68.6%) and white (111, 91.7%) (Table 2). The GCA diagnoses were either new-onset (104, 86.0%) or relapsing (17, 14.0%) at index date (Table 3). The proportion of new-onset cases was similar across treatment groups (42 or 87.5% in the GC only group, 55 or 87.3% in the GC combined with TCZ group (GC + TCZ), and 7 or 70.0% in the GC combined with OIS group (GC + OIS).
Table 2 Baseline demographic characteristicsTable 3 Giant cell arteritis relapse vs. new onsetThe median age (76 years, IQR 69–82) showed that more than half of the patients were aged 75 years or older (70, 57.9%); the median weight (65 kg, IQR 58–71) and the median BMI (23.5 kg/m2, IQR 22.1–26.0) were also recorded. Many patients had comorbid conditions, including hypertension (76, 62.8%), diabetes (21, 17.4%), and coronary artery disease (16, 13.2%). Smoking history showed that over half of patients had never smoked (63, 52.1%), while some were former smokers (52, 43.0%), or current smokers (6, 5.0%). The mean erythrocyte sedimentation rate (ESR) (49.7 mm/h, SD 18.6, median 49, IQR 36–60), and the mean C-reactive protein (CRP) (88.9 mg/L, SD 71.4, median 66, IQR 36–120) were reported at baseline.
All (121, 100%) patients received oral GCs, with several (19, 15.7%) also receiving GCs intravenously (Tables 4 and 5). Intravenous GCs were administered to patients during the diagnostic workup, prior to confirmation of GCA diagnosis. The mean daily oral dose was 54.3 mg (SD 11.1), with a median of 60 mg (IQR 50–60) across treatment groups.
Table 4 Baseline clinical characteristicsTable 5 Proportion of patients receiving glucocorticoids, tocilizumab, or other immunosuppressants at baselinePMR without cranial symptoms was observed in a small proportion of patients (5, 4.1%), with similar proportions across treatment groups (2 or 4.2% in the GC group, 3 or 4.8% in the GC + TCZ group, and none in the GC + OIS group) (Table 6).
Table 6 Polymyalgia rheumatica without cranial symptomsTreatment PatternsThe mean time from GCA diagnosis to initiation of therapy was 128.6 days (SD 378.6) across all patients (Table 7). Subgroup analysis revealed shorter mean initiation times for patients treated with GC only (48, 101.2 days (SD 287.2)) and those receiving GC + TCZ (63, 84.0 days (SD 224.1)). In contrast, patients treated with GC + OIS experienced a later start (10, 514.6 days (SD 963.1)) after trying other treatments first.
Table 7 Time from giant cell arteritis diagnosis to therapy initiationThe median cumulative GC exposure prior to the index date (120 mg, IQR 0–380), the mean exposure (550 mg, SD 993.5), and the range (up to 5020 mg) were reported (Table 4). None of the patients had prior exposure to TCZ or OIS, and no OIS were used at baseline.
At index date treatment regimens varied and included GC only (48, 40.0%), GC + TCZ (63, 52.1%), and GC + MTX (10, 8.3%). In the group taking GC only, most were treated orally (40, 83.3%), while a smaller number received GC intravenously (8, 16.7%) (Table 5). Those receiving GC only intravenously were subsequently transitioned to orally administered prednisone.
Figure 2 presents a Sankey diagram illustrating the treatment patterns among patients with GCA, highlighting the frequent transitions between therapies. At baseline (index event), treatment was distributed between GC monotherapy (48, 40%), GC + TCZ (63, 52%), and GC + MTX (10, 8%) (Table 5). By 1 year, GC monotherapy increased by 33 patients and became the predominant regimen (81, 67%), while GC + TCZ decreased by 41 patients (22, 18%), GC + MTX increased by 5 patients (15, 12%), two patients (2, 2%) started LEF, and one patient (1, 1%) discontinued treatment. At 2 years, GC monotherapy remained dominant (86, 71%), GC + TCZ declined further (14, 12%), GC + MTX treatment remained relatively stable (14, 12%), one patient was on LEF (1, 1%) and treatment discontinuation increased (6, 5%). These changes were often driven by factors such as adverse side effects, disease relapse, or in the case of TCZ, the expiration of provincial coverage after 1 year.
Fig. 2
Sankey diagram showing giant cell arteritis treatment patterns. Cyclo cyclophosphamide, GC glucocorticoid, LEF leflunomide, MTX methotrexate, TCZ tocilizumab. Red = GC only, Blue = GC + TCZ, Green = GC + MTX, Yellow = GC + Cyclo, Orange = GC + LEF, Purple = END (end of patient study participation, no subsequent follow-up visits), Dark blue = STOP (patient stopped all treatment). One month visit occurred within ± 2 weeks, 3 month visit within ± 1 month, 6 month visit within ± 2 months, 1–3 year visits within ± 2.5–4 months
Remission and Relapse RatesOf the 121 patients included in the study, approximately two-thirds (83, 68.6%) were in unadjusted sustained remission at 12 months (Table 8). The unadjusted sustained remission rate was similar in the GC only (35, 72.9%) and the GC + TCZ (44, 69.8%) groups, while the GC + OIS group rate was lower (4, 40.0%) (Table 8). Adjusted logistic regression analysis for sustained remission at 12 months can be found in the Supplementary Material, Table S1.
Table 8 Primary analysis: unadjusted sustained remission rates at 12 monthsDespite treatment, relapse was prevalent with close to half of patients (58, 47.9%) experiencing at least one relapse. The median time to first relapse was under 1 year (283.5 days, 95% CI for median = 206.0–326.0) (Table 9). Just under two-thirds (6, 60.0%) of patients in the GC + OIS group experienced a relapse (Table 9). Patients who relapsed after initial GC only therapy were clinically evaluated, and either TCZ or MTX was introduced on the basis of individual risk assessment and guideline-aligned practice, with adjunctive therapy added when relapse risk or steroid toxicity was a concern.
Table 9 Time from index event (first remission) to first relapse (full analysis set)Among patients who discontinued TCZ (47, 74.6%), a quarter (16, 25.4%) experienced a relapse, with a median time to relapse of 254.0 days (95% CI for median was not estimable as a result of insufficient events or data censoring) (Table 10). Patients in the GC-only treatment group who discontinued GC (27, 56.3%) saw fewer relapses following GC discontinuation (6, 4.9%) (Table 11). Similarly, among patients in the GC + OIS group who discontinued OIS (7, 70%), a small number of patients relapsed (2, 20%) (Table 12). In the first year, a third (22, 35.0%) of patients still on TCZ relapsed, and additional (12, 19.0%), though fewer, relapses occurred in the second year (Table 13).
Table 10 Time from tocilizumab discontinuation to first relapseTable 11 Time from glucocorticoid discontinuation to first relapseTable 12 Time from other immunosuppressant discontinuation to first relapseTable 13 Number of relapse events by yearGlucocorticoid UseThe cumulative GC exposure over the first 12 months varied among treatment groups, with GC + TCZ group experiencing the lowest overall GC burden (Table 14). The mean cumulative GC dose was the highest in the GC only group (4690 mg, SD 969), followed by the GC + OIS group (4539 mg, SD 1289), and lowest in the GC + TCZ group (3431 mg, SD 1049). While the range of cumulative doses spanned all groups, the GC + TCZ group exhibited both the lowest minimum (1985 mg) and a lower maximum (6948 mg). MTX use, however, was associated with higher overall GC exposure, indicating a less pronounced steroid-sparing effect. These results are further corroborated by annualized dosing trends illustrated in Fig. 3, showing consistently lower GC use in the TCZ-treated cohort. However, despite TCZ’s role as a steroid-sparing agent, all participatingFootnote 1 patients (120, 99.2%) were still receiving GCs at week 52, highlighting the persistent difficulty in achieving steroid-free remission. This underscores the complexity of disease management and the limitations of current therapeutic strategies in fully eliminating GC dependence.
Table 14 Cumulative glucocorticoid dose over first 12 monthsFig. 3
Annualized dosing trends by treatment group (full analysis set). GC glucocorticoid, mg milligram, TCZ tocilizumab, OIS other immunosuppressant. Histogram of final cumulative GC dose (mg, prednisone equivalent) over 12 months. Colored bars represent number of patients in each treatment group by dose range. Overlaid lines represent kernel density estimates (smoothed distribution) for each group
Safety and Adverse EventsTreatment-related AEs were documented across all groups, with hypertension (31, 25.6%) and hyperglycemia (10, 8.3%) representing the most frequently reported events (Table 15). Infections (21, 17.4%) occurred with slightly higher rates in the GC + TCZ group (13, 20.6%) compared to the GC only group (7, 14.6%). A small number of gastrointestinal upset events (7, 5.8%) as well as psychiatric (5, 4.1%) AEs were reported. Notably, a few patients (2, 1.7%) in the GC + TCZ group experienced bowel perforation, a known potential side effect of TCZ therapy. Osteoporosis was reported in patients (2, 3.2%) receiving GC + TCZ with no documented cases in other groups.
Table 15 Treatment-related adverse effects
Comments (0)