Materials
Evocalcet was synthesized by the Mitsubishi Tanabe Pharma Corporation.
Animals
FVB/N background PTH-cyclin D1 transgenic mice, which exhibit parathyroid-targeted overexpression of the human cyclin D1 oncogene, were used in this study as a model of primary hyperparathyroidism (PC) [21]. Parathyroid-targeted overexpression of the cyclin D1 oncogene not only results in the development of abnormal parathyroid cell proliferation, but the mice also develop chronic biochemical hyperparathyroidism with an increased PTH–calcium setpoint [22]. All mice were provided with the commercially available rodent diet, CE-2 (Clea Japan, Inc., Tokyo, Japan), containing 1.14% Ca and 1.08% phosphate. Food and water were available ad libitum. Animal studies were approved by the Osaka Metropolitan University Graduate School of Medicine.
Experimental protocols
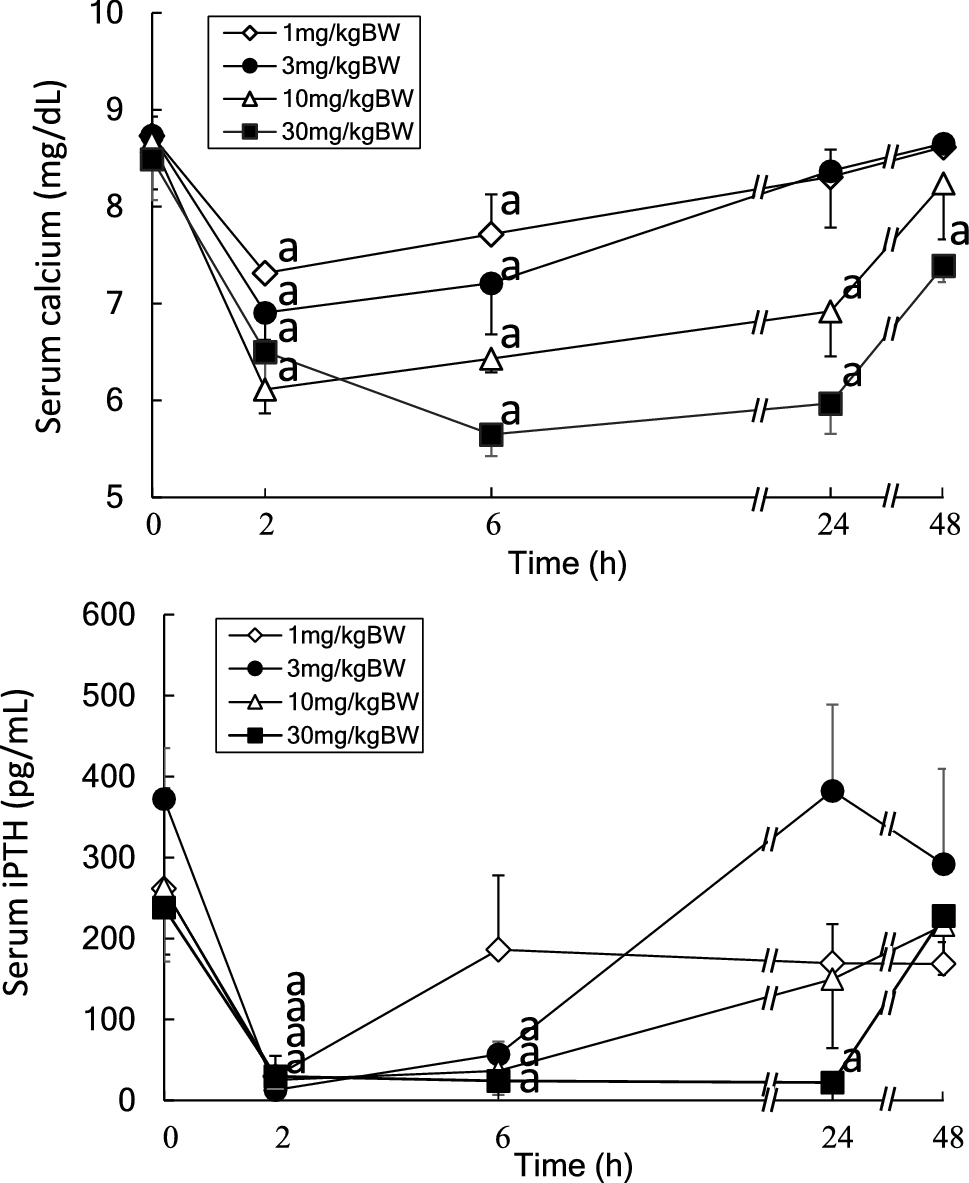
WT mice were used for time-course changes after the oral injection of various doses of evocalcet (1, 3, 10, 30 mg/kg BW) suspended in 0.5% methylcellulose solution, and blood samples were collected at 0, 2, 6, 24, and 48 h after administration, to estimate an appropriate dose of evocalcet to administer to the mice. Similar analyses using cinacalcet HCl (cinacalcet) were performed previously [23]. In the following experiments, 0.025 mg evocalcet/g chow, 1 mg cinacalcet/g chow, or vehicle was administered.
PTH–calcium setpoint analyses
The setpoint analyses were performed on 16 PC mice and 8 WT mice (64–77-week-old) (Table 1). The 16 PC mice were then randomly assigned into 2 equal groups for the analysis. Evocalcet (0.025 mg/g in chow) or vehicle was administered for 11 days, and the PTH–calcium setpoint analyses were performed from the third day to the 10th day after the start of the administration.
Table 1 Serum parameters and body weight of the mice for setpoint analyses in PC and WT mice before treatmentsPTH–calcium setpoint analyses were performed using a previously described method [24]. Briefly, each mouse was administered a single intraperitoneal injection of the indicated dose of calcium gluconate or EGTA in saline. To change the serum calcium levels, mice were administered calcium gluconate (300 µmol/kg BW) or EGTA (300 and 450 µmol/kg BW), and blood was collected at 30, 60, and 90 min after the administration. When the lowest serum calcium was not below 7.0 mg/dL for untreated PC mice or 6.0 mg/dL for evocalcet-treated PC mice, 600 and 750 µmol/kg BW EGTA were administered.
To obtain the setpoint, the maximum and minimum PTH secretion levels, and the slope at the setpoint from the relationship between serum PTH concentration and serum calcium concentration (mediated by calcium gluconate and/or EGTA administration), sigmoidal curves were generated by the four-parameter models as previously described [3]. For setpoint analysis, PTH–calcium data from each mouse were fitted individually using a four-parameter logistic (sigmoidal) model [24]. Briefly, the PTH concentration was assigned to the response role, and the serum calcium concentration was assigned to the regressor role, and a sigmoidal curve was obtained using a logistic 4P model from each mouse using JMP software, version 12.0.1 (SAS Institute, Cary, NC). Setpoint data from each mouse were fitted individually to a four-parameter logistic model, yielding mouse-specific estimates of maximum PTH, minimum PTH, setpoint, and Hill slope. Goodness-of-fit was assessed for each individual model using AICc, BIC, SSE, MSE, RMSE, and R2.
Parathyroid gland proliferation analyses
Parathyroid gland proliferation analyses were performed on 30 PC mice and 10 WT mice (59–71-week-old) as previously described [23]. The 30 PC mice were randomly assigned into 3 equal groups for the analysis. Evocalcet, cinacalcet, or vehicle was administered for 10 days and then sacrificed under medetomidine hydrochloride, midazolam, and butorphanol tartrate combined anesthesia, and both parathyroid glands were removed. All mice received 240 µg/day of subcutaneous 5-bromo-20-deoxyuridine (BrdU) continuously via Alzet micro-osmotic pump (model 1007D; DURECT Corporation, Cupertino, CA 95014), implanted subcutaneously for the last 5 days before sacrifice.
Measurement of biochemical parameters
Blood samples were collected by tail nicking or cardiac puncture, and serum was collected immediately after coagulation of the blood. Serum was stored at − 80 °C until assayed for serum concentrations of calcium, phosphate, creatinine, and PTH. Serum calcium, phosphate, and creatinine levels were measured using diagnostic kits (FUJIFILM Wako Pure Chemical Corporation, Osaka, Japan). Serum PTH levels were measured using the mouse PTH enzyme immunoassay (Quidel Corporation, Athens, OH, USA).
Parathyroid immunohistochemistry for CaSR and VDR
Resected parathyroid glands were immediately fixed in 4% paraformaldehyde for 24 h and embedded in paraffin. Tissue sections (3 μm) were cut and mounted on glass slides as previously described [23, 25]. Deparaffinized sections were treated with Peroxidazed 1 (Biocare Medical, Pacheco, CA, USA) for 5 min to block endogenous peroxidase activity. The antigen retrieval method, Heat-Induced Epitope Retrieval (HIER), was used. Sections were treated with HistoVT ONE (NACALAI TESQUE INC, Kyoto, Japan) at 90 °C for 1 min (CaSR) or 40 min (VDR).
After washing with TBS, the sections were incubated with blocking solution A (Histofine mouse stainkit; Nichirei Bioscience, Tokyo, Japan) for 60 min, followed by three washes in TBS for CaSR immunohistochemistry. Sections were then incubated with anti-CaSR mouse monoclonal antibody (Novus Biologicals, LLC, Centennial, CO, USA) (diluted 1:15,000) overnight at 4 °C in a humidified chamber. After washing with TBS, sections were incubated with blocking solution B for 10 min, and then incubated with HRP-conjugated anti-mouse antibody (Histofine Simple stain MAXPO; Nichirei Bioscience, Tokyo, Japan) as appropriate for 10 min at room temperature.
For VDR immunohistochemistry, sections were incubated with 5% Normal Goat Serum for 60 min. Sections were then incubated with anti-VDR Rabbit polyclonal antibody (Cell Signaling Technology, Massachusetts, USA) (diluted 1:1,000) overnight at 4 °C in a humidified chamber. After washing with TBS, sections were incubated with HRP-conjugated anti-rabbit antibody (EnVisiom + /HRP, Rabbit; Agilent, CA, US) for 30 min at room temperature.
For visualization of all immunoreactions, sections were stained using 3, 3’-diaminobenzidine DAB (Histofine DAB substrate kit; Nichirei Bioscience, Tokyo, Japan) and counterstained with hematoxylin, and then dehydrated and mounted onto cover slips.
To estimate the immunohistochemical expression of the CaSR and VDR in parathyroid glands, image analysis was performed using ImageScope (Aperio Technologies, Inc., Vista, CA, USA). Pathological images from all sections were captured in tiff format at 200× magnification. These images were analyzed using the Positive Pixel Count Algorithm v9. This algorithm quantifies the amount of staining in a specific area, and counts the number and intensity-sum in three intensity ranges (weak positive, positive, strong positive). Staining intensity was classified as negative (0), weak positive (1), positive (2), and strong positive (3) in each pixel. The intensity of immunohistochemical expression of the CaSR and VDR was assessed in each mouse.
BrdU incorporation analyses
To identify the proliferating cells, BrdU-incorporated cells were detected using a BrdU immunohistochemistry kit (cat# ab125306, abcam plc., Cambridge,UK). All pathological images were scanned at 20 × magnification using the Aperio CS2 slide scanner (Leica biosystems). To identify proliferating cells, BrdU-positive cells were detected using HALO AI image analysis software (ver.3.2, indica labs). The regions of parathyroid glands in the entire image were specified using the annotation tool. The machine learning nuclei segmentation classifier algorithm was trained to recognize and segregate nuclei using shape and color. The proportion of BrdU-positive nuclei to the total number of nuclei in the entire parathyroid glands was calculated.
Statistical analyses
Intergroup comparisons were made using the Tukey–Kramer method. Time-course changes in parameters were analyzed by Tukey’s Honest Significant Difference test. All data are presented as the mean ± SD. P < 0.05 was taken to indicate statistical significance. All statistical analyses were performed with commercially available software for Windows (JMP software version 12.0.1 (SAS Institute, Cary, NC)).


Comments (0)