
Remember me
Electrical stimulation is a cornerstone of neurotechnology, enabling therapeutic neuromodulation and bidirectional communication with neural circuits via implanted devices [1–4]. However, long-term efficacy is often limited by foreign body response and chronic neuroinflammatory responses triggered by electrode-tissue interfaces [5–7]. While neuronal responses to intracortical microstimulation (ICMS) are well-characterized [8–12], the concurrent effects of electrical stimulation on microglia [13, 14], the brain’s primary immune cells [15–17], and subsequent ICMS outcomes remain poorly understood [18, 19].
Microglia are not merely passive responders to injury, they dynamically regulate synaptic plasticity, neuroinflammation, and electrode biocompatibility through cytokine signaling and the formation of physical barriers in brain tissue [19, 20]. Electrical stimulation through conductive materials may influence these microglia–neuron interactions [21], thereby potentially modulating glia-neuron signaling and impacting the fidelity and longevity of neuromodulation. Although microglia do not generate action potentials, they can express voltage-sensitive receptors, and electrochemically sensitive pathways [5, 6, 22]. Electric fields can perturb extracellular ion concentrations (e.g. Ca2+, K+) or redistribute charge across the microglial membrane, activating downstream pathways that mediate pro-inflammatory cytokine release or anti-inflammatory signaling [23–25]. Notably, in vitro studies demonstrate that microglia exhibit directed migration, increased process motility, and morphological remodeling in response to direct electric fields [14, 18]. However, whether microglia respond to ongoing stimulation in vivo and how this influences their interactions with neurons remain unresolved.
Following device implantation, microglia transition to a reactive state within minutes by extending processes toward the implant site[26] followed by the release of pro-inflammatory cytokines within hours [22, 27, 28]. These cytokines exacerbate oxidative stress and neuronal damage while also driving glial scar formation[29], which increases electrochemical impedance [30–32] and degrades signal fidelity [33–35]. However, microglia also clear cellular debris[36] and secrete neurotrophic factors [16, 37] indicating a context-dependent role that could be harnessed to improve device integration. For example, fractalkine signaling (CX3CL1–CX3CR1) downregulates excessive microglial reactivity [27, 38], while adenosine (a byproduct of microglial ATP metabolism) suppresses neuronal hyperexcitability [24, 39–41]. Low-frequency ICMS (2–20 Hz) has been shown to bias microglia toward pro-regenerative phenotypes, increasing trophic factor release and reducing inflammatory cytokines [42, 43]. In neuroprosthetic applications, this suggests a strategy wherein appropriately tuned electrical stimulation could modulate microglial states to attenuate cytokine-driven inflammation to promote microglia-mediated tissue integration at the electrode interface.
Here, we investigate how 1 h of 10 Hz ICMS influences microglial-neuron interactions in vivo using two-photon imaging in mice expressing GFP in microglia and jRGECO1a in Thy1+ neurons (Cx3CR1-GFP × Thy1-jRGECO1a.GP8.62), which label most excitatory neurons in visual cortex [44]. We selected 10 Hz because it lies within the biologically relevant low-frequency range, has been consistently shown to bias microglia toward pro-regenerative states [42, 43]. However, its effect on dynamic microglial morphological activity remains unclear. Additionally, since microglia have been demonstrated to suppress neural activity [45, 46], we asked whether stimulation alters microglial process dynamics and whether these interactions depend on the activity state of nearby neurons. Our findings show that ICMS induces microglial process extension toward both the electrode and activated neurons, with microglia preferentially contacting neurons exhibiting stronger adaptation in calcium activity. These results identify activity-dependent patterns of microglial surveillance during ICMS and suggest that stimulation itself can shape microglial contributions to circuit stability and neuroprosthetic performance.
2.1. Experimental animal modelsAll animal care and procedures were performed with the approval of the University of Pittsburgh Institutional Animal Care and Use Committee and in accordance with regulations specified by the Division of Laboratory Animal Resources. Mice were kept under standard conditions on a 12 h light/ dark cycle with access to water and food ad libitum. Two strains, B6.129P2(Cg)-Cx3cr1tm1Litt/J (Cx3cr1GFP, strain# 5582, Jackson Laboratories; Bar Harbor, ME) and Tg(Thy1-jRGECO1.1a)GP8.62Dkim/J (jRGECO1a, strain# 30528, Jackson Laboratories; Bar Harbor, ME), were crossed to generate double-transgenic offspring expressing GFP in microglia and jRGECO1a in excitatory neurons (Cx3cr1GFP/jRGECO1a, figure 1(a)). This model enabled simultaneous quantification of microglial morphology and neuronal calcium activity, with jRGECO1a providing dense and selective labeling of excitatory neurons in layer 2/3 in V1, consistent with prior characterizations [44].
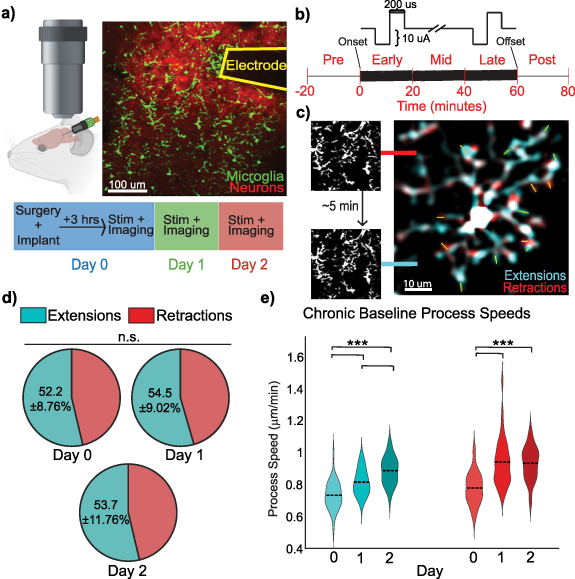
Figure 1. Chronic microelectrode implantation transiently increases microglial process motility across Days 0–2. (a) Experimental setup for two-photon microscopy of Cx3CR1-GFP/Thy1-jRGECO1a mice implanted with a single-shank microelectrode in L2/3 of the visual cortex. (b) ICMS paradigm for 10 Hz symmetric, cathodic-leading, biphasic pulses with a pulse width of 200 µs for 1 h. (c) Representative analysis of microglial process motility using FIJI. Time-lapsed images were overlayed in 5 min intervals to highlight extensions (blue) and retractions (red). (d) The net balance of microglial process movements (extensions vs. retractions) remains unchanged across Days 0–2 post-implantation (N = 4 mice; n = 39, 38, 37 microglia; raw counts Day 0: 654/583, Day 1: 711/595, Day 2: 747/648); GLMM, p = 0.700), reflecting stable overall microglial surveillance. Within-day analyses (supplemental figure 1(b)) reveal a transient bias toward extensions on Day 1. Cumulative extensions and retractions were calculated by summing process movements from four consecutive 5 min intervals for each microglia. (e) Chronic implantation increases extension and retraction rates over days. LME main effect of Day: extensions p = 2.04 × 10⁻¹², retractions p = 4.02 × 10−09; post hoc pairwise contrasts: extensions D0vsD1 p = 1.9 × 10⁻⁵, D0vsD2 p = 2.6 × 10⁻¹³, D1vsD2 p = 1.9 × 10⁻⁴; retractions D0vsD1 p = 2.2 × 10⁻⁸, D0vsD2 p = 1.0 × 10⁻⁷, D1vsD2 p = 0.78 (N = 4 mice).
Download figure:
Standard image High-resolution image 2.2. Probe implantation surgeryCx3cr1GFP/jRGECO1a mice (n = 2 male, 2 female, <6 mo., 25–35 g) were implanted with a single-shank Michigan style microelectrode array for awake, head-fixed imaging, as described previously [47–49]. The mice were sedated with a cocktail of 7 mg kg−1 and 75 mg kg−1 ketamine prior to removal of the sterilized scalp and drilling of bilateral craniotomies over the visual cortices. Bone screws were implanted over the motor cortices for stability and for ground and reference. Prior to implantation, iridium electrode sites were activated to increase charge storage capacity [50] and 1 kHz impedance was verified to be <500 kOhm. Electrodes were targeted to the right hemisphere unless there was bleeding or injury. Single-shank 3 mm long electrode arrays with 4 Iridium channels of 702 µm2 electrode sites spaced 50 µm apart (NeuroNexus Technologies, Ann Arbor, MI) were implanted at a 30° angle from the horizontal plane using a Microdrive (MO-81, Narishige, Japan) so that stimulation occurred in layer 2/3 of the visual cortex (final depth of 200–300 µm below the surface). Once the electrode was inserted, the craniotomies were filled with sealant (Kwik-Sil) before being sealed with glass coverslips and dental cement. Ketofen (5 mg kg−1) was provided post-operatively up to two days post-surgery or as needed. Animals were allowed to wake up fully prior to any stimulation and imaging (3+ h).
2.3. Stimulation paradigmStimulation was provided using a TDT IZ2 stimulator controlled by an RZ5D system (Tucker-Davis Technologies, Alachua, FL). The stimulation paradigm is illustrated in figure 1(b) and is biphasic, symmetric, and cathodic-leading with 200 µs pulse width and 10 µA amplitude resulting in 2 nC/phase charge injection, well below the 4 nC/phase safety limit to ensure maximal biocompatibility [51, 52] even for a stimulation trial lasting an hour. Experiments included a 20 min non-stimulation baseline, 60 min of stimulation, and 20 min post-stimulation rest (figure 1(b)).
2.4. Two-photon imaging and stimulationImaging of neurons and microglia were achieved with a two-photon microscope (Bruker, Madison, WI) with an OPO laser (Insight DS+, Spectra Physics, Menlo Park, CA) equipped with a 16 × 0.8 NA water immersion objective (Nikon Instruments, Melville, NY) with a 3 mm working distance resulting FOV of 407 × 407 µm2 (1024 × 1024 pixels). Image acquisition consisted of ZT-series with a 2 µm step size over a 20 µm stack size with a 4.6 µs dwell time resulting in a stack period of 60.4517s. The wavelength of the latter alternated between stacks, starting with 1060 nm to image neuron activity, and 920 nm to image microglia morphology. While this imaging approach reduced temporal resolution, it minimized microglial process displacement across planes, maintained high signal-to-noise ratios for both cell types, and limited thermal loading near the electrode. To assess sampling consistency, we qualitatively confirmed the density of jRGECO1a-positive neurons per imaging volume was consistent across animals and sessions. Furthermore, microglial processes within the imaging volume encountered multiple neurons exhibiting distinct adaptation profiles, enabling an unbiased assessment of interaction frequency across neuronal response types. To minimize edge-related sampling artifacts, microglia located at the boundaries of the imaging volume were excluded from analysis. Imaging time points were 3 h, 24 h, and 48 h post-implantation to assess acute and early chronic responses. Timing metadata for each stack was exported for later synchronization with other datasets.
2.5. Data analysis2.5.1. Microglia analysisThe microglia ZT-series was processed using a Richardson–Lucy total variation deconvolution in ImageJ [53] followed by 3D Gaussian blurring and background subtraction. Following rigid motion correction, the series was then condensed to a 2D plane by taking the average of each Z-stack to capture as many microglia processes as possible regardless of their direction.
Process motility was manually measured in FIJI [54] via overlayed scans taken 4.32 min (2 frames) apart, like previous studies [55], where cyan represents extensions of processes and red represents retractions (figure 1(b)). Under 600%–1200% digital zoom, process migration toward the probe and cell body displacement toward the nearest probe surface were measured using the ‘Measure’ function in ImageJ. To avoid quantifying process movements out of the imaging volume, microglia were included only if they exhibited typical indicators of surveillance [15, 56], including repeated extensions and retractions. Measurements of process movements were verified by viewing the original T-series. Only process movements were captured during these measurements and were manually classified as extensions or retractions. Microglia were excluded from statistical analysis if they exhibited fewer than four measurable process movements during a given imaging session. These exclusions were rare and mostly occurred when cells were partially outside the imaging volume due to z-axis truncation. The three cells identified in supplemental figure 2(e) are the only ones excluded by this metric. This threshold was set to ensure robust quantification of process dynamics, as cells with extremely sparse movements due to this volumetric imaging artifact do not provide sufficient data to reliably assess extension/retraction balance, directionality, or polarity indices.
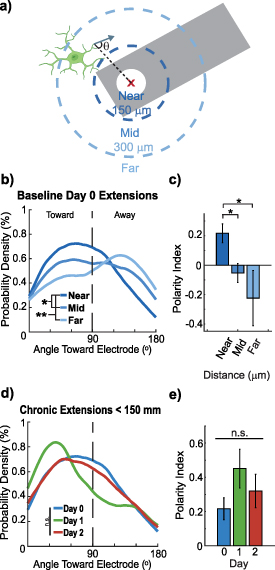
Figure 2. Microglial processes near electrodes transiently orient toward the implant on Day 1. (a) Schematic illustrating how the directionality of microglia process extensions was measured relative to the stimulation site (white circle) of the probe (gray). (b) Distribution of microglia extensions toward the electrode decreases with distance from the electrode (LME main distance effect p = 0.0043, post hoc Near: <150 µm, Mid: 150–300 µm, Far: >300 µm; Kolmogorov–Smirnov, p = 0.043, 0.0020, 0.29). (c) Microglial process polarity index shows stronger polarization toward the electrode in the <150 µm group compared to mid and far distances (LME main distance effect: p = 0.0073. One-way repeated measures ANOVA, p = 0.031, 0.021, 0.78; n = 18, 27, 6 microglia; microglia with fewer than 4 movements were excluded). (d) For microglia within 150 µm no significant LME main effect of Day was detected (LME Day p = 0.15). Distributional comparisons identified a Day 1 vs Day 0 difference (KS p = 0.034) but pairwise Day contrasts from the LME were not significant; therefore the Day 1 distributional shift is not supported as a significant Day effect in the mixed-model framework (n = 18, 10, 11 microglia; microglia with fewer than 4 movements excluded from polarity index calculations). Microglia with fewer than four measurable process movements or those partially outside the imaging volume were excluded from polarity and directionality analyses to avoid artifacts and ensure reliable quantification of extension behavior.
Download figure:
Standard image High-resolution imageThe properties of these process movements were calculated using MATLAB, and the angle or directionality of the process movements were calculated relative to either the electrode site or the nearest neuronal soma to the process. Each stimulation site was identified manually, and the direction of a process movement was calculated relative to the center of the site. Microglial extensions were analyzed in three distance bins (<150 µm, 150–300 µm, >300 µm) to capture spatially graded responses to electrode implantation. These bins correspond to clusters of microglia with preferential extension toward the probe, partial directional bias, or largely ramified morphology, consistent with prior characterizations of microglial responses to chronic implants [26].
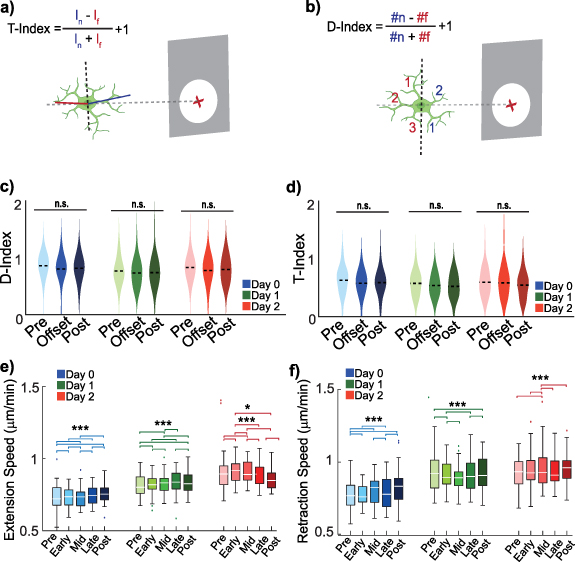
Similarly, process movements relative to the nearest neuron were calculated according to the center of the soma. Lastly, Directionality- and Transitional-indices (D- and T- indices) were calculated for each cell (equations (1) and (2)) [49, 57–59] separately with the length and position of processes manually drawn in ImageJ and processed in MATLAB (figure 3(b)),
Figure 3. Ten Hz ICMS transiently modulates microglial process speeds without altering overall morphology. (a) T-indices represent microglia T-stage morphology activation quantified using the length of the processes as a function of distance from the probe (gray). (b) D-indices represent microglia directionality of activation quantified using the direction of the processes as a function of distance from the probe (gray). (c) D-index not significantly affected by Day, Time, or Day × Time interaction (LME, p = 0.81, 0.33, 0.93). (d) T-index not significantly affected by Day, Time, or interaction (LME, p = 0.65, 0.40, 0.90). (e) Extension speeds show significant Day, Phase, and Day × Phase effects (LME: Day p = 4.1 × 10⁻¹⁵; Phase p = 3.0 × 10⁻²⁶; Day × Phase p = 1.4 × 10−55); post hoc contrasts shown. (f) Retraction speeds also show significant Day, Phase, and Day × Phase effects (LME: Day p = 4.5 × 10⁻¹²; Phase p = 2.0 × 10⁻¹⁷; Day × Phase p = 2.2 × 10⁻³³). (e), (f) post hoc paired comparisons within each day were conducted using LME with Holm correction for multiple testing. *= p < 0.05, **= p < 0.01, ***= p < 0.005.
Download figure:
Standard image High-resolution imagewhere f = # of processes away from electrode, n = # of processes near electrode,
where f = length of longest process away from electrode, n = length of longest process near electrode.
In order to assess the directionality of process movements for a single microglia cell, a histogram of the angles of the process movements relative to the electrode or nearest neuron was plotted. This histogram was then fit with a probability distribution function using an Epanechnikov kernel function. From there, the area under the curve (AUC) of the probability distribution function was calculated, with the area from 0 to 90 counting as toward the electrode, and 90–180 counting as away from the target. The polarity-index (ρ-index) was then calculated as a proportion of movements toward and away from the target (equation (3)) and ranges from −1 to 1, where −1 indicates a microglia only extending processes away from the target and 1 represents a microglia only moving processes toward the target,
where t = AUC of movements toward target, a = AUC of movements away from target.
2.5.2. Neural activity analysisFor each stimulation session, the average of each motion-corrected 1060 nm Z-stack was used to manually identify neurons and their profiles outlined using the ROI manager in ImageJ [10]. These ROIs and full ZT-series were subsequently imported into MATLAB for further fluorescence analysis. The fluorescence intensity of the neurons was filtered by taking the maximum intensity in each Z-stack to ensure that signals from somas not included in the full 20 µm stack would not be adversely represented. The resulting fluorescent signal (F) had a sample for every 2.16 min representing the maximal neuronal calcium activity. To correct for noticeable photobleaching due to the length of the imaging session (100 min), the fluorescent signal for the full FOV of each imaging session was fit with a linear model excluding any stimulation timepoints. Each neuron’s fluorescent signal was then adjusted according to the linear model. Beyond the signal preprocessing, each neuron’s distance from the stimulation site was calculated for further spatiotemporal analysis.
Once the neuron signal has been preprocessed, the neuron was classified according to its activation and the subsequent temporal profile. Given that microglia participate in neuronal excitability through fractalkine and purinergic signaling [24, 27, 40, 46], identifying the behavior of a neuron provides more specific insight into how microglia may modulate its excitability. A neuron was considered activated if its change in fluorescence (ΔF/F0) exceeded three standard deviations above the mean fluorescence during the baseline period, where F0 is the mean baseline fluorescence over the 20 min pre-stimulation period. This thresholding approach has been widely used in calcium imaging analyses to ensure that only responses exceeding intrinsic baseline variability are classified as activation [8, 10]. ΔF/F0 was calculated for each ROI relative to this baseline to quantify changes in calcium activity during ICMS. Subsequent profile analyses determined 4 distinct profiles of activated neurons: depressed, baseline adapting, adapting, and non-adapting. Neurons were identified as depressed post-activation if the average calcium activity was less than −0.5 times the threshold identified earlier. Neurons were classified as baseline adapting if the average of the signal during stimulation was within one standard deviation of the baseline. Neurons were adapting if the average of the signal was between 1 and 3 standard deviations of the activation threshold. Finally, non-adapting neurons were identified if more than half of the stimulation timepoints exceeded the activation threshold, suggesting these neurons were active for more than 30 min. These classification criteria were mutually exclusive. Sample waveforms for these activation profiles are shown in figure 6(b).
Non-activated neurons also exhibited distinct temporal profiles, with a subset showing immediate depressed activity at the onset of stimulation. These depressed non-activated neurons (supplemental figure 6(b)) were defined as having average calcium activity less than −0.5 times the activation threshold, without ever exceeding the activation criterion. This contrasts with depressed post-activation neurons, which first crossed the activation threshold before subsequently falling below baseline activity.
While neurons exhibited distinct activation profiles during stimulation, there were also two distinct profiles of neuronal calcium activity post-stimulation (figure 8(a)). Neurons were classified as depressed post-stimulation if the average calcium activity was less than −0.5 times the activation threshold. Otherwise, neurons were classified as baseline post-stimulation when the activity was within 0.5 standard deviations of the baseline activity.
2.5.3. Microglia–neuron interaction analysisTo examine microglia–neuron interactions during stimulation, microglia were overlaid with the neuronal ROIs identified earlier and each interaction was manually recorded alongside the timing of the microglia process movement. ROIs were designed to include regions with a representative density of jrGeco1a-expressing neurons and evaluated microglial targeting behavior only when clear spatial proximity to known neurons existed. Interactions were classified into connections and disconnections whenever microglia processes touched a neuron soma or retracted away from the soma. It is crucial to note that any disconnections would require the microglia to already be in contact with the neuronal soma.
2.5.4. StatisticsAll statistical analyses were performed in MATLAB with an alpha level of 0.05, and Bonferroni or Holm corrections were applied for multiple comparisons where appropriate. Homogeneity of variance was formally tested using Levene’s Absolute Test, and normality of residuals was assessed for all parametric analyses. When assumptions of normality or homogeneity of variance were violated, non-parametric alternatives were applied. Specifically, one-way Kruskal–Wallis tests replaced ANOVA for continuous data, and Kolmogorov–Smirnov tests were used for distributional and angular measures. Microglial dynamics within each post-implantation day were analyzed using repeated-measures ANOVA or equivalent non-parametric tests to account for multiple measurements from the same microglia. All post hoc comparisons were conducted with Bonferroni or Holm correction within the repeated-measures framework to control for multiple testing. These repeated-measures analyses explicitly account for correlation between observations from the same microglia across time and do not assume statistical independence of repeated measurements. Day was included as a fixed factor (in addition to angle, trial phase, distance, and/or activity as appropriate) in all models to account for temporal structure and injury-related variance, preserving the correlation structure across days and ensuring that within-day effects are not treated as statistically independent. However, day effects were treated as contextual variables and not interpreted as primary outcomes, as the study was designed to evaluate stimulation-dependent modulation of microglial behavior within distinct post-implantation states. Longitudinal effects across days were assessed using linear mixed-effects (LMEs) models for continuous measures, with microglia identity treated as a random effect to account for intra-subject correlation. When data were unbalanced or represented counts or proportions, generalized LMEs models (GLMMs) with a binomial distribution and logit link were applied. The choice of LME versus GLMM was determined by data type and residual distribution. These LME-based results supersede one-way ANOVA and Kruskal–Wallis tests, providing a framework that properly accounts for repeated measures across microglia and days. Violin plots ([60] Violin plots for Matlab) depict the mean as a horizontal line and error bars represent standard error unless otherwise specified. All non-parametric and mixed-effects analyses include multiple comparison correction and are explicitly linked to the corresponding figures and results.
Two-photon imaging in Cx3cr1GFP/jRGECO1a mice enabled simultaneous tracking of neuronal calcium activity and microglial dynamics during prolonged 10 Hz ICMS (1 h). Microglial processes traversed the full imaging volume and encountered neurons with diverse adaptation profiles, enabling unbiased interaction analysis. Microglia at volume edges were excluded to avoid sampling artifacts. Four distinct neuronal adaptation profiles were identified: (a) non-adapting neurons maintaining suprathreshold activity throughout 60 min stimulation, (b) adapting neurons showing progressive activity reduction but remaining above baseline, (c) baseline-adapting neurons returning to pre-stimulation activity levels during stimulation, and (d) depressed neurons exhibiting sub-baseline activity post-activation. Microglial processes dynamically responded to ICMS, extending toward stimulation sites and active neurons, with microglia–neuron contact frequency inversely correlating with neuronal adaptation magnitude. Mechanistic insights were further gained by comparing ICMS during the acute (3 h) and chronic (24–48 h) post-implantation responses, which revealed that microglial encapsulation of electrodes coincided with neuronal hypoactivity. Using cellular-resolution imaging and biphasic stimulation (2 nC/phase; within established safety thresholds [61]), we demonstrate that microglia may modulate ICMS-induced network activity. These findings challenge neuron-centric paradigms and support a model in which glia function as computational elements influencing stimulation efficacy.
3.1. Chronic microelectrode insertion drives and directs faster microglial process movementsPrior studies have shown that microglia extend processes toward newly implanted electrodes within the first few hours [6, 26]. To isolate the contribution of microglia to the neuronal response during ICMS, it was necessary to first characterize microglial behavior following chronic electrode implantation in the absence of stimulation (figure 1). All measurements in this section reflect pre-stimulation baselines, ensuring that observed behaviors represent chronic implantation effects alone and providing a reference for evaluating microglia–neuron interactions specific to ICMS.
When assessed cumulatively across days, microglial surveillance behavior, quantified as the extension-to-retraction ratio, remained stable (figure 1(d); GLMM, p= 0.700), indicating preservation of the overall balance between opposing process movements despite electrode implantation. In contrast, the total number of process movements per microglia exhibited a significant effect of Day (supplemental figure 1(a); LME marginal ANOVA, F = 9.8, p= 1.2 × 10⁻⁴), reflecting a progressive increase in overall motility following implantation. All within-day analyses were conducted using repeated-measures models that account for correlations between measurements from the same microglia and within the same animal, ensuring valid inference despite repeated sampling across days. Post hoc comparisons revealed a significant increase in total movements by Day 2 relative to Day 0 and Day 1 (GLMM pairwise tests: D0 vs D2 p = 2.5 × 10⁻⁵, D1 vs D2 p = 0.015), while the difference between Days 0 and 1 did not reach significance (p = 0.054). Repeated-measures corrections were applied to account for multiple process events originating from the same microglia. This day-specific deviation is consistent with an acute response to electrode insertion, potentially reflecting the combined influence of residual anesthesia and early inflammatory signaling associated with implantation [62–64]. Importantly, despite increased overall motility by Day 2, the extension-to-retraction ratio remained independent of microglial distance from the electrode (supplemental figure 1(d)), indicating that changes in movement frequency reflect a global injury-related response rather than spatially biased surveillance [31, 65]. Together, these analyses demonstrate that electrode implantation induces a time-dependent increase in microglial process activity without disrupting the long-term balance between extensions and retractions in surveilling microglia, with transient, day-specific deviations reflecting acute injury responses rather than sustained directional bias.
Instead, microglia behavior following electrode implantation is primarily expressed through changes in process movement speed. Using LMEs models that account for repeated measures within microglia, we found a significant main effect of Day on overall process speed (LME: F = 34.6, p= 2.0 × 10⁻¹² for extensions; F = 23.1, p= 4.0 × 10⁻⁹ for retractions), as well as a main effect of Type (extensions vs. retractions; F = 4.2, p= 0.040) and a Day × Type interaction (F = 4.3, p= 0.014), indicating that day-dependent modulation differs between extension and retraction velocities. Consistent with these results, mean extension speeds increased from Day 0 to Day 2 (Day 0: 0.73 ± 0.02 µm min−1, Day 1: 0.82 ± 0.02 µm min−1, Day 2: 0.89 ± 0.022 µm min−1), whereas retraction speeds showed a more rapid increase followed by a plateau (Day 0: 0.78 ± 0.022 µm min−1, Day 1: 0.94 ± 0.03 µm/min, Day 2: 0.93 ± 0.03 µm min−1) (figure 1(e)). Across all days, retractions occurred at slightly higher velocities than extensions, despite extensions being more frequent than retractions (supplemental figure 1(c)). In contrast to the strong temporal dependence, neither extension nor retraction velocities were significantly associated with distance from the electrode insertion site (supplemental figure 1(e)), suggesting that speed changes reflect a global injury-related response rather than spatially graded targeting.
Having characterized the overall dynamics of microglial process movements post-implantation, we next examined the spatial orientation of these processes relative to the electrode to capture directional responses to injury (figure 2(a)). Microglia were grouped into three distance ranges (<150 µm, 150–300 µm, >300 µm) to capture clusters with preferential extension toward the implant, partial directional bias, or largely ramified morphology, consistent with prior characterizations of microglial responses to chronic implants [26]. Distinct behavioral changes were observed based on the distance of microglia from the electrode and directionality of process extensions relative to the electrode were quantified.
Microglia located within 150 µm of the electrode extended more frequently toward the electrode than microglia at greater distances (figure 2(b)). There was a significant main effect of Distance on extension distribution (LME main effect Distance p = 0.0043). Kolmogorov–Smirnov tests for distributional differences by distance yielded Near vs Mid p = 0.043, Near vs Far p = 0.0020, Mid vs Far p = 0.29. The polarity index also showed a significant main effect of Distance (LME main effect p = 0.0073) with stronger polarization in the <150 µm group. For directional analyses, we focused on extension events because retractions were generally oriented opposite to extensions and therefore largely mirrored extension orientation, contributing little independent information about directional bias (supplemental figures 2(a) and (b)). Directional targeting was quantified using a polarity index computed from extension angles (positive = toward electrode; negative = away; equation (3), supplemental figures 2(c) and (d)).
To formally assess directional bias while accounting for repeated measurements from individual microglia, we fitted a LMEs model with Distance as a fixed effect and MicrogliaID as a random effect. This analysis revealed a significant effect of distance on polarity (F = 5.5, p= 0.0073), with microglia in the Mid (150–300 µm) and Far (>300 µm) bins exhibiting significantly lower polarity than those in the Near (<150 µm) bin (figure 2(c); polarity index mean ± SEM: Near 0.216 ± 0.0643; Mid −0.053 ± 0.0647; Far −0.224 ± 0.1879). These results confirm that extensions of microglia within 150 µm are preferentially directed toward the electrode and that this directional bias is robust to repeated measures. Because these biases were observed at baseline, they likely reflect the local injury caused by electrode insertion rather than stimulation-driven targeting.
In contrast, for microglia within 150 µm of the electrode, a distributional shift in extension angles was detected on Day 1 relative to Day 0 (Kolmogorov–Smirnov test, p = 0.034), indicating a transient bias in process orientation. However, a LMEs model accounting for repeated measurements within microglia and animals did not detect a significant main effect of Day on the polarity index (LME, p = 0.15). Thus, while directional shifts are evident at the distributional level, they are not robust when controlling for within-cell and within-animal dependence. Taken together, these results indicate that the spatial bias of extensions toward the electrode is a robust feature of the local injury response, whereas temporal dynamics of extension orientation are minimal.
Interestingly, the number of extensions toward the electrode for microglia within 150 µm peaked on Day 1 (figure 2(e), n = 18, 10, and 11 microglia; polarity index: Day 0: 0.22 ± 0.06, Day 1: 0.45 ± 0.11, Day 2: 0.32 ± 0.10). These results suggest that the distribution of microglia extensions toward the electrode is influenced by the injury response, though additional factors such as surrounding tissue and cellular behavior may also modulate microglial process orientation.
3.2. Prolonged low frequency ICMS does not affect microglia morphology, but modulates and directs process extensionsPrevious studies suggested that low-frequency electrical stimulation can attenuate microglial activation post-stimulation, potentially mitigating inflammatory consequences [14, 66, 67]. However, whether stimulation alters microglial inflammatory state during ongoing ICMS, particularly in the context of electrode-induced injury, remains unresolved. Microglial morphology provides a direct readout of activation state, with homeostatic microglia exhibiting highly ramified processes and activated microglia adopting a less branched, amoeboid morphology [15, 26, 68]. To assess whether prolonged low-frequency ICMS alters microglial morphology during stimulation, we quantified directionality- and transitional-indices (D- and T-indices) [59] (figure 3(b)), which capture process orientation and length dynamics as a function of distance from the electrode.
Because microglial behavior evolves rapidly following electrode implantation due to injury-induced inflammation and tissue remodeling [57], post-implantation day was treated as a biologically meaningful contextual variable rather than a nuisance factor. Critically, our primary hypothesis tested whether ICMS at a lower phase modulates microglial morphology, whereas distance- and day-specific analyses were performed to contextualize implantation-associated spatial heterogeneity. LMEs models incorporating Day, Time, and their interaction revealed no significant effects of ICMS on microglial process directionality or length across the population (figures 3(c) and (d)). Specifically, D-index showed no significant main effects of Day or Time, nor a Day × Time interaction (LME: Day p= 0.81, Time p = 0.33, Day × Time p = 0.93), indicating that 1 h of 10 Hz ICMS does not produce sustained changes in microglial process orientation. Similarly, T-index exhibited no significant effects of Day, Time, or their interaction (T-index LME: Day p = 0.65, Time p = 0.40, Day × Time p = 0.90), demonstrating that ICMS does not significantly modulate microglial process length relative to the electrode.
In contrast, supplemental analyses addressed distinct questions related to spatial and temporal heterogeneity following implantation rather than the presence of stimulation. Supplemental figures 3(a) and (c) examined whether D- and T-indices vary across post-implantation days independent of stimulation, whereas supplemental figures 3(b) and (d) test for distance-dependent effects within individual days. Within these focused analyses, transient and spatially restricted effects were observed. On Day 1, microglia located closer to the electrode exhibited lower D- and T-indices (supplemental figures 3(b) and (d); D-Index: p = 0.046; T-Index: 150–300: p = 0.0034, >300: p = 0.0007). This pattern is consistent with prior studies indicating that microglia near implanted electrodes undergo morphological changes in response to insertion-related tissue damage [26]. A transient decrease in T-index was also observed on Day 1 between stimulation onset and offset for microglia located >300 µm from the electrode (supplemental figure 3(f); p = 0.0084). These effects were not sustained across days and did not emerge as significant ICMS effects when analyzed using mixed-effects models that account for repeated measures across cells and animals.
Day 0 measurements may additionally be influenced by residual anesthesia, which can transiently suppress microglial motility and obscure early post-implantation effects. Taken together, these analyses demonstrate that while implantation induces transient, distance-dependent morphological heterogeneity, prolonged low-frequency ICMS does not drive consistent or population-level changes in the morphology of surveilling microglia. This interpretation aligns with prior observations that evoked and spontaneous neural activity near implanted electrodes is initially elevated post-implantation but diminishes over subsequent days due to inflammatory processes, with only partial recovery [31, 65].
Since ICMS did not produce consistent or sustained changes in the static measure of microglial morphology, we further examined whether stimulation modulated microglial process dynamics. Here, Phase is defined relative to stimulation timing, with Pre corresponding to the pre-stimulation baseline, Early, Mid, and Late corresponding to consecutive 20 min segments during the 1 h 10 Hz ICMS period, and Post corresponding to the period immediately following stimulation offset. LMEs modeling revealed that both extension and retraction speeds were significantly modulated in a manner dependent on post-implantation day and stimulation phase, despite the absence of accompanying changes in morphology-based activation indices.
For process extensions, the LMEs model with identified significant main effects of Day (p = 4.1 × 10⁻¹⁵) and Phase (p = 3.0 × 10⁻²⁶), as well as a strong Day × Phase interaction (p = 1.4 × 10−55), indicating that stimulation-related changes in extension speed were contingent on the evolving post-implantation inflammatory environment. Post hoc paired comparisons were conducted with Holm correction to control for multiple testing, demonstrating robust phase-specific modulation across all days, with specific phase differences within each day remaining significant after adjustment. On Day 0, extension speeds differed significantly between Pre vs Early (p = 2.6 × 10−04), Pre vs Mid (p = 8.9 × 10⁻¹⁶), Pre vs Post (p = 5.5 × 10−06), Early vs Mid (p = 8.2 × 10−06), Early vs Late (p = 7.9 × 10−04), Mid vs Late (p = 1.1 × 10⁻¹⁴), Mid vs Post (p = 3.2 × 10−04), and Late vs Post (p = 2.7 × 10−05). A similar pattern was observed on Day 1, with significant differences for Pre vs Early (p = 1.8 × 10⁻¹⁵), Pre vs Mid (p = 3.31 × 10−03), Pre vs Post (p = 1.3 × 10⁻¹¹), Early vs Mid (p = 2.2 × 10−07), Early vs Late (p = 1.6 × 10⁻¹⁶), Mid vs Late (p = 1.1 × 10−03), Mid vs Post (p = 1.8 × 10−04), and Late vs Post (p = 1.5 × 10⁻¹²). On Day 2, extension speeds were significantly reduced following stimulation offset, with differences observed for Pre vs Early (p = 3.4 × 10−06), Pre vs Mid (p = 3.6 × 10−05), Early vs Mid (p = 9.6 × 10⁻¹⁸), Early vs Late (p = 2.3 × 10−04), Early vs Post (p = 2.3 × 10−02), Mid vs Late (p = 5.9 × 10−08), and Mid vs Post (p = 3.2 × 10⁻¹⁰). Collectively, these results indicate that ICMS may be associated with changes in the dynamics of microglia process extensions. The most pronounced and consistent reductions emerging on Day 2 suggest that, when acute injury-related responses have partially stabilized, ICMS offset may suppress microglia extensions.
Retraction dynamics exhibited a complementary but temporally distinct pattern. LMEs modeling revealed significant main effects of Day (p = 4.5 × 10⁻¹²) and Phase (p = 2.0 × 10⁻¹⁷), as well as a significant Day × Phase interaction (p = 2.2 × 10⁻³³), indicating that retraction speed modulation was similarly dependent on both stimulation timing and post-implantation state. On Day 0, retraction speeds differed significantly between Pre vs Early (p = 5.9 × 10−08), Pre vs Mid (p = 3.7 × 10⁻¹¹), Pre vs Post (p = 4.3 × 10−09), Early vs Late (p = 1.1 × 10−06), Mid vs Late (p = 1.3 × 10−09), and Late vs Post (p = 9.5 × 10−08), all confirmed with Holm correction to control for multiple comparisons, consistent with heightened microglial motility during the acute post-implantation phase. On Day 1, significant differences persisted for Pre vs Early (p = 1.1 × 10−07), Pre vs Post (p = 2.1 × 10−03), Early vs Mid (p = 7.5 × 10−05), Early vs Late (p = 9.7 × 10⁻¹⁰), and Late vs Post (p = 6.9 × 10−05). By Day 2, retraction-related effects were more restricted, with significant differences observed for Pre vs Mid (p = 2.9 × 10−06), Early vs Mid (p = 3.4 × 10−07), Mid vs Late (p = 7.1 × 10−05), and Mid vs Post (p = 4.71 × 10−08). Importantly, these robust, phase-specific changes in process motility occurred in the absence of sustained changes in microglial morphology, as quantified by D- and T-indices. Together with the transient, distance-dependent effects during early post-implantation periods (supplemental figure 3), these findings support a model in which low-frequency ICMS interacts with the evolving inflammatory milieu to bias microglial process dynamics, rather than driving persistent morphological activation. This dissociation between morphology and motility suggests that microglia remain structurally homeostatic while dynamically responsive to stimulation offset and post-implantation state. As such, further investigation into the effects of ICMS on the dynamic responses of surrounding microglia were conducted with environment features used to contextualize the results.
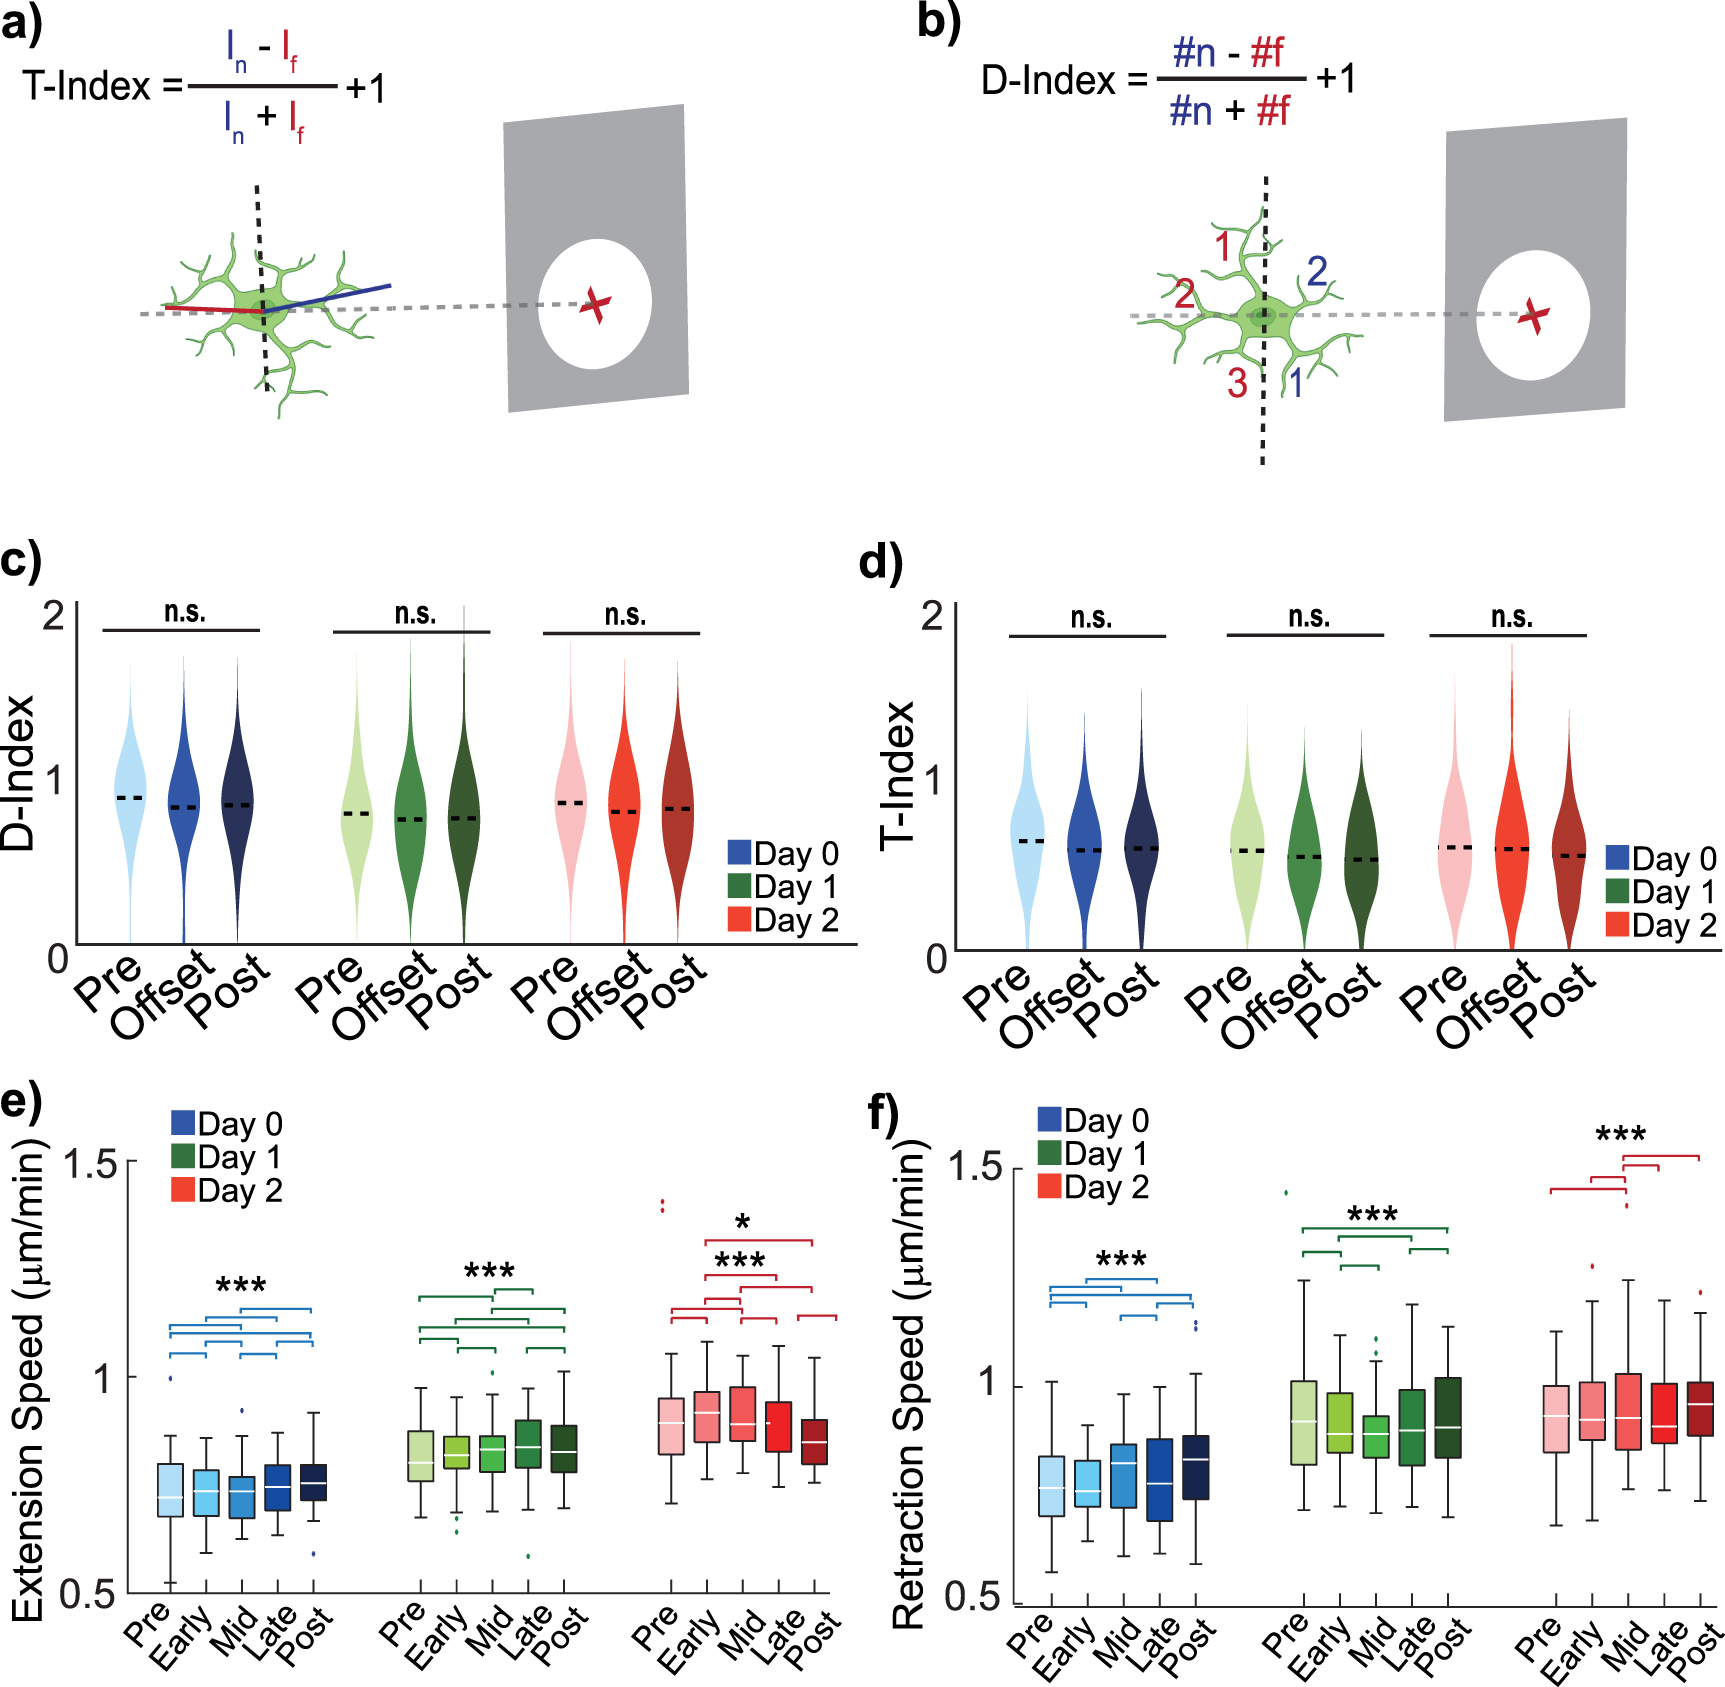
Given that stimulation demonstrated some effects on microglia process behavior, we further investigated whether these behavioral changes might be related to microglia extensions in relation to the site of stimulation. On Day 0, stimulation onset transiently increased extensions toward the electrode without significantly altering polarity (figure 4(a)). For both Day 1 and 2, microglial extensions were already predominantly directed toward the electrode site, and ICMS did not further shift their distribution or polarity (figures 4(b) and (c)). Consistent with figure 2, stimulation-related changes in microglial orientation were not significant at the population level when accounting for repeated measures, despite transient distributional shifts observed on Day 1. Retractions largely opposed extensions and exhibited no directional changes (supplemental figures 4(a)–(c)). These findings suggest that microglia respond to the combination of injury and electrical stimulation, but ICMS alone does not consistently drive process targeting toward the electrode. Neuron-mediated signaling, such as fractalkine release, may also contribute to the observed patterns given the higher neuronal activity near the electrode.
Figure 4. Microglial process orientation toward the electrode does not differ across days during 10 Hz ICMS. (a) On Day 0, the onset of ICMS drives increased microglia processes within 150 μm of the electrode to extend more frequently toward the electrode (Kolmogorov–Smirnov, p = 0.026), but does not significantly increase polarization (repeated measures ANOVA, p = 0.86). (N = 39 microglia, n = 194, 174, 187, 187, 165 process extensions). (b) By Day 1, microglia process extensions within 150 µm are not significantly driven toward the electrode, nor polarized by stimulation (N = 38 microglia, n = 106, 108, 96, 96, 73 process extensions, Kolmogorov–Smirnov, p = 0.32 and repeated measures ANOVA, p = 0.23). (c) Similarly, on Day 2, ICMS does not significantly drive microglia extensions toward the electrode, nor affect polarization (N = 37 microglia, n = 132, 71, 88, 99, 93 process extensions, Kolmogorov–Smirnov, p > 0.21 and repeated measures ANOVA, p = 0.29).
Download figure:
Comments (0)