
Remember me

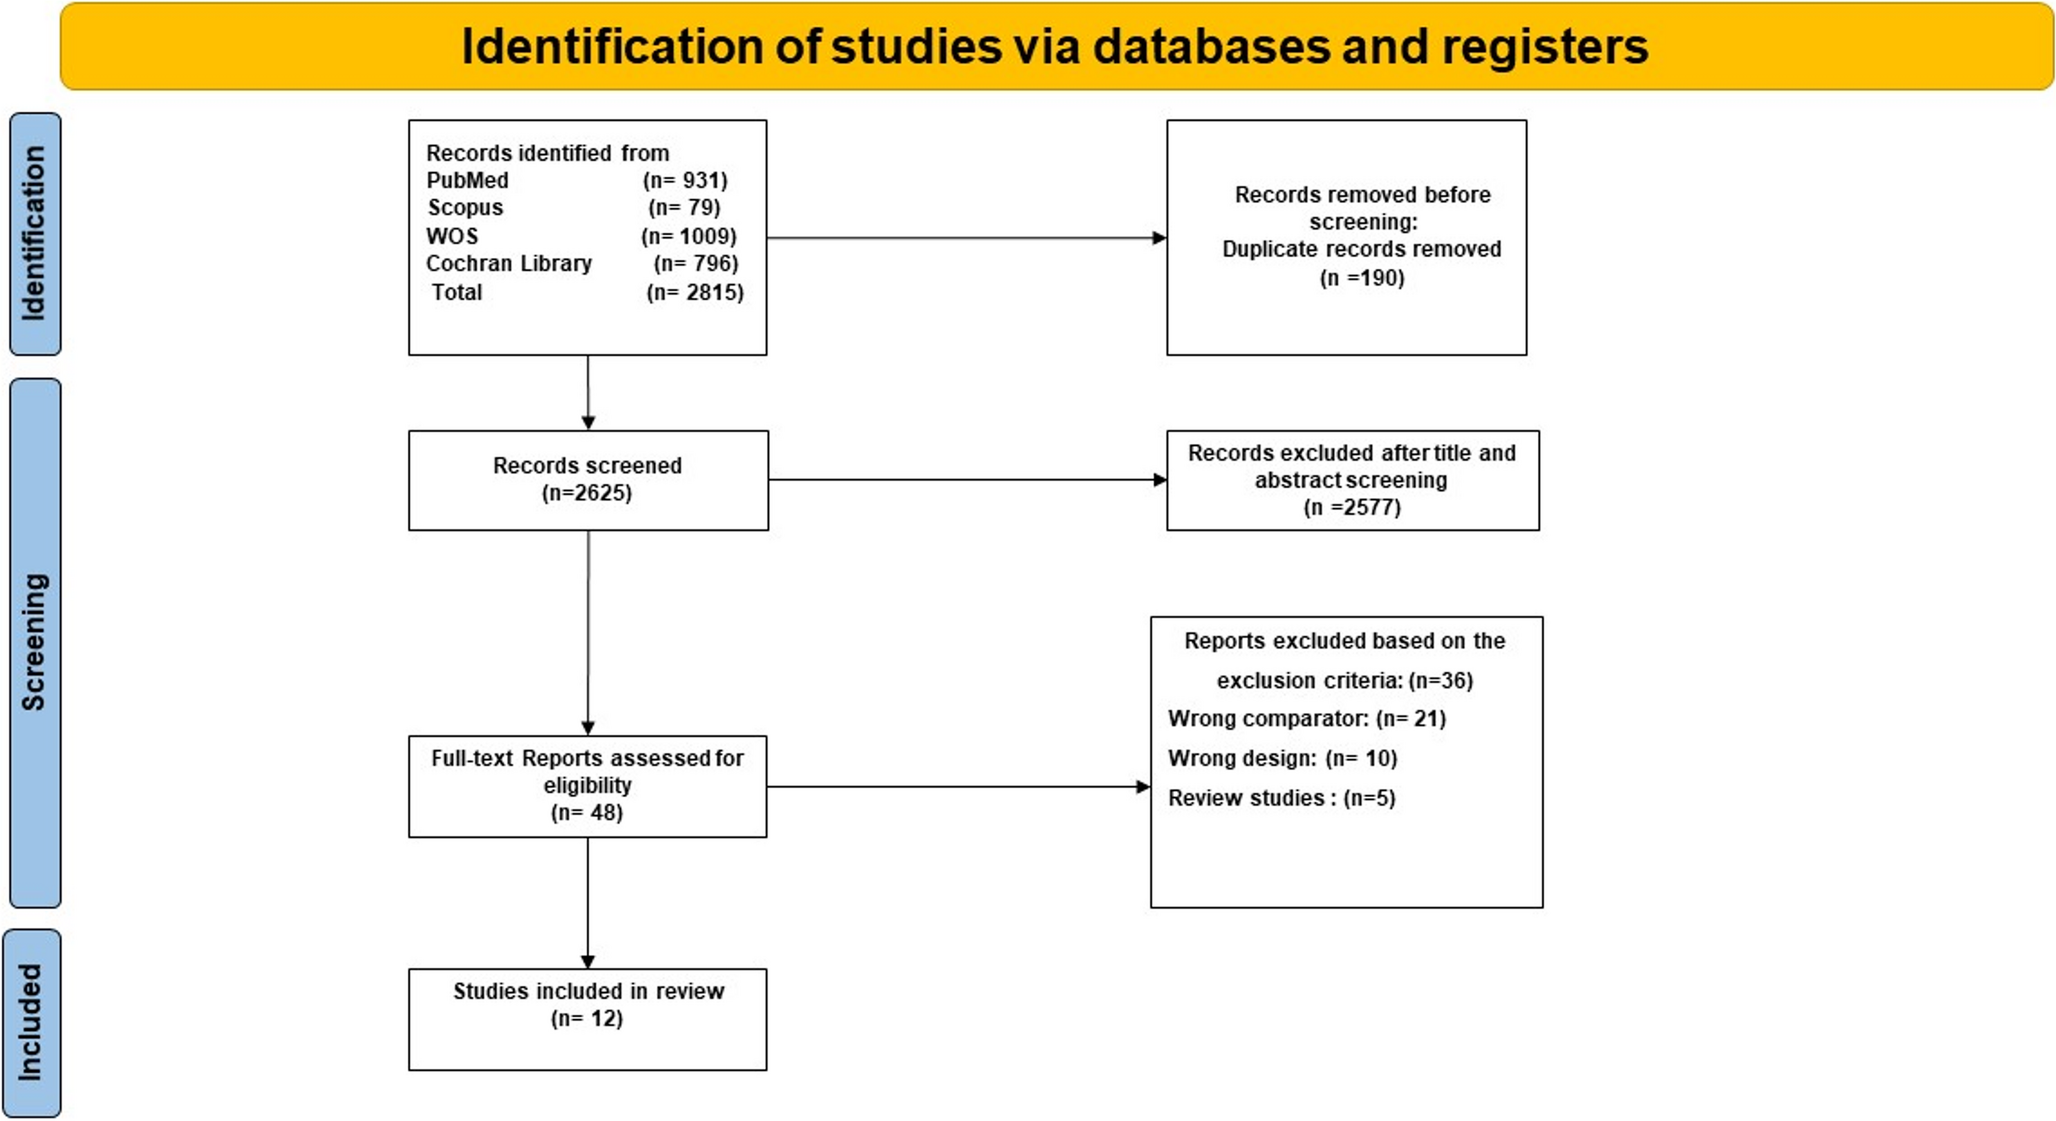


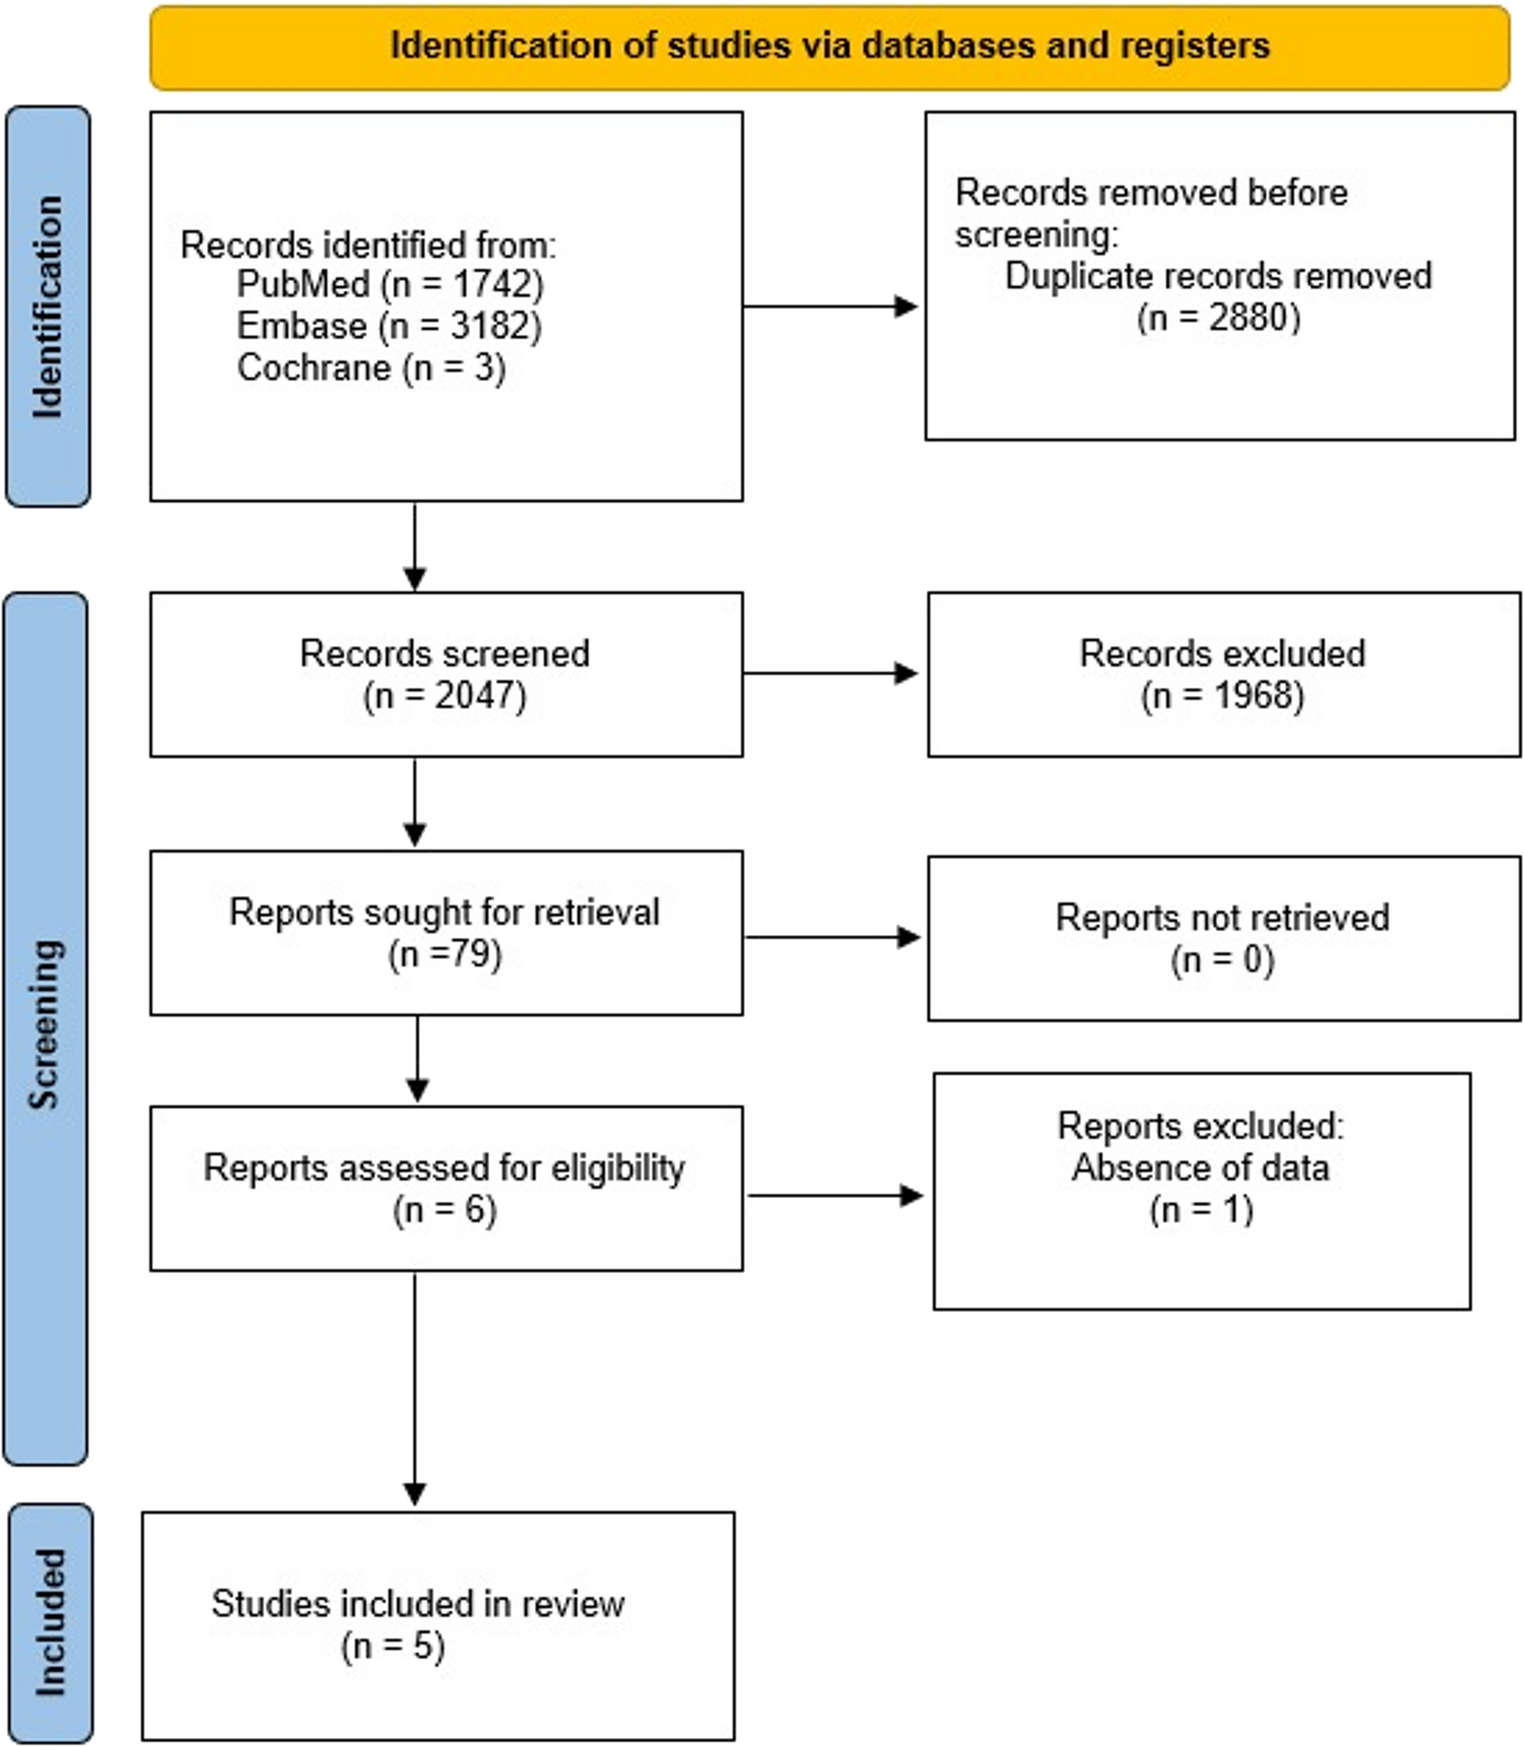


Five studies met the inclusion criteria. Definitions of response varied, but most classified non-responders as < 50% EWL.
Non-responders were defined as patients presenting with insufficient primary weight loss (< 50% excess weight loss, EWL) or exhibiting weight regain, according to study-specific definitions. Responders were defined as those achieving satisfactory weight loss without significant regain during follow-up. Peptide YY (PYY) was evaluated as fasting PYY and/or PYY area under the curve (AUC) across studies. All studies used standardized mixed-meal tolerance tests (MMTT) for PYY AUC determination. Regarding the hormone forms, four studies [5, 6, 8, 11] measured Total PYY using ELISA or Multiplex assays, while one study [9] specifically quantified the active form (PYY 3–36) using radioimmunoassay (RIA). All studies utilized standardized mixed-meal tolerance tests (MMTT) or oral glucose tolerance tests (OGTT) for postprandial assessment.
A total of 183 patients from five observational studies were included, comprising 94 non-responders and 89 responders with complete demographic data. The pooled characteristics are summarized in Table 1.
Table 1 Main characteristics of the included studiesRegarding the stimulation protocols, the caloric load of the test meals was consistent across the included studies, ranging from 300 to 400 kcal (see Table 1). Specifically, Lampropoulos et al., Nymo et al., and Sima et al. utilized a 300 kcal load (via liquid mixed meal or 75 g glucose), while Bojsen-Møller et al. and Dirksen et al. employed solid mixed meals containing approximately 364 kcal and 400 kcal, respectively.
Among non-responders, the mean age was 45.9 years (range 34.3–52.5; SD 7.4), with a predominance of females (81.2%). Mean BMI was 46.5 kg/m² (range 42.4–50.4; SD 3.0). The average time from surgery to study assessment was 4.3 years (range 1.6–8.9; SD 2.6). Basal metabolic rate (BMR) was reported in three studies, with a pooled mean of 1,518.2 kcal/day (SD 211.6).
Within responders, the mean age was 44.8 years (range 34.3–52.5; SD 7.3), with females comprising 80.5% of the sample. Mean BMI was 44.6 kg/m² (range 41.4–54.8; SD 3.7). The average time from surgery was 4.4 years (range 1.6–8.9; SD 2.7). BMR, reported in three studies, showed a pooled mean of 1,496.3 kcal/day (SD 201.3).
Fasting PYYRegarding the measure of fasting PPY there was no significant difference between groups (MD 1.71 pg/mL; 95% CI − 5.22 to 8.63; I² = 0%; p = 0.63) (Fig. 2).
Fig. 2 Postprandial PYY AUC
Four studies reported PYY AUC after MMTT. No significant difference was found (MD 53.16 pg·min/mL; 95% CI − 1726.29 to 1832.61; I² = 0%; p = 0.95) (Fig. 3).
Fig. 3
Postprandial PYY areas under the curve
GLP-1 and PYYBojsen-Møller et al. [5] reported similar fasting GLP-1 concentrations between non-responders and responders, with comparable postprandial responses after both standardized breakfast and ad libitum lunch. Under octreotide, postprandial GLP-1 tended to be higher in responders during the ad libitum meal. Dirksen et al. [9] found greater postprandial GLP-1 release in responders, whereas Nymo et al. [6] identified positive correlations between postprandial GLP-1 and PYY with total weight loss (%TWL) and excess weight loss (%EWL). Pereira et al. [10] and Sima et al. [11] found no significant differences in fasting or postprandial GLP-1 and PYY between groups but confirmed marked postprandial elevations in all participants.
Ghrelin and CCKIn Bojsen-Møller et al. [5], fasting ghrelin was lower in non-responders, but postprandial suppression was similar between groups; octreotide reduced ghrelin similarly, with a trend toward greater reduction in those with suboptimal weight loss. Dirksen et al. [9] observed greater ghrelin suppression in responders, while non-responders showed lower fasting concentrations. Sima et al. [11] reported no fasting differences but noted that responders maintained ghrelin below baseline for longer. Regarding CCK, Bojsen-Møller et al. [5] found higher postprandial responses in non-responders during the ad libitum meal, consistent with Dirksen et al. [9], who also reported greater CCK release in poor responders.
Other Gut PeptidesPereira et al. [10] demonstrated that GIP and GLP-2 increased significantly postprandially in both groups, with correlations between GIP and lean mass, and negative correlations with fat percentage. Sima et al. [11] confirmed postprandial elevations in GIP without between-group differences.
Leptin and Ghrelin/Leptin RatioSima et al. [11] showed that fat mass–adjusted leptin was consistently higher in non-responders at fasting and throughout the oral glucose tolerance test, while responders had a higher fasting and early postprandial ghrelin/leptin ratio.
Appetite AssessmentBojsen-Møller et al. [5] found lower satiety and less hunger suppression after breakfast in non-responders. Dirksen et al. [9] reported a progressive reduction in pre-meal hunger (level of hunger just prior to food intake) across multiple meals only in RYGB responders. Nymo et al. [6] demonstrated that both fasting and postprandial desire-to-eat (DTE) and prospective food consumption (PFC) scores were significant predictors of %TWL and %EWL, independent of GLP-1 and PYY levels.
Energy Expenditure and Metabolic ParametersDirksen et al. [9] reported higher resting energy expenditure (REE) in non-responders, although the difference disappeared after adjusting for body composition. Bojsen-Møller et al. [5] found no significant differences in basal energy expenditure or respiratory exchange ratio between groups. Minor differences in fasting glucose, C-peptide, and glucagon were observed, but postprandial responses were largely comparable.
Pharmacological ModulationBojsen-Møller et al. [5] demonstrated that octreotide suppressed GLP-1, PYY, CCK, and ghrelin to a similar extent in both responders and non-responders, indicating preserved hormonal responsiveness to somatostatin analogues regardless of weight loss outcome.
Technical AspectsAcross the included studies, the Roux-en-Y gastric bypass procedures demonstrated notable variability in technical aspects, which may influence hormonal and weight loss outcomes. In the study by Sima et al. [11], surgery consisted of creating a small gastric pouch with an alimentary limb length of 70 cm, and a biliopancreatic limb of 30 cm. Pereira et al. [10] reported performing a standard RYGB with a gastric pouch of 5 cm from the GE junction, a 150 cm alimentary limb, and a 100 cm biliopancreatic limb, without the use of a restrictive ring. In Nymo et al. [6], the gastric pouch volume was longer with 7 cm from the GE junction, anastomoses were constructed without a ring, and limb lengths were standardized at 100–150 cm for the alimentary limb depending on BMI, and a 40–60 cm for the biliopancreatic limb.
Lampropoulos et al. [8] described a distal bypass, with a 40 ml gastric pouch, a 400 cm alimentary limb, and a 100 cm common limb. Finally, in Dirksen et al. [9] and Bojsen-Møller et al. [5], gastric pouch and limb length were not reported.
Risk of biasIn the five studies reviewed, the overall risk of bias ranged from moderate to serious. The domain most often driving these judgments was confounding, influenced not only by differences in current BMI, body composition, time since surgery, and medication use, but also by other unadjusted factors, including sex distribution, current age, history of diabetes or insulin resistance, habitual dietary intake and eating behaviors, physical activity levels, potential genetic or ethnic influences, use of nutritional supplements, and differences in nutritional status (e.g., deficiencies in iron, vitamin D, or protein). Participant selection presented a moderate risk: participants were typically identified from hospital records or earlier cohorts, and eligibility often depended on weight loss patterns and willingness to participate, both of which may introduce selection bias. Exposure or intervention classification was generally precise and low risk, as were deviations from intended interventions, given that the exposures were fixed. Moderate risk was more common in the domains of missing data and outcome measurement, often due to incomplete reporting of sample attrition or variability in hormonal assay performance. Selective reporting was considered low risk when prior trial registration was evident, but moderate otherwise, particularly when multiple exploratory outcomes were reported without a predefined analysis plan. Taken together, these findings indicate that the evidence base should be interpreted with caution. Figure 4 shows a graphic representation of the risk of bias analysis.
Fig. 4
Comments (0)