Donors
Brain donors were used from the Boston University Understanding Neurologic Injury and Traumatic Encephalopathy (UNITE) Brain Bank. Neuropathologic evaluations were performed blinded to clinical information and adjudicated by board-certified neuropathologists (T.D.S, V.A., A.C.M). Evaluations included Thal stage, CERAD score, and Braak stage, pTDP43, α-synuclein, hippocampal sclerosis, and arteriolosclerosis [6, 20, 24, 25, 34]. To focus on the changes specific to CTE type pTau pathology that might be independent of the contributions from other comorbid diseases factors, donors with neuropathologically diagnosed Alzheimer’s disease (AD), motor neuron disease (MND), fronto-temporal lobar degeneration (FTLD), or neocortical Lewy body disease (LBD) were excluded from the study using established criteria [5, 15, 16, 18, 20, 24, 25, 31]. Cases with a CERAD score > 1 were also excluded [24]. A total of 207 cases with neuropathologically confirmed CTE were included in the analytic cohort. CTE cases were classified as low (n = 92) or high (n = 115) stage CTE based on recent consensus criteria [5, 18]. Additionally, 75 control cases were also included. These control cases had a history of RHI exposure, but did not have a diagnostic CTE lesion or any other comorbid neuropathologic disease. All included cases were male. Controls were included in this study to act as an anchor for biomarker distribution and a baseline reference, or a “zero” point while setting SuStaIn parameters. Therefore, only cases that had either none or extremely limited pTau pathology were selected. Institutional review board approval was obtained from Boston University School of Medicine, VA Boston Healthcare System, and VA Bedford Healthcare System. Written informed consent was obtained from the donor’s next of kin. To assess clinical symptoms and athletic histories, donor’s next of kin completed online questionnaires and were interviewed as previously described elsewhere [22, 23, 33]. The degree and duration of contact sports exposure was captured as total “years of RHI” which represented the number of years playing any contact sport. Additionally, sports-specific metrics were also captured. For the current study, in addition to the total years of RHI, subanalyses focusing on “years of football” were used to evaluate sports-specific changes. Table 1 summarizes demographic characteristics of the cohort. Functional ability was assessed using the Functional Activities Questionnaire (FAQ) [28].
Table 1 Cohort demographics
Digital pathology
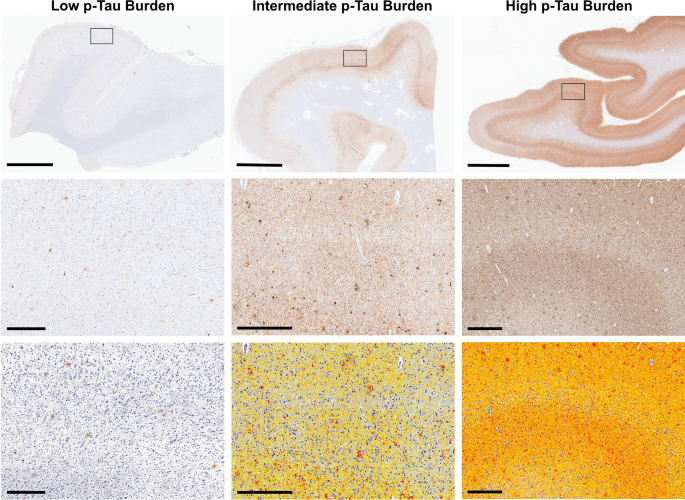
Tissue isolation and staining: For every donor, tissue blocks were harvested from the following 18 tissue regions: olfactory bulb, superior frontal cortex (Brodmann area (BA) 8,9), dorsolateral frontal cortex (BA 45,46), inferior frontal cortex (BA 10,11,12), motor cortex (BA 4,3,2,1), inferior parietal cortex (BA 39,40), anterior temporal cortex (BA 38), superior temporal cortex (BA 20,21,22), insular cortex, calcarine cortex (BA 17,18), hippocampus at the level of the lateral geniculate, amygdala with entorhinal cortex (BA 28), caudate–putamen–accumbens, globus pallidus–substantia innominate, thalamus with mammillary body, cerebellum with dentate nucleus, upper pons at the level of the locus coeruleus, and pons with the substantia nigra. Tissue was processed, stained for pTau (Invitrogen, Clone AT8, Cat# MN120), amyloid beta (BioLegend, Clone 4G8, Cat# 800,701), pTDP43 (Cosmobio, polyclonal, Cat# TIP-PTD-P07), α-synuclein (Millipore, polyclonal, Cat# AB5038P), LHE (Luxol Fast Blue Cat# 212,171,000, Thermo Scientific; Hematoxylin 1 Cat# 7221, Epredia; Eosin-Y Cat# 7111, Epredia), and Bielschowsky silver stain (Cat# 93–4718, STREM Catalog) in select regions, and digitized as previously described [23]. Slides were digitized using an Aperio GT450 digital slide scanner [11].
Image processing: To quantify the burden of pTau pathology, the AT8 stained digital images were imported into Indica Laboratory’s HALO for quantification. Images were then subjected to region annotation and pTau quantification. Using a HALO AI algorithm, gray matter was automatically annotated using previously described methods [11]. For non-cortical structures such as the hippocampus, amygdala, striatum, globus pallidus, thalamus, cerebellum, and brain stem, annotations to regions of interest were drawn by hand by an expert observer and verified by a neuropathologist. After segmentation, there were 26 total tissue regions that were identified and segmented for each case. Those regions were gray matter from the superior frontal cortex, dorsolateral frontal cortex, inferior frontal cortex, motor cortex, inferior parietal cortex, anterior temporal cortex, superior temporal cortex, insular cortex, calcarine cortex, hippocampal CA1, CA2&3, and CA4, amygdala, entorhinal cortex, caudate, putamen, nucleus accumbens, globus pallidus, substantia innominata, thalamus, mammillary body, cerebral dentate, olfactory bulb, substantia nigra, and the locus coeruleus. After regions were annotated, an AI tool to count the number of AT8-positive cells was then used to assess overall AT8 density across all regions as previously described [11]. The final AT8 count was then standardized to the area of the annotation for a final density measurement AT8+ cells/mm2. To examine differences in regional changes, all frontal cortex regions were averaged together to create a “Frontal” pTau burden variable similar to previous studies [4]. Additionally, all hippocampal regions were averaged together to create a “hippocampal” pTau burden variable. Frontal pTau was then divided by hippocampal tau to create a ratio to examine for possible cortical-sparing variants of CTE [2]. Values over 1 suggested more pTau in the frontal cortex, while values under 1 suggested more pTau in the hippocampus. Last, a final pTau burden measure was created by averaging all the cortical AT8 density measures together to create a “Mean Cortical Tau” variable, which was used to further examine cortical-sparing (CS) CTE changes.
SuStaIn analyses
AT8+ cell density preprocessing: A square-root transform was applied to reduce AT8+ cell density skewness. Next, values were z-score transformed using the mean and standard deviation of the controls, such that the control population had a mean 0 and standard deviation 1. Normalizing density values to controls ensures that score changes represented predicted disease progression rather than normal variation. To ensure numerical stability and model convergence, z-scores were re-scaled to the range 0–10. As each region could demonstrate highly different ranges of pTau based on disease specificity (i.e., DLFC is highly affected and has a larger range of values while the calcarine cortex does not), re-scaling to a 0–10 range for each density value allowed easier comparison within the SuStaIn algorithm. This method did not change in distribution within each regional density value. Average pTau densities for each region and pathological group are present in Supplemental Table 1.
Running SuStaIn: SuStaIn was implemented as previously described [38]. All donors had complete region data across all measures. Control cases were included to be an anchor point and act as a baseline where predicted pathology would start. Because the SuStaIn piecewise linear z-score model requires pre-specified z-score limits to define predicted disease progression stages, we determined region-specific thresholds using quantiles [30th, 60th, and 90th percentile]. Thresholds were estimated separately for each region to account for different scales of density scores. If a density value did not reach the next severity level, the corresponding z-score threshold was set to 0, indicating that no further thresholds were needed. The maximum z-score reached at the end of the progression was set as the 97th percentile of the cohort. Within the SuStaIn framework, biomarker score uncertainty was assumed to be Gaussian around each input data point.
Models with 1 to 6 subtypes were fitted. The optimal number of subtypes was determined by comparing model likelihoods across the different subtype solutions using internal cross-validation. This process involved varying tests to train data splits for each subtype, with model generalizability evaluated using the test set. The cross-validation information criterion (CVIC) was then considered for each of the 6 models as a way to compensate for the tendency of SuStaIn to overfit by splitting into more subtypes. The Markov Chain Monte Carlo likelihood trace was also monitored through progression reordering iterations to ensure stability during optimization. Based on these metrics, a 3-subtype solution was determined optimal. A Subtype 0 (control) was also included as a quality-control step to verify correct subtype calling of samples with minimal or no pathology.
Following model fitting, each case was assigned a probability of belonging to each subtype and stage based on the likelihood of the observed AT8+ cell density data. Using the built-in functions in SuStaIn, each donor was assigned to a stage and subtype by selecting the highest probability subtype and stage. While subtypes represented different patterns of pTau burden, stages represent incremental increases in disease along that course. Lower stages have minimal pathology in only a few scattered regions, while higher stages have more pathology in more regions. Greater deposition in a given region or the appearance of pathology in a new region will result in an increase of stage. All analyses were performed with python 3.11.5.
Genotyping
Genotyping for TMEM106B rs3173615 variant and APOE alleles was performed as previously described [11]. Briefly, DNA was extracted from fresh-frozen tissue using Promega Maxwell RCS Tissue DNA Kit (AS1610). Real-time PCR (rtPCR) was used to determine genotypes. Three genotypes were assayed for TMEM106B: GG, GC, CC. For APOE, rtPCR was performed to identify single-nucleotide polymorphisms for rs429358 and rs7412 to identify APOE genotypes.
Statistics
Chi-square statistical tests were used to determine enrichment of copathologies, genotype differences, type of sport played, CS CTE, and cases under/over a frontal/hippocampal pTau ratio of 0.1 between each SuStaIn subtype. Linear regression analyses were performed to measure the correlation between each SuStaIn stage (measure of predicted disease progression within each subtype) and AT8 density in respective regions. To measure the overall burden of AT8, the ratio of pTau between the frontal and hippocampal regions, overall mean cortical tau burden, and demographic variables, one-way ANOVAs with a Tukey post-hoc test were used. ANCOVA was used to control for age at death when assessing pTau regional ratios. For demographic measures, statistics were only calculated comparing the 3 subtypes against each other and not including the control subtype. A receiver operator characteristic curve was used to assess possible cutoff points for the frontal/hippocampal pTau ratio ability to predict Subtype 1 or 2. Youden’s index was used to determine optimal values. Finally, multiple linear regression analyses were performed to measure the correlation between SuStaIn stages and FAQ score. Age at death was included in the regression to account for age-related changes.



Comments (0)