
Remember me

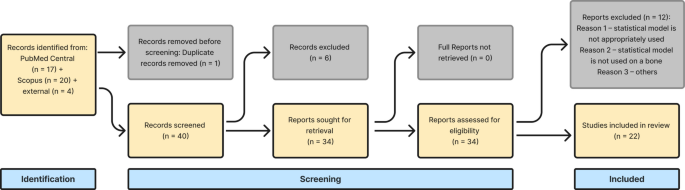


The four databases search gave back fifty-two articles after duplicates removing. In addition, three articles were selected through manual research examining the references of the eligible articles. Each article was evaluated for title and abstract and twenty-eight articles were excluded since they did not satisfy the inclusion criteria. A full text review of the twenty-seven selected articles was made and four more articles were excluded. Finally, twenty-three eligible articles were identified out of the one hundred and twenty-one obtained with the research. The flowchart of the paper selection process was shown in Fig. 1.
Fig. 1
Flow diagram following the PRISMA statement for systematic review. DXA: dual X-ray absorptiometry. CBCT: cone beam computed tomography
The twenty-three articles included in the current systematic review were published between 2011 and 2025. Three of them included males and females [11, 15,16,17], but most of them enrolled only postmenopausal women [6, 12, 18,19,20,21,22,23,24,25,26,27,28,29,30,31,32,33,34]. All the studies investigated mandibles, in addition five of them investigated maxillary bones [11, 15, 16, 20, 31].
Extracted data were shown in Table 2.
Table 2 Data extracted from the articles included in the current review. Refer to the Table 3 for the definition of CBCT parameters. F female, M male, NA not available. *: CTMI and MCW are two different ways to name the same parameter. CTCI, MCI and Klemetti Index are three different ways to name the same parameterMain Outcomes of the Studies Included in the ReviewThe papers selected showed high heterogeneity on CBCT parameters and anatomical subsites where these parameters were measured. The current study gathered twenty-six different parameters in twenty-three studies (Table 3).
Table 3 Cone beam computed tomography (CBCT) indices in the included studies. VOI volume of interestQuantitative radiomorphometric indices. Computed Tomography Mandibular Index (CTMI), Computed Tomography Index Inferior (CTI (I)), and Computed Tomography Index Superior (CTI (S)) emerged to be significantly correlated with BMD based on DXA at femoral neck and lumbar vertebrae, with lower values in osteoporotic patients than in the control group [6, 15, 28, 30, 35]. Moreover, in one study [22] CTMI, CTI (S), and CTI (I) were significantly lower in osteoporotic patients than osteopenic ones, whereas CTMI and CTI (S) were lower in osteopenic patients than in the control group. On the contrary, one paper 27 did not found any differences in CTMI between osteoporotic and normal BMD groups.
Qualitative index. Computed Tomography Cortical Index (CTCI), also called Mandibular Cortical Index (MCI) or Klemetti Index, showed statistically significant differences between osteoporotic and control groups. In details, the osteoporotic group scored higher number of Type 2 cortical feature, represented by endosteal margin semilunar defects or one to three layers of cortical endosteal residues, followed by Type 3 cortical feature, with major than three endosteal residues in the cortical layer and clear porosity. The control group scored higher number of Type 1 cortical feature corresponding to regular cortical endosteal margins [26,27,28].
Morphometric parameters for trabecular bone. Trabecular Thickness (Tb.Th), Trabecular Separation (Tb.S or Trabecular Spacing, Tb.Sp), Bone Surface Density (BS/TV), and Connectivity Density (CD) did not show statistically significant differences between osteoporotic and non-osteoporotic women in either of the two studies in which they were analyzed [12, 20]. On the other hand, Bone Volume Fraction (BV/TV) showed statistically significant differences in Bilgili et al. [12], whereas no significant difference was observed in Barngkgei et al. [20].
Regional indices. Three studies evaluated regional indices [21, 29, 34]. Differences between osteoporotic and normal BMD groups were found for Molar and Posterior indices in one study [21, 29, 34] and for Anterior, Molar, and Posterior indices in another one 29. In addition, Anterior, Molar, and Posterior indices showed statistically significant positive correlation with T-score and good positive predicting value for the identification of osteoporosis [29, 36].
Radiographic Density (RD). RD measurements emerged to be significantly lower in osteoporotic patients than in the control group, with higher Gray Scale values and T-values at all anatomical jawbone subsites in the control group [11, 16, 18, 19, 31]. In addition, a significant correlation was found between BMD and RD in different subsites of maxillary and mandibular bones [19, 31, 35]. Particularly, both the trabecular and the trabecular plus cortical bone segments at maxillary tuberosity and also the bone segment at both posterior maxilla and anterior mandible [11] were the areas that best predict the DXA T-score of femoral neck and lumbar spine [11, 31].
Other indices. Total Mandibular Volume and Cortical Bone Volume (BV, BV–Tb.BV) differed significantly between osteoporotic and normal BMD groups, as well as between osteopenic and normal BMD groups, in all anatomical areas except the molar one. These differences were characterized by an increase in trabecular bone volume and a reduction in cortical bone volume, in parallel with an overall decrease in BMD [33].
Height and width of mandibular bone were two indices that did not vary significantly and were not correlated with BMD changes in according to Albayati et al. and Springe et al. [18, 32].
Eventually, Fractal Dimension (FD) was significantly lower in osteoporotic patients than in the normal BMD group [15, 23].
Main outcomes of the studies included in the review were summarized in Table 4.
Table 4 Main outcomes of the studies included in the review. Refer to the Table 3 for the definition of CBCT parameters. DXA Dual X-ray Absorptiometry, CBCT Cone Beam Computed Tomography, BMD Body Mass Density, HU Hounsfield UnitTreated and Untreated Osteoporotic PatientsIn the only study that compared non-osteoporotic patients with osteoporotic patients on treatment, CTMI, also known as Mandibular Cortical Width (MCW), emerged to be significantly higher in the osteoporotic group [37]. This was different from results obtained comparing non-osteoporotic patients with untreated patients with osteoporosis. In such case, MCW showed low values in osteoporotic patients. Higher MCW values were correlated with higher DXA T-scores [26,27,28]. Moreover, Diniz-Freitas et al. 25 found a significant inverse correlation between MCW and the duration of treatment with oral bisphosphonates [37] The authors attributed this discrepancy to the cross-sectional design of the study and to the lack of pre-treatment MCW measurements. They also hypothesized that MCW increased in participants following treatment but remained low due to extremely low baseline MCW values prior to treatment.
Risk of BiasThe overall risk of bias was medium based on QUADAS-2 tool parameters (Table 5).
Table 5 Risk of bias of the included studies (QUADAS-2). ☺ϑ Low Risk. ☹Λ High Risk. ? Unclear Risk“High risk” of bias was mostly found in the applicability concerns domain for patient selection, since ten studies did not specify if selected patients have or have not taken medications that can affect bone metabolism [11, 12, 15, 19, 20, 23, 27, 31, 34, 35] and three studies included treated and untreated patients in the same sample without a clear partition [29, 30, 38] (Figs. 2 and 3).
Fig. 2
Pie chart depicting the overall percentages of low, unclear, and high risk of bias. Labels reporting showed risk; number of domains; percentage of domains
Fig. 3
Bar charts illustrating the distribution of risk of bias and applicability concerns within the QUADAS-2 domains
Furthermore, “unclear risk” was found in nearly all the studies within the risk of bias domain of index test and reference standard. That was because of the absence of a specified blinding design, so that the operator could be influenced in measuring the index test already knowing the result of the reference standard examination [6, 12, 15, 18,19,20, 22, 23, 25, 27,28,29,30,31,32,33,34].
Finally, nine articles were assessed as “unclear risk” due to the absence of a clear flow and timing in designing the study [11, 12, 16, 19, 25, 29, 31, 34,
Comments (0)