
Remember me

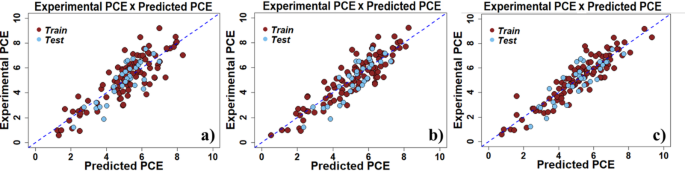



In the first phase of variable selection, the genetic algorithm generated 198 models, which were then reduced to the top 15 most promising candidates for further refinement. The best subsets method, together with new selection criteria, was then used to find three models, described by Eqs. 1, 2, 3. These PCE models satisfied the following conditions used to indicate a satisfactory QSPR model [47]: (i) n > 4 k’, where n is the number of structures in the training set and k’ is the number of descriptors in the model; (ii) all the descriptors are statistically significant (p-value < 0.05); (iii) all the descriptors have a correlation coefficient lower than a certain threshold (e.g., < 0.8).
Model 1 (M-1):
$$ \begin PCE = & ~41.463 + 1.463~ATSC4e - 0.121~ATSC4s \\ & \quad - 5.876~GATS7c - ~98.970~VE2_} \\ & \quad + 0.161~C1SP3 - 0.986~minHBint8~ \\ & \quad - 5.712~MDEO_} + 5.095 \times 10^} ~PNSA_ \\ & \quad - 6.508~SpMax2_} + 6.561 \times 10^} ~COSMO_} \\ \end $$
(1)
Model 2 (M-2):
$$ \begin PCE = & ~39.827 - 0.3491~ALogP \\ & \quad + 1.412~ATSC4e - 0.122~ATSC4s \\ & \quad - 2.139~ATSC7c - 5.335~GATS7c \\ & \quad - 84.194~VE2_} - 1.213~minHBint8 \\ & \quad - 5.871~SpMax2_} - 8.282~RotBFrac \\ & \quad + 0.230~C1SP3 - 11.458~MDEO_} \\ & \quad + 4.125 \times 10^} ~COSMO_} - 5.396~BCUTc_} \\ \end $$
(2)
Model 3 (M-3):
$$ \begin PCE = ~ & 37.65727 + 2.34 \times 10^} ~ATS6m \\ & \quad + 2.015 \times 10^} ATSC6i - 22.955~MATS4s \\ & \quad - 4.413~GATS7c + 4.710~AATSC5s \\ & \quad - 61.177~VE2_} - 10.921~BCUTc_} \\ & \quad - 12.646~SpMin1_} + 4.687 \times 10^} ~VE3_} \\ & \quad - 1.054~ndO + 5.691~FNSA_ - 1.017~minHBint8 \\ & \quad - 9.164 \times 10^} ~SaasC + 0.839~I_} \\ \end $$
(3)
The \(\:}_\text\text\text\text}^\) (Table 1) values showed that the models could effectively explain a significant portion of the data variability, with the M-3 exhibiting the highest value (\(\:}_\text\text\text\text}^=0.85\)) among all models. Moreover, there was a strong correlation between \(\:}_\text\text\text\text}^\) and \(\:}_\text\text}^\). The \(\:_^\) values higher than 0.6 indicated that there was no overfitting and that the models had good internal predictability [48, 49], which was supported by the similarity between the error measures for the fits (RMSE and MAE) and cross-validations (RMSECV and MAECV). Thus, based solely on the training set metrics, the decreasing order of model performance is M-3 > M-2 > M-1.
Table 1 Variance explained, internal predictability, and error measures for the training and test sets. (bold text indicates the best metrics)It is commonly acknowledged that a low Q2 value indicates low predictive ability of a model. However, it is not correct to assume that a high Q2 value always reflects a strong ability to predict the properties of compounds not included in the training set [50]. Therefore, a test set and its metrics are used to evaluate a model’s predictive performance. Thus, among the various metrics employed to the test set, the \(\:_^\) values higher than 0.5 are widely considered indicative of a model’s strong predictive ability [51]. Overall, all the three models have a good predictive ability (Table 1), with an ascending order of predictivity M-1 ≈ M2 < M-3.
Furthermore, additional metrics—proposed by Golbraikh and Roy [48, 50] – were calculated as supplementary parameters for model evaluation (Table 2). As shown in Table 2, both training and test sets for all models achieved the required threshold values across all evaluated metrics: r2m (LOO) > 0.5, \(\Delta\)2m(LOO) > 0.2, 0.85 ≤ k ≤ 1.15, and \( \left[ }^ - }_}}^ } \right)/}^ } \right] \) < 0.1. Then, these results confirm the predictive order: M-1 ≈ M2 < M-3. Therefore, as shown in Tables 1 and 2, all the models satisfied the established QSPR validation criteria [48, 51, 52] and the analysis of the proposed models showed that M-1 had the poorest performance, while M-3 provided the strongest fits and the best predictive capacity. Visually, strong correlations between the predicted and experimental PCE values (Fig. 1A–C) confirmed the robust predictive capabilities of the models.
Table 2 Metrics for internal and external validation of the models developed. (bold text indicates the best metrics)Fig. 1
Scatter plots of the experimental PCE values against the predicted values for the training and test sets, for a M-1, b M-2, and c M-3
The significance of the models was assessed by y-randomization (500 iterations), recording the R2 and Q2 values for each random model. Figure 2 shows a comparison of the performance of the developed models and random models, using Q2 and R2 metrics. The results showed that the developed models presented significantly higher coefficients of determination when compared to the random models, indicating the relevance of the selected descriptors for predicting PCE [53].
Fig. 2
Plots of Q2 against R2 for the y-randomization tests applied to models a M-1, b M-2, and c M-3
In addition to assessing predictive ability, it is essential to establish the applicability domain (AD) of a QSPR model. Therefore, it was determined whether the studied compounds were within the AD of each model [54]. A common method uses leverage values, with leverage below h* indicating applicability (h*= 3p/n, where n is the training set size and p represents model terms) [55,56,57]. The construction of Williams plots (Fig. 3) showed standardized residuals within ± 3 for all compounds in M-1, M-2, and M-3, indicating an absence of outliers. However, only M-3 showed leverage values below the threshold (h* = 0.4736) for all the compounds. In M-1 (h* = 0.3474) and M-2 (h* = 0.4421), the leverage values for Dye60 and Dye125 exceeded the threshold, suggesting unreliable property predictions for these dyes [58].
Fig. 3
Willams plots for models a M-1, b M-2, and c M-3
Thus, the linear models obtained for carbazole-based dyes demonstrate a similar performance to models that employ both more sophisticated regression algorithms and computationally more expensive molecular descriptors. For example, using molecular descriptors derived from DFT calculations and algorithms such as RF (Random Forest) and ANN (Artificial Neural Network), Yaping Wen et al. [59] obtained models for the PCE of DSSCs with a Pearson correlation coefficient for the test set of approximately 0.8. Another similar example was reported by Liao et al. [60], who employed convolutional neural networks to predict the efficiency of porphyrin-based DSSCs, achieving a test set performance similar to that of Yaping et al. [59]. In other words, the models reported here (M-1 to M-3), in addition to presenting performances similar to other DSSC models, are: (i) specific to carbazole-based dyes; (ii) establish direct relationships between molecular descriptors and the cell PCE; and (iii) the descriptors can be quickly obtained since only semi-empirical methods were employed. These points favor the rapid screening of potential new carbazole-based sensitizers.
Interpretation of molecular descriptorsIn some cases, an informative interpretation of the molecular descriptors in a model can be a challenging task. Therefore, to extract insights from the molecular descriptors, our approach involved correlating some descriptors with chemically interpretable molecular properties. More specifically, we focused our analysis only on model 3 (M-3), which demonstrated the most robust performance across both the training and the test sets.
Consequently, among the list of descriptors, \(\:}_\) clearly indicates the need for dyes exhibiting strong absorptions in the visible region (434 nm) to enable solar cells with higher predicted PCEs. In this sense, this descriptor is associated with the light-harvesting efficiency (LHE) and the requirement for intense absorption in the visible region, which are characteristics strongly linked to a good sensitizer [61, 62]. However, beyond intense absorption, the DSSC efficiency is also directly impacted by the spectral overlap between the charge-transfer band—commonly associated with the maximum absorption (λmax)—and the solar radiation spectrum [62,63,64]. More precisely, a greater spectral overlap favors an increase in the number of electrons injected into the conduction band of the semiconductor, leading to a rise in PCE due to the increase in short-circuit current density, Jsc [65, 66]. Thus, both the descriptor \(\:}_\) and the spectral overlap can be enhanced by increasing the π-conjugation of the sensitizer, leading to an increase in cell efficiency.
Additionally, other structural aspects are suggested by the descriptor \(\:\text\text\text}_\)(Fractional Negative Surface Area), as given by Eq. 4 – for further details, see [67]. \(\:\text\text\text}_\) is a molecular descriptor that measures the exposure of negatively charged atomic sites to solvent molecules. Its definition is given by Eq. 4.
$$\:\text\text\text}_=\:\frac}^_^}^\text}_^}\text\text\text}$$
(4)
Where \(\:}^\) is the sum of all partial negative charges in the molecule, \(\:\text}_}^\) is the solvent-accessible surface area of a negatively charged atom \(\:a\), and \(\:\text\text\text\text\) corresponds to the total solvent-accessible surface area of the molecule. Increasing the \(\:\text\text\text\text\) reduces the absolute value of \(\:\text\text\text}_\), and this reduction is associated with a rise in the predicted PCE. One satisfactory strategy to enhance the \(\:\text\text\text\text\) of the sensitizer is to modify its molecular structure. For example, elongating the π-bridge or adding substituents can increase molecular bulkiness. In this regard, the use of linear alkyl chains can provide a considerable increase in the \(\:\text\text\text\text\) of the sensitizers, contributing to the reduction of the \(\:\text\text\text}_\) descriptor. Experimentally, the insertion of alkyl chains is commonly linked to the reduction of undesirable π-π interactions, promoting an increase in PCE via an increase in Jsc and the open-circuit voltage, Voc [60].
To observe the effect of altering the length of linear alkyl chains on the descriptor \(\:\text\text\text}_\), we performed symmetrical substitutions on the donor group of three dyes (dye46, dye64, and dye66). In this way, it is possible to observe the relationship between the increase in chain length and the descriptor \(\:\text\text\text}_\:\)(Fig. 4), which supports the adoption of such chains for improving the predicted efficiency of DSSCs.
Fig. 4
Influence of the length of linear alkyl chains on \(\:_\)
Furthermore, the model also indicates probable positions at which substitutions may negatively impact the predicted PCE. This is quantified by the \(\:\text\text\text\text\text\) descriptor, an electrotopological value derived from substituted aromatic carbons. Specifically, \(\:\text\text\text\text\text\) is defined as the sum of the E-State values of the substituted aromatic carbons [65, 66]. Since \(\:\text\text\text\text\text\) is always a positive value, an increase in the number of substituted aromatic positions leads to a decrease in the predicted PCE. Empirical tests with dyes dye46, dye64, and dye66 revealed a strong linear relationship with increasing methyl substituents on their donor groups (Fig. 5). Although the descriptor thus correlates aromatic substitution with DSSC predicted efficiency, it is important to emphasize its dependence on substituent electronegativity, since the E-state of an atom depends on neighboring groups [68, 69]. That is, the use of substituents with electronegative atoms (e.g., nitrogen and oxygen) will attenuate the effect of aromatic position substitution [68, 69]. In this sense, long-chain alkoxy groups are good substituent options, as they have proven to be efficient for other sensitizer groups [70, 71].
Fig. 5
Variation of the \(\:SaasC\) descriptor as a function of the number of methyl groups present in the donor group of the dye46, dye64, and dye66 structures
Two additional electrotopological descriptors, \(\:\text\text\text\text\text\text\text\text8\) and ndO, are also significant. The \(\:\text\text\text\text\text\text\text\text8\) descriptor is defined as the lowest E-state value of atoms involved in potential intramolecular hydrogen bonds at a distance of eight bonds. This descriptor is significance stems from the fact that E-state values tend to decrease when more electronegative species are present [68, 69]. The ndO descriptor, conversely, quantifies the number of oxygen atoms with double bonds within the molecule. A higher ndO value suggests the existence of multiple potential adsorption configurations on the semiconductor surface, which may substantially influence electron injection efficiency into the conduction band. On the other hand, the autocorrelation descriptors (\(\:ATS6m\), \(\:ATSC6i\), \(\:AATSC5s\), \(\:MATS4s\), and \(\:GATS7c\)) describe the distribution of specific properties, such as electronegativity, charge, mass, volume, across a molecule with N atoms [72]. In general, these descriptors indicate that an increase in dye mass or volume often leads to a larger solvent‑accessible surface area, and the presence of atoms with higher ionization energies or greater electronegativity is significantly important for predicting enhanced PCE.
Furthermore, the M-3 model presents four descriptors derived from the eigenvalues of specific matrices: \(\:VE_,\)\(\:SpMin_\), \(\:_\), and \(\:VE_\) [72]. For example, \(\:VE_\) is obtained by summing the coefficients of the last eigenvector of the detour matrix. Thus, \(\:VE_\) has identical values for similar structures, such as dye39 and dye40 (9.34), but shows considerable variations when there is an increase in molecular branching, as seen with dye29 (− 12.54), dye30 (− 6.21), and dye87 (− 6.38) and dye88 (− 2.77). In contrast, the \(\:SpMin_\) is derived from the absolute value of the smallest eigenvalue of the Burden matrix, weighted by the first ionization potential [72]. Thus, variations in \(\:SpMin_\) are expected to be correlated with the ionization potential of the sensitizer. Additionally, the descriptor \(\:_\), which corresponds to the smallest eigenvalue of the Burden matrix weighted by partial charges, further aligns it with the concepts presented by the autocorrelation descriptors, especially with \(\:GATS7c\).
Finally, the descriptor \(\:VE_\) is calculated as the average of the coefficients of the last eigenvector of the Barysz matrix, weighted by van der Waals (vdW) volumes. Since this descriptor is obtained by weighting with the van der Waals volume, it is expected that modifications in molecular volume will promote a reduction in the \(\:VE_\) value. In this sense, to observe this effect, a small experiment was carried out to assess the effect of progressively elongating the π-bridge via thiophene and benzene rings on \(\:VE_\) (Fig. 6). Thus, it is notable that changing the π-bridge length can undoubtedly lead to a favorable reduction of this descriptor. That is, species with longer π-bridges tend to exhibit higher predicted PCEs. Therefore, molecular modifications via π-bridge elongation corroborate the need for satisfactory absorption in the visible region and considerable overlap with the solar radiation spectrum, favoring an increase in Jsc.
Fig. 6
Variation of the \(\:VE_\) descriptor as a function of the number of rings present in the π-bridge
In general, the M-3 model demonstrates a similar performance to the models proposed in the literature [73]. From the analysis of its descriptors, it is also possible to observe similarities with structural features indicated by the models, such as the presence of alkyl chains to reduce π-π interactions. However, the M-3 model also introduces several new characteristics, such as absorption in the visible region, substitution of aromatic carbons, and the length of the π-bridge. In summary, our best model provides complementary information regarding important structural features for a carbazole-based sensitizer to perform adequately in a DSSC.
Applying the M-3 model: predictions, molecular modifications and DFT calculationsAs previously indicated by the validation metrics applied to the training and test sets, the M-3 model was identified as the best-performing one. Consequently, this model is expected to exhibit satisfactory predictive capability when applied to the assessment of new carbazole-based dyes. To evaluate this critical aspect, the M-3 model was tested on eight novel dye molecules (Table 3) selected from the literature [74,75,76,77], where these molecules were selected following the same criteria described in “Dye structures and conversion efficiencies” Section. Thus, after performing the necessary steps to obtain the molecular descriptors (“Structural optimization of dyes and Obtaining molecular descriptors” Sections), the PCE for these eight sensitizers was predicted.
Therefore, it is noteworthy that the predicted PCE values show considerable agreement with their respective experimental values (Table 3) – for these structures, the AD is presented in the Supplementary Material. The only exception is CB-K2K1S, which exhibits an error of approximately 35%. This discrepancy indicates that CB-K2K1S and, likely, its derivatives are not well predicted by the M-3 model. Despite this outlier, the predicted PCEs are strongly correlated with the experimental values—with a Pearson correlation coefficient, r, of approximately 0.75. This result demonstrates the model’s good predictive capability for estimating the PCE of novel carbazole-based sensitizers.
Table 3 External set of sensitizers employed to evaluate the predictive capability of the models and their experimental/predicted PCE (%)Given the strong predictive capability of the M-3 model, we employed it to evaluate new structures obtained through structural modifications, which were informed by insights from the molecular descriptor analysis (“Interpretation of molecular descriptors” Section). Specifically, the modifications were guided by key factors identified by the M-3 model: (i) increased molecular branching; (ii) π-bridge modification; and/or (iii) incorporation of atoms with higher ionization potentials. Therefore, we strategically focused these modifications exclusively on the π-bridge of the LY-P, LY-F, and LY-S dyes, yielding a set of optimized LY sensitizer derivatives (see Fig. 7). This strategy was based on the following: (1) The predicted PCE values for the LY series (Table 3) show good agreement with the experimental values, indicating that predictions for their derivatives are likely to be reliable, (2) LY sensitizers can be synthesized through a few high-yielding steps [75], implying that their derivatives would also be synthetically accessible, and (3) π-bridge modifications have been shown to have greater influence on DSSC efficiency [9, 78,79,80].
Therefore, we systematically explored these modifications using two molecular positions (P1 and P2) and six established ring systems (A1-A6), all commonly employed in DSSCs. The fused ring in the π-bridge was retained due to its proven efficacy in improving sensitizer performance [19, 81] (Fig. 7). Consequently, this strategy yielded 36 novel potential sensitizers. For each of them, the structure was optimized, and the molecular descriptors required for PCE prediction were calculated.
Fig. 7
Molecular structure of a π-bridge ring systems and their molecular positioning, and b an example of a double insertion of rings A1 and A2
The model estimates that all 36 modifications lead to a probable improvement in efficiency (Fig. 8) compared to the initial LY sensitizers (LY-S, LY-P, and LY-F). When examining only the derivatives of LY-S, LY-P, and LY-F, which incorporate the A2, A3, and A4 at the P2 position, the model suggests that modifications with A1 and A2 rings at the P1 position tend to yield higher efficiencies. Furthermore, benzene (A3) appears to be a poor choice for π-bridge, particularly when adopted at P2. Moreover, when the thiophene with a linear alkyl group (A1) occupies the P1 position—a modification that increases molecular branching—the predicted PCE is consistently higher than that of other configurations, particularly in combination with the A2, A5, and A6 rings. These modified structures (A1A2, A1A5 and A1A6) demonstrate nearly twice the predicted efficiency of the unmodified parent molecules (LY-S, LY-P, and LY-F).
In a sense, the very good predicted efficiencies of those molecules agree with several structural features—particularly π-bridge length and enhanced molecular branching—as identified through molecular descriptor analysis and supported by existing experimental studies. However, experimental validation is still necessary to effectively confirm the conversion efficiency for the all 36 proposed molecules, especially for A1A2, A1A5, and A1A6, whose predicted PCEs are around 9%.
Fig. 8
Heatmaps to predicted PCE by the model M-3
However, to corroborate that the proposed modifications can enhance cell efficiency, we conducted DFT and TD‑DFT calculations, which are commonly employed for evaluating a small sample among the newly designed sensitizer structures [82,
Comments (0)