
Remember me

Patient characteristics are summarized in Table 1. The study included 90 patients with advanced STS, with a median age at first diagnosis of 50 (interquartile range [IQR] 39–62) years; 54% of patients were female. The most common histologic subtype was leiomyosarcoma (41%), followed by synovial sarcoma (16%), undifferentiated pleomorphic sarcoma (UPS, 10%), and liposarcoma (12%), with other rare subtypes comprising 21%. Tumors were predominantly high grade, with 52% graded G3 and 43% graded G2 according to the Fédération Nationale des Centres de Lutte Contre le Cancer (FNCLCC). Primary tumors were more frequently visceral (48%) and extremity-based (33%). Of the 90 patients included in the study, 30.6% presented with metastatic disease at initial diagnosis, whereas 69.4% developed metastatic disease metachronously following prior treatment of localized STS. At first diagnosis of metastasis, 59% of patients presented with diffuse metastases, while 41% had oligometastatic disease (≤ 5 lesions). Most patients received ≥ 4 lines of systemic therapy, and 92% were treated with an anthracycline-based first-line regimen. Regarding second-line therapy, most patients either had progressive disease (48%) or stable disease (39%). Partial responses were rare (12%), and there was no complete response. Time to metastatic disease was heterogeneous, occurring within 6 months in 34% of patients, between 6 and 24 months in 36% of patients, and after > 24 months in 29% of patients.
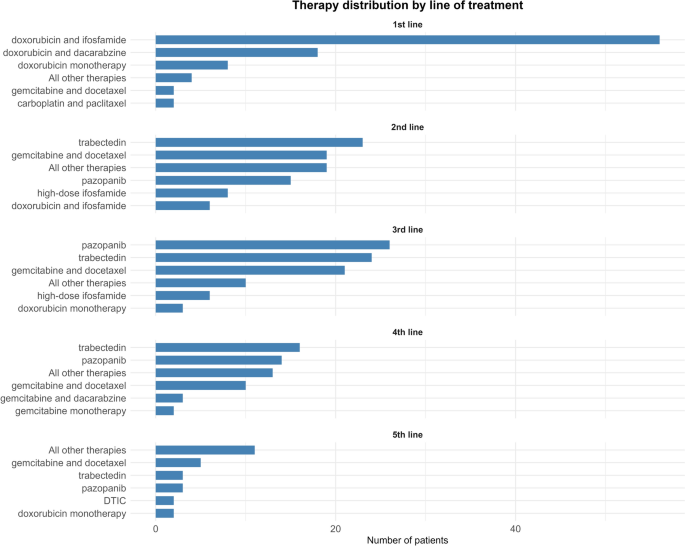
Table 1 Patient characteristicsTreatment PatternsAcross treatment lines, therapy selection became increasingly heterogeneous. First-line treatment was dominated by doxorubicin + ifosfamide (62.2%), followed by doxorubicin + dacarbazine (20.0%) and doxorubicin monotherapy (8.9%). In later lines, trabectedin, pazopanib, and gemcitabine + docetaxel were most frequently used, with trabectedin predominating in the second (25.6%) line, while pazopanib (28.9%) and trabectedin (26.7%) were most commonly used in the third line. In the fourth line, trabectedin (27.6%) and pazopanib (24.1%) remained the most frequently administered therapies, while treatment selection became more heterogeneous. This diversification was most pronounced in the fifth line, where all other therapies accounted for 42.3% of treatments. (Fig. 1). The most frequently administered treatment regimens by histologic subtype and treatment line can be seen in Electronic Supplementary Material (ESM) Table S1.
Fig. 1
Systemic therapy distribution by line of treatment. ‘All other therapies’ include regimens not explicitly specified within each line-of-therapy subplot, namely dacarbazine (DTIC) monotherapy, doxorubicin monotherapy, gemcitabine in combination with dacarbazine, gemcitabine monotherapy, carboplatin in combination with paclitaxel, high-dose ifosfamide, as well as clinical trial therapies
Survival OutcomesFrom the beginning of third-line therapy, median OS was 20.9 (95% confidence interval [CI] 16.4–25.0) months and median PFS was 3.1 (95% CI 2.8–5.0) months. Following the initiation of fourth-line therapy, median OS decreased to 10.8 (95% CI 9.2–21.2) months, while the median PFS remained similar at 4.0 (95% CI 2.6–5.1) months (Figs. 2, 3).
Fig. 2
Median overall survival and progression-free survival for patients with soft tissue sarcoma from the start of third-line systemic therapy. Note that different x-axis scales were applied between panels to optimize visualization
Fig. 3
Median overall survival and progression-free survival for soft tissue sarcoma from the start of fourth-line systemic therapy. Note that different x-axis scales were applied between panels to optimize visualization
Machine Learning-Guided Survival ModelingAn XGBoost classification model was implemented to identify the most relevant variables for predicting OS of at least 1 year from the start of third-line therapy, based on clinical, disease-related characteristics, and prior treatment characteristics. The XGBoost model achieved a cross-validated AUC of 0.69, indicating reasonable discriminative performance for predicting OS ≥ 12 months. Variable importance analysis from the XGBoost model identified best overall response to second-line therapy (partial response/stable disease [PR/SD] vs. progressive disease [PD]) as the strongest predictor of OS ≥ 12 months, followed by histologic subtype (L-sarcoma vs. other) and time to progression after start of first-line therapy (≥ 12 vs. < 12 months). Additional influential variables included metastatic burden at diagnosis, age at metastatic disease (> 55 vs. ≤ 55 years), and sex, whereas treatment-related factors such as third-line trabectedin use, time to metastasis, maintenance therapy, and metastasis-directed local interventions contributed comparatively less to model performance (ESM Fig. S1).
The multivariable Cox regression revealed that failure to achieve at least stable disease on second-line therapy was independently associated with worse OS (hazard ratio [HR] 2.31, 95% CI 1.28–4.18; p = 0.005). In contrast, a longer time to progression after first-line treatment (≥ 12 months) was associated with improved OS (HR 0.43, 95% CI 0.23–0.79; p = 0.007). Similarly, L-sarcoma histology was associated with improved survival compared to other histological subtypes (HR 0.37, 95% CI 0.20–0.70; p = 0.002) (Fig. 4). In the Cox model evaluating OS from the start of fourth-line therapy, the same set of variables identified for third-line treatment showed largely consistent effects. Failure to achieve at least stable disease during second-line therapy remained independently associated with worse OS (HR 2.06, 95% CI 1.03–4.09; p = 0.040), and L-sarcoma histology was again associated with improved survival (HR 0.28, 95% CI 0.13–0.60; p = 0.001). Time to progression ≥ 12 months after start of first-line therapy continued to show a protective effect, although this did not reach statistical significance in the smaller fourth-line cohort (HR 0.52, 95% CI 0.25–1.06; p = 0.074). Overall, the model remained statistically significant (p = 0.004), supporting the consistency of key prognostic factors across later lines of therapy.
Fig. 4
Multivariable Cox model for overall survival (OS) from third-line therapy. Prior treatment response, histology, and time to progression were independently associated with survival. ref Reference
Treatment Sequencing AnalysisWhen visualized by Kaplan–Meier analysis, distinct but hypothesis-generating patterns in survival according to treatment line were observed for the different agents (Fig. 5). Among patients treated with trabectedin, OS appeared to be the longest when the drug was administered in the fourth line, indicating that trabectedin can be beneficial in later lines of systemic therapy (p = 0.023). In contrast, for pazopanib, survival curves suggested more favorable outcomes when the agent was used earlier in the treatment sequence, particularly in the second line, with a diminishing survival effect when administered in later lines (p = 0.022). For gemcitabine + docetaxel combination therapy, survival curves largely overlapped across second-, third-, and fourth-line use, in line with the absence of a statistically significant association between line of administration and OS (p = 0.12).
Fig. 5
Overall survival by treatment line for selected agents, showing line-dependent effects for trabectedin and pazopanib but not for gemcitabine-docetaxel
Comments (0)