
Remember me
Although significant advances have been made in cancer research, cancer still remains one of the leading causes of death worldwide and continues to pose a major global health challenge [1], highlighting the urgent need for novel and effective treatment strategies [2]. One promising avenue is to target cancer through tumor-immune system interactions. Recent progress in cancer immunotherapy has underscored the intricate relationship between cancer and the immune system [3]. A key aspect of this relationship is the immune system’s ability to recognize and eliminate tumor cells, which plays a crucial role in cancer surveillance and control [4]. Emerging evidence indicates that the immune system is highly responsive to physical exercise, and that exercise-induced immune activation can suppress tumor growth [5]. The role of exercise as a complementary therapeutic approach in cancer treatment is gaining increasing recognition, supported by numerous studies [6, 7]. Regular physical activity has been linked to lower cancer risk, reduced recurrence rates, and improved survival in cancer patients [7]. To fully harness exercise as an anticancer therapy, a continued and more detailed understanding of the underlying biological mechanisms is essential-an area that still remains underexplored. In this context, one of the important goals is to determine exercise conditions that optimize tumor suppression and to identify the optimal time window for therapeutic intervention. This paper aims to investigate these goals related to exercise-induced tumor suppression using mathematical modeling.
To investigate how exercise contributes to tumor suppression, several experimental studies have been performed. In one such preclinical study [8], mice given access to voluntary wheel running exhibited a marked reduction in tumor incidence and growth across multiple tumor types, including melanoma, lung carcinoma, and liver cancer, with reductions in tumor burden exceeding 50%–60%. In addition, independent preclinical studies using breast cancer models have shown that exercise slows tumor progression [9]. Experimental studies directly examining the effects of exercise on human cancers remain limited; however, a recent study in pancreatic cancer patients reported exercise-induced tumor suppression [10].
Studies have shown that the underlying mechanism of exercise-induced tumor suppression typically involves activation of different types of immune cells. For example, in [8] the mechanism of exercise induced tumor suppression was attributed to exercise-induced infiltration of natural killer (NK) cells into the tumors, enhancing direct tumor cell killing through their cytotoxic activity. NK cells, a subset of cytotoxic lymphocytes in the innate immune system, operate in distinct functional states regulated by a balance of activating and inhibitory signals [8]. Their cytotoxic potential depends on the activation of specific surface receptors: engagement with activating ligands drives NK cells into an active state capable of recognizing and destroying target cells, while dominant inhibitory signals keep them in a resting, non-cytotoxic state [11]. In [8], NK cell activation during exercise was attributed to the release of the cytokine IL6 from skeletal muscle. Furthermore, activated NK cells act as ‘serial killers,’ eliminating multiple tumor cells before undergoing apoptosis, making them particularly effective in tumor suppression [12].
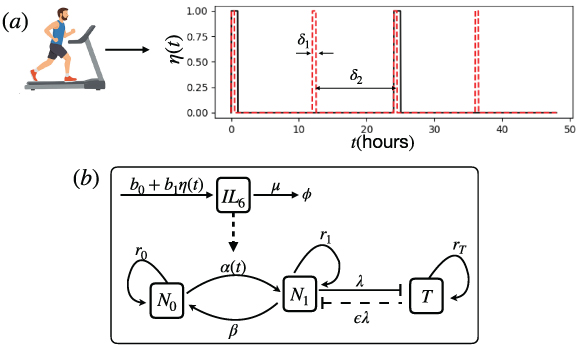
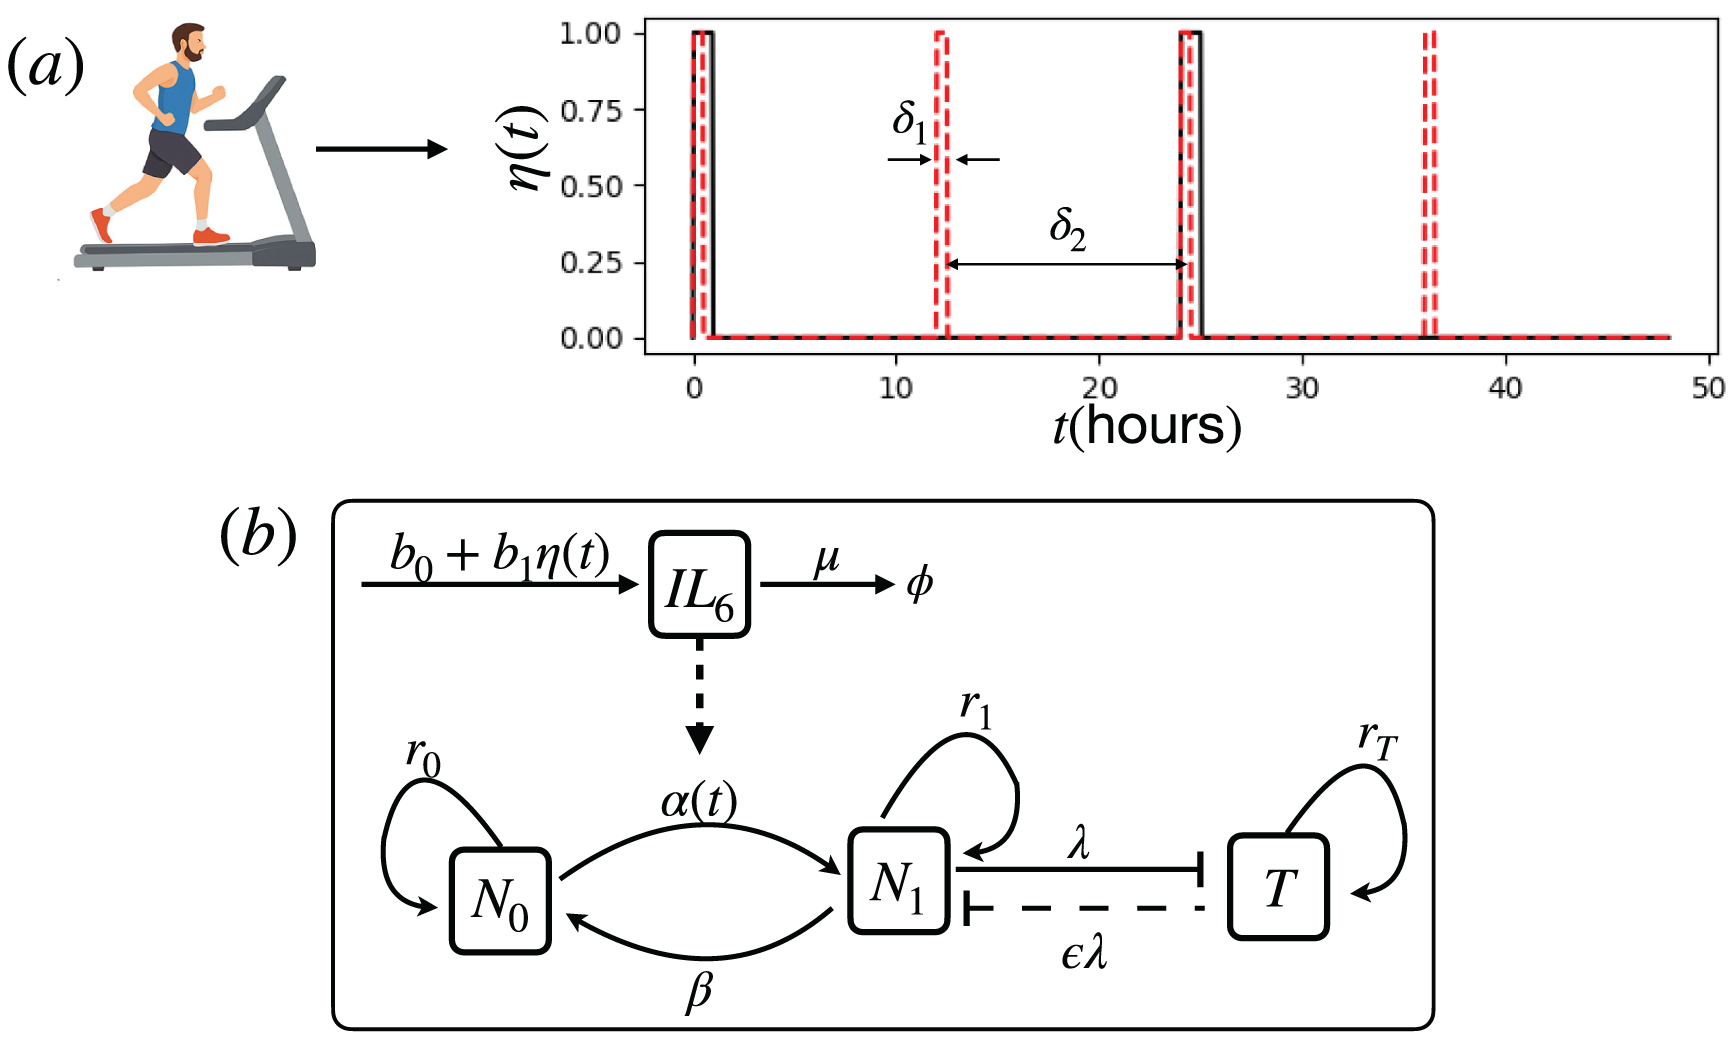
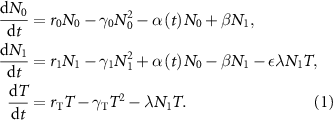
To explore how exercise features, such as exercise intensity, duration, and frequency affect tumor progression following diagnosis, a coarse-grained mathematical model was recently proposed [13]. The schematic representation of the model is shown in figure 1(b). In the model, NK cells switch between inactive and active phenotypic states, denoted by N0 and N1, respectively. Inactive NK cell becomes activated at a rate  , which depends on IL6 levels and may vary in time during exercise. Activated NK cell switches to the inactive state at rate β. The growth rates of NK cell in the inactive (active) state are r0 (r1), respectively. Activated NK cell kill a tumor cell at rate λ, and activated NK cell gets killed in such NK-tumor cell interaction at rate λε, with parameter ε (
 ) representing serial killing ability of the activated NK cells. Growth rate of a tumor cell is denoted by
  . In addition, cells also compete for limited resources such as nutrients, oxygen, and space, resulting in density-dependent mortality [14]. As the population approaches its carrying capacity, growth slows due to resource limitation [15]. In the present model, this competition is assumed to be intra-species; accordingly,
  , and
, and  represent the intra-species competition parameters for inactive NK cells, active NK cells, and tumor cells, respectively.
Figure 1. In (a), schematic representation of fixed exercise volume scenario has been shown in the time duration of  , keeping total exercise volume of 2 h fixed: solid exercise bursts are of 1 h duration, while the dashed exercise bursts are of 0.5 h duration. In (b) a schematic representation of exercise dependent modulation in IL6 levels and activation of NK cell, and subsequent tumor suppression has been shown.
Download figure:
Standard image High-resolution imageBased on the proposed model, a multi-bout exercise regimen was studied in [13], characterized by an exercise cycle that consists of an active exercise phase lasting for a duration δ1, followed by a rest phase of duration δ2. This cycle is then repeated periodically after a total period  . In the study, each exercise session had a fixed exercise duration of δ1 = 1 h, followed by rest duration δ2, and the exercise frequency
  was modulated by varying the rest period δ2, effectively characterizing how often the 1 h exercise sessions are repeated. It was observed that the tumor population evolves in a nonmonotonic manner, characterized by two important time scales, time at which tumor population is minimum and the time duration during which tumor remains suppressed. These time scales are theoretically significant as having information about these can be helpful in determining when to involve therapeutic intervention for efficient control in cancer. Furthermore, it was shown that increasing exercise frequency leads to increase in maximum tumor suppression. However, in such a setup, it is important to note that in a given time window, the total duration of exercise activity was not fixed. For instance, over a 7 d period, when δ2 = 10 h the total exercise time amounts to 15.27 h, whereas increasing δ2 to 20 h reduces the total exercise time to 8 h. In this formulation, the total exercise volume over a fixed time window scales directly with exercise frequency, which does not reflect realistic exercise prescriptions. Clinical data indicate that 225 min per week represents an effective weekly exercise dose for conferring anti-tumor benefits in humans [16]. In this context, the question is whether the anti-tumor effects of this weekly exercise dose level differs as a function of the number of exercise sessions: is it more efficacious when delivered as a single weekly session (225 min in one session), 3 sessions per week (75 min per session), 5 sessions per week (45 min per session) or even 7 d per week (32 min per session)? As we will see, introducing such a constraint on total time duration of exercise can lead to interesting results.
In order to explore effects of fixed exercise volume constraint (see figure 1(a)) on tumor suppression, we use the model developed in [13], describing exercise-induced activation of NK cells and subsequent killing of tumor cells by NK cells, see figure 1(b). Mathematically, the model is represented by a set of coupled differential equations for the temporal evolution of the mean number of inactive NK cells (N0), active NK cells (N1), and tumor cells (T):
In [13], the switching rate  of NK cells was modeled phenomenologically as a function of exercise intensity and duration. However, since the switching rate depends on the IL6 levels, a more direct approach is to explicitly model the temporal evolution of IL6 and then use it to define the switching rate. Here, we express
  directly in terms of parameters governing IL6 kinetics. To do this, we employ a minimal single-compartment ODE model for IL6, whose temporal evolution is given as:

characterized by b0 as the basal production rate in the absence of exercise, b1 representing production rate enhancement due to exercise, and  representing an exercise protocol, with
  1 and 0, during exercise (of duration δ1) and during rest phase (of duration δ2), respectively. The degradation rate of IL6 is denoted by µ. Assuming that prior to exercise IL6 level is at the steady state value
  , it starts increasing with exercise from this basal level and at any time t during exercise
  can be written as,
  , which becomes maximum at the end of exercise duration, at
  , consistent with experimental observation [17, 18]. After that, during rest phase, IL6 decreases as
  : here, the solutions in the exercise and rest phases are matched continuously at the transition time
  . These modulation in IL6 levels due to exercise is consistent with experimental observations [17]and modeling [18]. As variations in IL6 levels affect the switching rate of NK cell,
  , i.e. switching rate can be written as
  : α0 represents rate in the absence of exercise, while
  correlate with the exercise intensity, and

After every exercise cycle of duration  ,
,  is repeated periodically. To explore how exercise frequency affects tumor suppression, we numerically simulate the model equations (equation (1)) using the fourth-order Runge–Kutta method [19] with a time step
  . Except parameters
  and µ, all other model parameters have been taken from [13]. Furthermore, IL6 profile generated by equation (2) during exercise and rest phase in the present study qualitatively matches with the phenomenological profile of
  used in [13]:
 ![$\alpha(t) = \alpha_0 + \tilde\frac \exp\left[}\right]$](https://content.cld.iop.org/journals/1478-3975/23/3/036002/revision2/pbae65f8ieqn27.gif) , τ being the exercise duration. Choice of values for
, τ being the exercise duration. Choice of values for  and µ is guided by such matching.
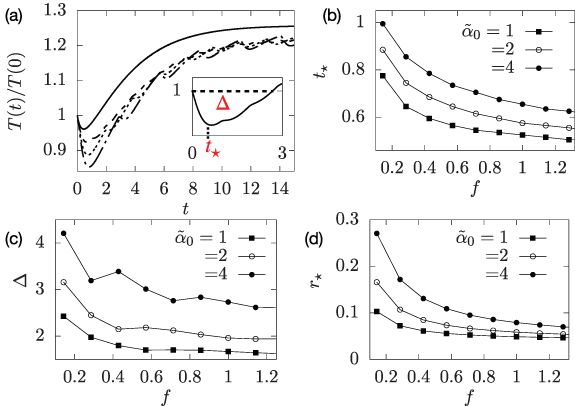
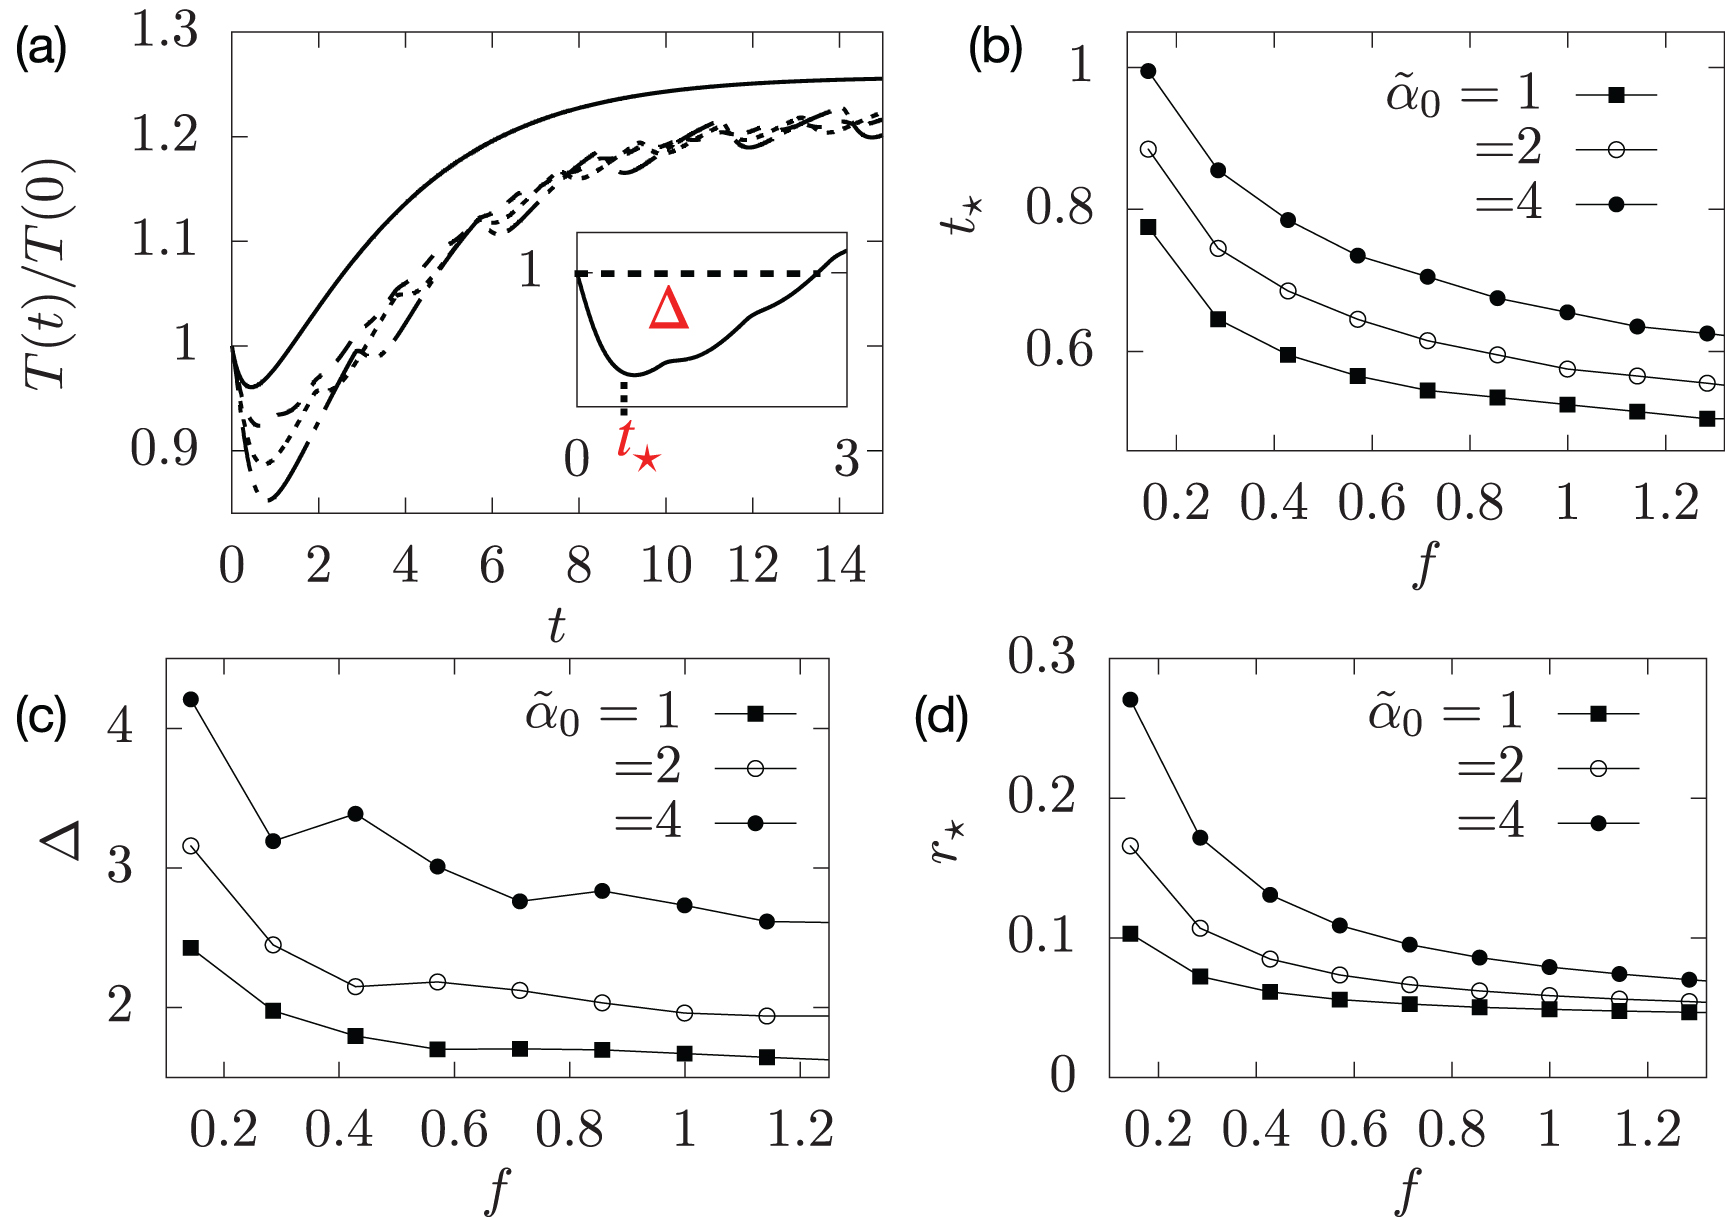
The temporal evolution of tumor population is shown in figure 2(a). As can be seen, the evolution is nonmonotonic, tumor population first decreases and reaches its minimum value and then it starts increasing and in the long time limit it reaches the steady state. Based on the observed non-monotonic temporal evolution, the efficacy of exercise-induced tumor suppression can be characterized by two key time scales: (i) the time at which the tumor population reaches its first minimum, denoted by  (shown in the inset of figure 2(a)), and (ii) the duration over which the tumor remains suppressed, denoted by Δ. Together, these quantities capture both the timing of maximal tumor suppression and the extent of the suppression window. Knowledge of both time scales is essential for guiding the optimal timing and design of therapeutic interventions. In figure 2(b), we notice that, for fixed value of exercise intensity (characterized by
  ),
),  decreases with increase in exercise frequency f. However, for a fixed exercise frequency, we observe that
  increases with increasing exercise intensity. In figure 2(c), we observe that Δ decreases with increase in exercise frequency. However, as expected, increasing exercise intensity keeps tumor remain suppressed for longer duration. Furthermore, in figure 2(d), the maximum tumor suppression
  characterized by
  also decreases with increasing exercise frequency. It is interesting to note that, while in [13], where total exercise volume was not fixed, increasing exercise frequency leads to increase in tumor suppression, in the present case wherein total exercise duration is fixed, increasing exercise frequency leads to a decrease in tumor suppression. In other words, the results suggest that when total exercise volume is held constant, longer-duration exercise bouts are more effective at suppressing tumor growth than shorter, more frequent bursts. This insight emerges directly from imposing a fixed exercise-volume constraint, which provides a more realistic representation of exercise prescription. We also observe that increasing exercise intensity has more dominant effect in tumor suppression for lower frequency exercise, while increasing exercise intensity is not so effective in tumor suppression for higher frequency exercise bursts. Furthermore, the fact that longer duration exercise burst, corresponding to lower frequency, maintains tumor suppressed for longer duration, it provides a relatively wider window for therapeutic intervention.
Figure 2. Exercise induced tumor suppression for fixed volume of exercise (225 min per week): (a) Temporal evolution of tumor population: solid line represents tumor population with no exercise, others are for fixed exercise intensity ( ) and for different exercise frequency
  :
:  (dashed line),
  ( dotted line),
  (dashed-dotted line), where τ = 0.0417 d. In the inset,
  and Δ have been shown for
  . In (b), (c), and (d), variations of
  , Δ and
  have been shown as a function of exercise frequency f for different values of exercise intensity
  . In these plots, t,
  , Δ are in days and f in
  . In all the simulations, Il6 degradation rate
  . Other parameters are (see references in [13]):

 , and initial populations as
  . The rates
  , and β are in unit d−1, and
  and λ are in cell−1d−1.
Download figure:
Standard image High-resolution imageFinally, although our results focus on exercise-induced NK cell activation mediated by IL-6, NK cells are not the only immune effectors involved in exercise-driven tumor suppression. Depending on the cancer type and physiological context, other immune populations such as CD8+T cells [10], as well as multiple effector cells such as NK and CD8+T cells [9], may also contribute. In addition, the relevant cytokine pathways may vary in different settings. Nevertheless, the coarse-grained model in figure 1(b) is sufficiently general to accommodate alternative immune effectors and cytokine signaling pathways without modification of its core structure. Findings presented in this study therefore have potential clinical implications and may provide a significant input in strategically incorporating exercise as a supportive therapy. We anticipate that this work will stimulate further experimental investigations to validate these predictions.
All data that support the findings of this study are included within the article (and any supplementary files).
Comments (0)