
Remember me




The study was approved by the Norwegian Regional Committees for Medical and Health Research Ethics (reference 285666) and by the institutional data protection officer with a waiver for informed patient consent.
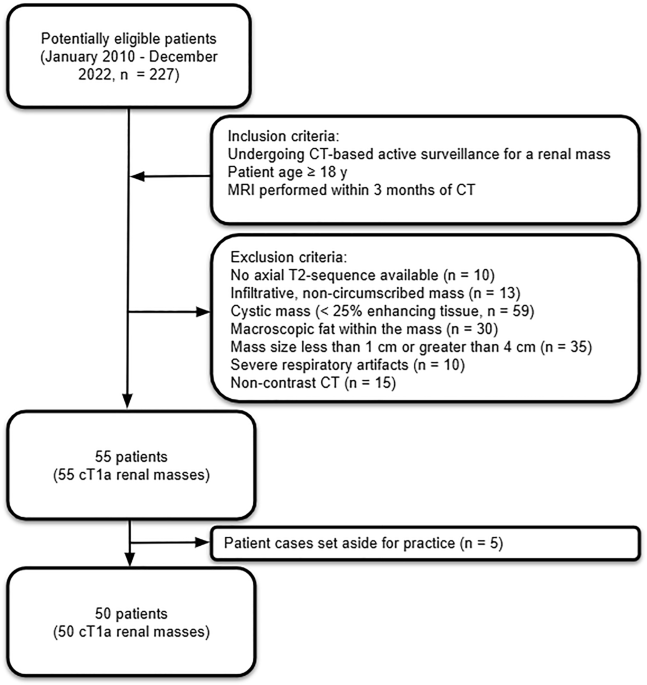
PatientsWe queried the Picture Archiving and Communication System (PACS) at Akershus University Hospital to identify adult patients (≥ 18 years) undergoing AS for a solid SRM (≥ 25% of the mass composed of enhancing tissue) [18] between January 2010 and December 2022. Patients were required to have undergone a contrast-enhanced CT performed according to our institutional renal mass CT protocol, and an MRI had to have been performed within 3 months of this CT, either for AS or other clinical purposes with an axial T2-weighted sequence.
Exclusion criteria included infiltrative and non-circumscribed masses, predominantly cystic masses with less than 25% enhancing tissue, masses containing macroscopic fat, masses measuring less than 1 cm or greater than 4 cm, severe respiratory artifacts on either modality, no axial T2-sequence taken as part of the MRI exam, and NC CT examinations.
If the CT scan was deemed acceptable regarding infiltration and tumor circumscription, the case was included regardless of the MRI findings concerning these parameters. Figure 1 shows the flow of patient selection. Patient eligibility was evaluated by an abdominal radiologist (JB) with 12 years of experience with CT.
Fig. 1 CT and MRI protocols
The CT protocol consisted of contrast-enhanced upper abdominal CT scans performed on one of five different Philips CT systems (Philips Healthcare, The Netherlands), with detector configurations ranging from 64 to 256 slices. A bodyweight-adapted volume of Iohexol 350 mg I/mL (Omnipaque 350, GE Healthcare) was administered at a dosage of 2 mL/kg, with an injection duration of 35 s and a scan delay of 80 s. Scans were acquired with a tube voltage of 120 kV, matrix size of 512 × 512, and automatic tube current modulation (DoseRight 3D-DOM) enabled, with the DoseRight Index set between 19 and 22. Images were reconstructed using the hybrid iterative reconstruction algorithm iDose⁴ (level 2 to 5) with a soft tissue filter (Filter B). Reconstructed axial image slice thickness varied between 0.9 and 3 mm, depending on the specific scanner and clinical protocol (Fig. 2).
Fig. 2
Presents contrast-enhanced CT and T2-weighted images in the axial plane of two small renal masses. A 1.7 cm right-sided, well-circumscribed, endophytic small renal mass in a 70 year-old female patient depicted as homogenous and with a lower degree of enhancement compared to renal parenchyma on contrast-enhanced CT (A) and lower signal intensity relative to renal parenchyma on an MRI T2-sequence (B). A 2.7 cm right-sided, partly exophytic small renal mass in a 65-year-old male patient depicted as slightly heterogeneous with contrast-enhanced CT (C) and with hyperintense signal intensity relative to renal parenchyma on a T2-weighted sequence (D)
MRI examinations were performed on seven different 1.5 and 3 Tesla clinical MRI systems (Philips and Siemens Healthcare). Both conventional multi-shot turbo spin echo (TSE) T2-weighted sequences and single-shot T2-weighted acquisitions (HASTE on Siemens systems and SS-TSE on Philips systems) were used. All T2-weighted sequences were acquired without fat suppression, and most employed partial Fourier techniques. Depending on the clinical and anatomical context, images were acquired either with respiratory triggering or in a breath-hold. Detailed MRI sequence parameters and acquisition times are summarized in Table 1.
Table 1 Ranges of MRI parameters of T2 sequencesObserversA total of nine radiologists from four university-affiliated hospitals and one regional hospital in Norway, Denmark, and Canada (Akershus University Hospital, Aarhus University Hospital, Aalborg University Hospital, Regional Hospital of Viborg, and The Ottawa Hospital) participated in the study. All readers had ≥ 4 years of experience in abdominal CT and MRI interpretation, with a mean of 11.3 ± 5.7 years (range, 4–23).
Observer assessmentsThe paired axial contrast-enhanced CT and axial T2-weighted sequences from each patient were anonymized and uploaded to a previously described web-based platform developed for imaging observer performance studies [19]. This platform supports image review directly through a web browser and automatically captures observer responses. It is integrated with a DICOM viewer that offers multiplanar reconstruction functionality (Fig. 3) [20].
Fig. 3
Screenshot of the web-based Digital Imaging and Communications in Medicine viewer equipped with a case report form. A 2.2 cm posterior exophytic small renal mass in the left kidney is depicted on a contrast-enhanced axial CT image accompanied by reconstructions in the coronal and sagittal planes
The nine observers independently evaluated the 50 patients’ CT and MRI scans separately, with each scan read twice across four distinct reading sessions to assess intra- and interobserver variability. To mitigate recall bias, a mixed-order reading design was implemented, where each session comprised 50 scans, with a minimum two-week washout period between sessions [21]. The CT and MRI examinations were distributed across the sessions, and each patient’s scan appeared only once per session (Fig. 4). Observers were blinded to the technical parameters of the CT and MRI scans, clinical information, and the assessments made by other observers.
Fig. 4
Overview of the reading scheme in a mixed-order setup. Each of the four reading sessions included 50 renal tumors acquired with either CT or MRI, with a minimum two-week washout period between sessions. For each of the nine observers, the order of the first two sessions (Session #1 and Session #2) was randomized. The remaining two sessions were presented in reverse order, such that if an observer initially received Session #2 followed by Session #1, they would later receive Session #4 followed by Session #3. Within each session, the order of scan presentation was randomized
Written instructions and instructional videos on the use of the DICOM viewer were provided. Additionally, observers completed a training session involving five paired CT and MRI cases to familiarize themselves with the viewer interface and the structure of the case report form (Fig. 3).
Observers measured the maximum tumor diameter, with caliper placement restricted to the axial plane in accordance with prior AS protocols where axial measurements are most consistently reported [9]. This approach also reflects the use of axial T2-weighted imaging as a suggested cornerstone of abbreviated MRI protocols for SRM surveillance [14]. To aid in locating the target renal mass, the DICOM viewer displayed a green marker at the z-axis level immediately above the renal mass to be evaluated. In addition, the observers evaluated tumor nearness (TN), an ordinal variable representing the minimum distance from the tumor to the renal collecting system or sinus, categorized into three tiers: ≤4, > 4-<7, and ≥ 7 mm, corresponding to ratings of 3, 2, and 1, respectively. TN is part of the RENAL score, and a well-established predictor of overall complications, postoperative hemorrhage after nephron-sparing surgery, malignancy risk, and adverse pathological features [1, 22, 23]. Observers subjectively graded their diagnostic confidence in delineating the tumor contour (DC) - reflecting tumor–parenchyma contrast, margin clarity, and the impact of noise or artifacts - on a 5-point Likert scale (1 = poor, 2 = fair, 3 = good, 4 = very good, 5 = excellent).
Statistical analysisStatistical analyses were conducted using Python (v. 3.10, https://www.python.org). The normality of the distribution of quantitative variables was assessed both visually and with the Shapiro-Wilk test. Data were reported as mean ± standard deviation (SD) or median with interquartile range (IQR), depending on the normality of the distribution.
We used the limits of agreement with the mean (LOAM) formulated by Christensen et al. to assess observer agreement for tumor diameter measurements in a multi-observer setup [24], and extended the method to encompass both reproducibility LOAM (i.e., how much an observer’s measurement may plausibly deviate from the mean of all observers’ measurements on the specific renal mass) as well as repeatability LOAM (i.e., how much a given observer’s measurement may plausibly deviate from the mean of all measurements performed by that particular observer on the specific renal mass) [25].
We aimed to include a sufficient number of observers to obtain 95% confidence interval (CI) width of approximately 0.5 mm for the reproducibility LOAM. A small pilot study was conducted, in which three observers measured the 50 CT and MRI scans. Given the 50 patient cases and based on the observed measurement variability and the method described by Christensen et al. [24], we estimated that nine observers would be required to achieve an expected 95% CI width of 0.5 mm for the 95% reproducibility LOAM.
For SRM diameter, all observer/session measurements were averaged to yield one CT and one MRI value per patient, avoiding pseudoreplication. Paired t-tests were used to compare modalities. For TN and DC, analyses were based on ratings from the first reading session only. For each patient and modality, the median score across all observers was calculated, yielding one paired value per patient. These patient-level medians were compared between CT and MRI using the sign test, which does not assume equal spacing between ordinal categories. Distributions of ratings are reported as counts and percentages for each category. Inter-observer agreement for all nine observers for TN and DC was assessed using Gwet’s AC2 [26], and differences between CT and MRI were evaluated with a non-parametric bootstrap that resampled patients within each modality to obtain the 95% CI and p-value for the AC2 difference.
Comments (0)