Bioethics
All methods were carried out following guidelines and regulations for using animals. All the procedures presented in this work were approved by the Ethics Committee of Universidad de Los Andes (Folio CEC No. 202033) and by the Ethics Committee of Universidad de Chile (Approval Certificated No. 12). All recruited patients signed informed consent forms before donating tissue.
Animals
C57BL6 male littermates mice were housed together in individually ventilated cages with three to four mice per cage. All mice were maintained on a regular diurnal lighting cycle (12:12 light: dark) with ad libitum access to food and water. Mice were housed under broken barrier-specific pathogen-free conditions in the animal facility of Cells for Cells, according to the guidelines of the Cells for Cells Guide for the Care and Use of Laboratory Animals.
Human OA samples
Chondrocytes, synovial macrophages, and synovial fibroblasts were isolated from female and male donors, aged 40–90, diagnosed with knee or hip OA presenting with functional limitation, who underwent total hip or knee replacement at either Clínica Universidad de Los Andes or at Hospital Clínico Universidad de Chile (HCUCH). Specific protocols for the isolation of chondrocytes, synovial macrophages and synovial fibroblasts are in Supplementary material. OA samples were obtained from both the knee and hip to provide a broader understanding of the disease and assess the treatment effects on OA overall. Furthermore, the use of both samples was influenced by the availability of clinical samples, ensuring an adequate sample size for in vitro experiments.
Mitochondria isolation and in vitro transfer to chondrocytes, synovial macrophages, and fibroblasts
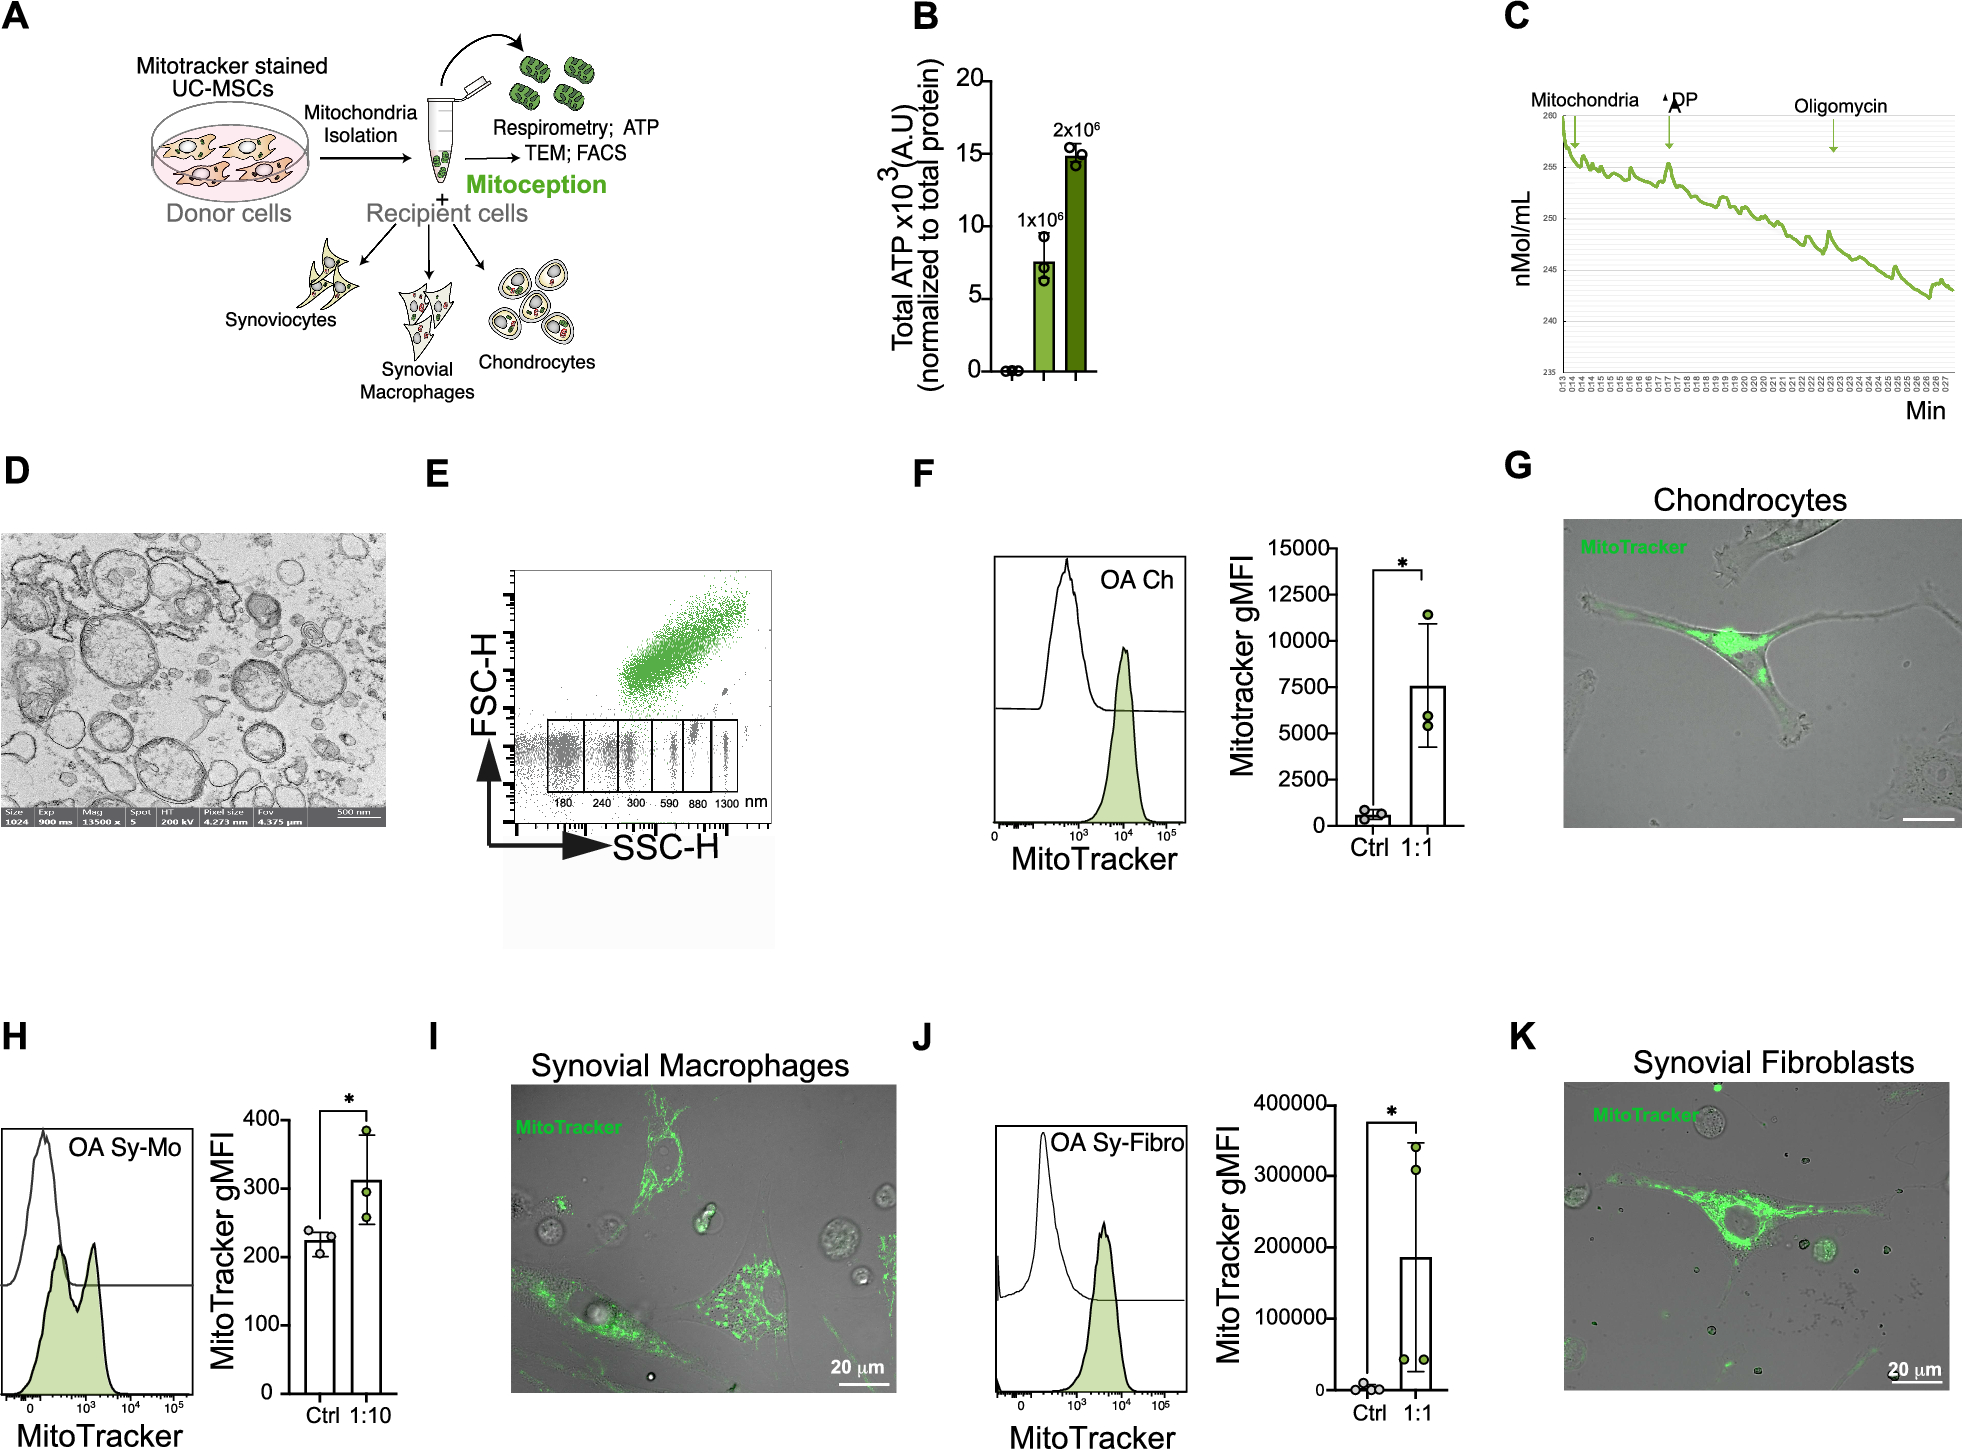
Mitochondria derived from Human UC-MSCs were isolated from the umbilical cords of healthy, voluntary pregnant women, regardless of the sex of the baby were isolated from previously MitoTracker™ deep red (Invitrogen™, USA) labeled cells using the Mitochondria Isolation Kit (ThermoFisher Scientific, USA), following manufacturer’s instructions. After isolation, mitochondria were resuspended in media and were maintained on ice until in vitro transfer following the “Mitoception” protocol as previously described [21]. For that purpose, cells were previously labeled with an MT specific fluorescent probe, MitoTracker Green, following the manufacturer's instructions. Cells were seeded on a cover slide previously coated with poly-lysine, and mitoception was performed using the amount of UC-MSC:Mito corresponding to UC-MSC: Acceptor cell ratios of 1:1 for chondrocytes and synovial fibroblasts, and 1:10 for synovial macrophages, which was selected according to the minimal dose necessary to observed an efficient mitochondrial transfer. Twenty-four hours after artificial mitochondrial transfer, acceptor cells were obtained, and fixed for mitochondrial transfer evaluation by confocal microscopy with a Leica TCS SP8 confocal laser system. The percentage of mitochondria transfer was determined by FACS using the BD FACSCanto™ II (BD Pharmingen).
Mitochondria functional and phenotypic characterization
Mitochondria were isolated from UC-MSC using the Cell Mitochondria Isolation Kit (ThermoFisher Scientific, USA) following manufacturing instructions. Mitochondria characterization and function were assessed by Transmission Electron Microscopy (TEM) to evaluate their structure, Flow cytometry to determine the expression of specific mitochondrial markers, oxygen consumption measurement and ATP content quantification. Specific protocols for their functional and phenotypic characterization are in the Supplementary material.
Collagenase-induced osteoarthritis model
Collagenase-induced OA (CIOA) model was carried out as previously described [5]. Briefly, 1U type VII collagenase in 5 µL saline was administered via intra-articular injection (IA) in the knee joint of C57BL/6 mice (10 weeks old) at days 0 and 2 for OA induction. Groups of 10 mice received MSC IA (2 × 10⁵-High dose and 0.5 cells × 105-low dose/5 µL saline), on days 7 and 14. At day 42, mice were euthanized, and paws were carefully dissected to remove any remaining tissue prior to microCT scanning and then fixed in 4% formaldehyde followed by a demineralization protocol with 5% formic acid for 3 weeks for histological analysis.
MicroCT analysis
The samples were analyzed using X-ray microtomography using a Micro-CT SkyScan 1278 (Bruker, Belgium, 0.5 mm aluminum filter, 20–65 kV, 500µA, resolution of 50 µm, 0.5° rotation angle) provided by the Universidad de Chile, using characteristics defined by the equipment operator. 3D Scans were reconstructed using NRecon software (Bruker, Belgium). Misalignment compensation, ring artifacts, and beam-hardening were configured to obtain a correct reconstruction of each paw. Bone mineral density, BS/BV and thickness were quantified in the 4 knee zones: lateral subchondral, medial subchondral, lateral femur, and medial femur of each paw (CTAn software, Bruker, Belgium).
Histological analysis
Hind paws were decalcified after a 3-week incubation within a formic acid 5% solution and then embedded in paraffin. Tibias were sectioned frontally as previously described [16] and stained with safranin O fast green. Quantification of the degradation of cartilage was performed using the modified Pritzker OARSI score as described [22].
Biodistribution analysis in CIOA murine model
After 80% of confluence, UC-MSC were trypsinized and stained with Mitoview720 (Biotium, USA) at 10 mM for 20 min at 37 °C. Mitochondria derived from UC-MSC were obtained using the mitochondria isolation kit for mammalian cells (Invitrogen, USA). Mice were intraarticularly injected with Mitoview stained-mitochondria derived from 200.000UC-MSC/5 μL into the right knee joint while the contralateral knee was used as a sodium chloride sham control. Detection of fluorescent imaging of OA mice was evaluated at 0, 1 h, 24 h, 48 h and 72 h in an Odyssey CLx Imager (LI-COR) with the Mouse Pad accessory to maintain the body temperature of anesthetized mice at 37 °C. At 72 h, organs were obtained and observed in the Odyssey CLx Imager (LI-COR) to detect potential mitochondria leakage into other organs. In parallel, we performed a human mitochondrial DNA quantification. For that purpose, at day 7 post OA induction, mice were injected intraarticularly with mitochondria derived from MSC and euthanized at 0, 1 h, 24 h, 48 h and 72 h post-mitochondria injection. Knees, draining and popliteal lymph nodes were collected, and total DNA was extracted using the Dneasy Blood &Tissue total DNA isolation kit (Qiagen, USA), following manufacturing instructions. An endogenous control was also amplified to identify the murine mitochondrial genome. Primers´ sequences were as follows: murine mitochondrial genome mouse, forward 5′-CTAGAAACCCCGAAACCA AA-3′, reverse 5′-CTAGAAACCCCGAAACCAAA3′; human mitochondrial genome, forward F3 5′-CACTTTCCACACAGACATCA-3′, reverse 5′-TGGTTAGGCTGGTGTTAG GG-3′. The thermal profile for mtDNA detection was: pre-incubation at 95 °C for 5 min (one cycle); denaturation at 95 °C for 10 s; annealing and extension at 60 °C for 30 s (denaturation and extension steps for 40 cycles); melting at 95 °C for 5 s, 60 °C for 1 min, 95 °C for 15 s, and, the last step, cooling at 40 °C for 30 s. When specific melting curves for the human mitochondrial genome were identified the sample was considered positive for the presence of human mitochondrial DNA.
Immunogenicity evaluation in CIOA murine model
Mice were euthanized on day 14 of OA induction and the draining popliteal lymph nodes were recovered for disaggregation. Extracted cells were passed through a 40-μm filter (cell strainer; BD Falcon) and centrifuged at 1680 rpm for 6 min. Then, cells were cultured with PMA (50 ng/mL) (Sigma) and Ionomycin (1 μg/mL) (Sigma-Aldrich) in the presence of 10 μg/mL brefeldin A (Biolegend, USA). After 4 h, standard intracellular staining was carried out to identify the CD4+, IFN-γ+, IL17+, CD25+ high, and Foxp3+ cells. For this, cells were fixed and permeabilized using the FOXP3 transcription factor staining buffer (Invitrogen™, USA), according to the manufacturer’s instructions. The acquisition was performed with a BD FACSCanto™ II using the FlowJo software (version 10.0.7) measured by flow cytometry.
Human RNA isolation
Four samples of chondrocytes derived from OA patients (Chondro-OA) were cultured and incubated with mitochondria using the protocol described by Caicedo et al. [21]. Then, RNA was obtained using the miRNA isolation kit (Qiagen, France) from Chondro-OA to evaluate the potential RNA differences upon artificial mitochondria transfer. The sequencing was performed with a human Affymetrix® ZebGene 1-0-ST Array (Life Technologies, France), in the transcriptomic platform in the IRMB Institute at Montpellier, France.
Data preparation and differential expression analysis
The raw Affymetrix data were processed using R software (version 4.1.2). Gene expression data were loaded into R and formatted as a data frame using the dplyr library (version 1.1.2). The limma package (version 3.50.0) was used to analyze differential expressions between different conditions. Genes were considered statistically significant if the adjusted p-value (adj.P.Val) was <0.05.
A design matrix incorporating both subject effects and treatment conditions was constructed to adjust for these variables in the analysis. Contrast matrices were created to directly compare the relevant groups, and the empirical Bayes method was applied to moderate the standard errors of the estimated log-fold changes. The pseudocode is as follows:
\(}}}}}} }}}}}}}}} }}} }}}}}} }}} }}} }}}}}}\)
\(Treatment <- factor\left(rep\left(c\left(}, }\right), each=4\right)\right)\)
\(design <- model.matrix\left(\sim Subject + Treatment\right)\)
\(}}} }}}}}} }}}}}} }} }}}} }}}} }}}}} }}} }}}}}} }}}}}}\)
\(fit <- lmFit\left(selecte_, design\right)\)
\(contrast.matrix <- makeContrasts\left(OACvsMito = TreatmentOAC, levels = design\right)\)
\(}}-}}} }}} }}}}}} }}}}} }}} }}}}}}}} }}}}}} }}} }}}}} }}}}}}}} }}}}}\)
\(fit2 <- contrasts.fit\left(fit, contrast.matrix\right)\)
\(fit2 <- eBayes(fit2)\)
Differentially expressed genes were identified based on the following thresholds: adj.P.Val < 0.05 and |logFC|≥ 1. Volcano plots were generated using the EnhancedVolcano package (version 1.10.0) in R, highlighting genes of interest based on log-fold change and adjusted p-value thresholds.
Gene ontology, pathway and network analyses
Significant gene expression changes were visualized using the Seaborn package (version 0.12.2) in Python, which enabled the creation of a clustered heatmap to display gene expression patterns across conditions. Expression values were normalized using Z-scores to facilitate clustering, and the resulting heatmap illustrated key expression trends for the differentially expressed genes (DEGs). Pathway and gene ontology (GO) term enrichment analyses were conducted using the gProfiler tool through its R API (version 1.0.0). This analysis aimed to identify the biological processes and pathways significantly associated with the DEGs, providing insights into the functional implications of the observed transcriptional changes. The analysis covered GO terms for Biological Processes (GO), Transcription Factor (TF) enrichment, and Reactome Pathways (REAC). Additionally, KEGG pathways were explored for insights into metabolic and signaling pathways. Results were visualized as bar plots using the Matplotlib (version 3.7.1) and Seaborn libraries to highlight the most enriched terms and pathways.
To visualize gene networks, we utilized the STRING online server (https://string-db.org/) (version 11.5) to construct protein–protein interaction (PPI) networks. The STRING database provides both experimental and computationally predicted interactions between proteins. We inputted the list of DEGs into STRING to query the database and identify high-confidence interactions, applying a confidence score threshold of 0.7. The resulting interaction network was analyzed to identify central nodes (key proteins) that could represent crucial regulatory factors in the biological processes being studied.
Statistical analysis
For the preclinical assay, results were expressed as the mean ± SD. For the in vivo studies (CIOA) 8 to 10 animals were used for each experimental or control group, and experiments were repeated at least two independent times. The p values were generated by parametric analysis using the one-way ANOVA test for multiple comparisons. p < 0.05 (*), p < 0.01 (**) or p < 0.001 (***) were considered statistically significant. All the analyses were performed using the GraphPad Prism TM 6 software (GraphPad Software, San Diego, California, USA).


Comments (0)