Chemicals
Raloxifene (RAL, #HY-13738) and kainic acid (#HY-N2309) were obtained from MedChemExpress (Monmouth Junction, NJ, USA). Stock solutions of RAL and KA were prepared at 10 mM in pure dimethyl sulfoxide (DMSO) and saline, respectively. Erastin (#S7242) and RSL3 (#S8155), purchased from Selleck Chemicals (Houston, TX, USA), were dissolved in DMSO to prepare 1 mM stock solutions. The fluorescent dyes 3-amino; 4-aminomethyl-2′,7′-difluorescein diacetate (DAF-FM-DA, #S0019S); and 2′,7′-dichlorodihydrofluorescein diacetate (DCFH-DA, #S0033S) were sourced from Beyotime Biotechnology (Shanghai, China). MitoSOX (#M36008), MitoTracker Green (#M7514), and BODIPY-581/591-C11 (#D3861) were obtained from ThermoFisher (Waltham, MA, USA). Additionally, 3-(4,5-dimethyl-2-thiazolyl)-2,5-diphenyl-2-H-tetrazolium bromide (MTT) was acquired from Sigma-Aldrich (St. Louis, MO, USA), along with all other chemicals used in this study, unless otherwise specified.
Cell Culture and Cell Viability Assay
HT22 mouse hippocampal neuronal cells and MDA-MB-231 human breast cancer cells were obtained from the Cell Bank of the Chinese Academy of Sciences (Shanghai, China). These cells were maintained in DMEM supplemented with 10% (v/v) fetal bovine serum (FBS; ThermoFisher, Waltham, MA, USA) and antibiotics (100 U/mL penicillin and 100 μg/mL streptomycin; Sigma-Aldrich). Cultures were kept at 37 °C in a humidified atmosphere with 5% CO2. To preserve their sensitivity to chemically induced ferroptosis, the cells were passaged fewer than 20 times, as higher passage numbers often diminish their responsiveness. Cell viability was assessed using the MTT assay, as previously described [11]. Cell line authentication was confirmed by short tandem repeat (STR) profiling, and routine testing ensured the cell cultures free from mycoplasma contamination.
Staining of Live and Dead Cells
Live and dead cells were distinguished using the Calcein-AM and PI double staining method, according to the manufacturer’s instructions (SolarBio, Beijing, China). Briefly, following chemical treatment of HT22 cells, 1 µM Calcein-AM and 2.5 μM PI were added to the culture medium. The cells were then incubated for 30 min at 37 °C in the dark. After incubation, images were captured using a Nikon Eclipse Ti-U inverted microscope (Nikon, Tokyo, Japan).
Quantitative Real-Time Reverse Transcriptase Polymerase Chain Reaction
Total RNAs were extracted from cells using the TRIzol reagent (#15,596,018; Invitrogen, Waltham, MA, USA), followed by chloroform extraction. The RNAs were precipitated with isopropyl alcohol, washed with 75% ethanol, and dissolved in RNase-free sterile water. First-strand cDNAs were synthesized using the Hifair-III 1st Strand cDNA Synthesis Kit (#R312, Vazyme Biotech Co., Ltd, Nanjing, China). Quantitative real-time reverse transcriptase polymerase chain reaction (qRT-PCR) was then performed using PerfectStart Green qRT-PCR SuperMix (#AQ602, TransGen Biotech, Beijing, China) on an Applied Biosystems QuantStudio 3 (ThermoFisher, Waltham, MA, USA). Relative gene expression was calculated using the 2−ΔΔCt method, with GAPDH as the internal control.
Primers for the ferroptosis-related genes GPX4 and PTGS2 (sequences provided in Table 1) were synthesized by Sangon Biotech (Shanghai, China). GPX4 and PTGS2 are commonly used as marker genes for ferroptosis. Previous studies have shown that these genes display similar expression trends in both rodent and human cells during erastin- or RSL3-induced ferroptosis [37,38,39].
Table 1 Primer sequences used in qRT-PCR analysisMeasurement of Cellular/Mitochondrial NO and ROS by Fluorescence Microscopy
HT22 cells were seeded in 24-well plates at a density of 5 × 10⁴ cells per well and treated with different chemicals for selected durations. After treatment, cells were washed twice with HBSS and stained with 5 μM DAF-FM-DA (for cellular NO), 5 μM DCFH-DA (for cellular ROS), 5 μM MitoSOX (for mitochondrial ROS), or 5 μM MitoTracker Green in 200 μL DMEM (free of phenol red and serum) for 20 min at 37 °C. Following three washes with HBSS, fluorescence images were captured using an AXIO fluorescence microscope (Carl Zeiss Corporation, Germany).
Measurement of Cellular NO, ROS, and Lipid-ROS by Flow Cytometry
HT22 cells were plated in 6-well plates at a density of 1.5 × 10⁵ cells per well and incubated for 24 h prior to drug treatment. After treatment, cells were trypsinized, collected, and suspended in phosphate-buffered saline (PBS). The cells were centrifuged, and the resulting pellets were resuspended in DMEM (free of phenol red and serum) containing 5 μM DAF-FM-DA (for cellular NO), DCFH-DA (for cellular ROS), or BODIPY-581/591-C11 (for cellular lipid-ROS). After a 20-min incubation at 37 °C, cells were washed three times with HBSS to remove excess dye. Levels of cellular NO, ROS, and lipid-ROS were then measured by flow cytometry (Beckman Coulter, Brea, CA, USA) and analyzed using FlowJo software (FlowJo, LLC, Ashland, USA).
Measurement of Lipid-ROS by Confocal Microscopy
HT22 cells were seeded at a density of 1 × 10⁵ cells per well on coverslips placed inside 12-well plates. Twenty-four hours after seeding, cells were treated with the selected chemicals. Coverslips were washed with HBSS and incubated in HBSS containing 5 μM BODIPY-581/591-C11 for 20 min at 37 °C. After incubation, coverslips were mounted on microscope slides and imaged using an LSM-900 confocal laser scanning microscope (Carl Zeiss, Oberkochen, Germany). Images were analyzed using Zen software (Carl Zeiss).
Immunoblotting Assay
Following drug treatment, HT22 cells were lysed on ice for 15 min using the RIPA buffer (#P0013B; Beyotime Biotechnology, Shanghai, China) containing a protease inhibitor cocktail (Selleck Chemicals, Houston, TX, USA). The lysates were then centrifuged at 13,000 rpm for 15 min at 4 °C. Supernatants were collected and mixed with 5⨯ SDS sample buffer (Beyotime Biotechnology, Shanghai, China) for subsequent protein separation by SDS-PAGE. For immunoblot analysis of dimeric and monomeric forms of iNOS and nNOS, protein samples were prepared in non-reducing sample buffer without heating [40]. Proteins of interest were probed using the following primary antibodies: anti-PDI (1:3000; #3501S; Cell Signaling Technology, Beverly, MA, USA), anti-iNOS (1:3000; #ab178945; Abcam, Cambridge, MA, USA), anti-nNOS (1:3000; #ab76067; Abcam, Cambridge, MA, USA), and anti-β-actin (1:5000; #GB12001-100; ServiceBio, Wuhan, China). HRP-conjugated secondary antibodies, anti-rabbit (1:5000; #7074S) and anti-mouse (1:5000; #7076S), were obtained from Cell Signaling Technology (Beverly, MA, USA).
Cellular Thermal Shift Assay (CETSA)
The CETSA was performed according to the protocols outlined in previous studies [41, 42]. Briefly, after treating the cells with either the vehicle or specified chemicals for 1 h, the cells were rinsed with ice-cold PBS, collected through trypsinization, centrifuged, and then resuspended in PBS supplemented with a protease inhibitor cocktail (Selleck Chemicals, Houston, TX, USA). Equal volumes of the cell suspension were distributed into 0.2-mL PCR microtubes. Next, the aliquots of the cell suspension underwent heating in a Ristretto Thermal Cycler (VWR, Darmstadt, Germany) at the specified temperatures for 3 min, followed by a cooling period of 3 min at room temperature. Subsequently, the cells were lysed using three cycles of freeze-thawing, and the soluble fractions were obtained via centrifugation and examined by SDS-PAGE and Western blotting as described earlier. For the isothermal dose–response-CETSA (ITDRCETSA), the change in the level of the protein of interest (normalized to the β-actin control) was plotted against temperature to generate the PDI melting curves for different treatments.
Protein Expression and Purification
The mutant PDI-Ala256 protein was generated from full-length wild-type human PDI cDNA using the QuikChange II XL site-directed mutagenesis kit (Agilent Technologies). For protein purification, the PCR products of wild-type PDI-His256 and mutant PDI-Ala256 were subcloned into the pET28a vector and expressed in the E. coli strain JM109 (DE3) cultured in Luria–Bertani (LB) medium. Bacterial cultures were grown at 37 °C until the optical density (OD) reached approximately 0.8, after which 1 mM isopropyl-β-D-1-thiogalactopyranoside (IPTG) was added to induce protein expression. The cultures were then incubated at 22 °C for 8 h. Bacteria were harvested by centrifugation at 5000 × g for 30 min at 4 °C and lysed in the presence of a protease inhibitor cocktail. The lysates were centrifuged at 20,000 × g for 30 min, and the resulting supernatants were incubated with Ni–NTA agarose (QIAGEN) at 4 °C for 1 h. The columns were washed and eluted with 20 mM imidazole. The purified proteins were concentrated and analyzed by SDS-PAGE to confirm their integrity and purity.
Assay of PDI Catalytic Activity and Its Inhibition by RAL
The impact of RAL on the catalytic activity of purified recombinant PDI-His256 (wild-type) and PDI-Ala256 (mutant) was assessed by examining PDI-mediated aggregation of the insulin B chain, as previously described with some alterations [43, 44]. In brief, insulin (125 μM) was incubated in the presence or absence of recombinant PDI-His256 or PDI-Ala256 (at 0.2 μg/μL) in a 96-well plate containing 10 mM sodium phosphate buffer (pH 7.4) and 5 mM DTT. The aggregation process was monitored at 37 °C using a Synergy Plate Reader (BioTek, Winooski, VT, USA) at a wavelength of 650 nm.
Molecular Docking Analysis
The binding interaction between RAL and PDI was analyzed using molecular docking methods. The structures of human PDI (PDB code 6I7S; chain A) [45] and RAL (from the ER–RAL complex; PDB code 2QXS; ligand ID RAL) [46] were downloaded from the Protein Data Bank (https://www.rcsb.org/) [47], with PDI serving as the receptor and RAL as the ligand.
The structures were preprocessed using the Protein Preparation Wizard in Schrodinger Suite (Maestro 12.8, 2021; Schrodinger LLC, New York, NY, USA). Hydrogen atoms were added, and the protein structures were optimized using the OPLS4 force field [48]. Protein–ligand docking decoys were generated with Glide XP (extra precision) in Schrodinger Glide software [49], followed by Monte Carlo sampling of torsional minima in the lowest energy binding poses. The docking grid box, centered on the Cα atom of His256 in the PDI b′ domain, was set to dimensions of 30 × 30 × 30 Å3.
To further refine the docking results, three representative scoring functions were employed: X-Score [50], PRODIGY-LIG [51], and ΔvinaRF20 [52]. X-Score and PRODIGY-LIG, which are linear empirical scoring functions, calculate protein–ligand binding affinity using terms such as van der Waals energy, hydrogen bonding energy, deformation penalties, hydrophobic effects [50], atomic contacts, and electrostatic energy [51]. ΔvinaRF20, a random forest-based method, predicts binding affinity based on 20 descriptors [52].
To assess the role of His256 in the interaction between PDI and RAL, His256 was mutated to alanine (Ala) in the predicted PDI–RAL complex structure. The binding energies for both wild-type and mutant complexes were predicted using X-Score, PRODIGY-LIG, and ΔvinaRF20 to evaluate the impact of the mutation.
Molecular Dynamics Simulations
The stability of the binding poses of RAL within the predicted structures of the PDI–RAL complex was examined using molecular dynamics (MD) simulations. The complexes were prepared using CHARMM-GUI (https://charmm-gui.org/) to generate the necessary topology files [53]. The force field parameters for RAL were derived from the CHARMM general force field [54], while those for the protein were based on the CHARMM36m force field [55]. Each system was then placed in a rectangular water box, ensuring a solvent extension of 10 Å in all directions (x, y, z), and the TIP3P water model was employed [56]. To neutralize the system charges, K+ and Cl− ions, as parameterized by Beglov and Roux [57], were introduced. An energy minimization process consisting of 10,000 steps was conducted, followed by an equilibrium simulation of 0.25 ns in an NVT ensemble and a production simulation of 100 ns in an NPT ensemble using NAMD [58]. The time step was set to 2 fs, and the temperature was maintained at 300 K using Langevin dynamics [59]. Periodic boundary conditions were applied, and short-range electrostatic and van der Waals interactions were smoothly truncated with a cutoff of 12 Å, employing a switching function at 10 Å. Long-range electrostatic interactions were evaluated using the particle mesh Ewald algorithm [60, 61]. Pressure in the NPT ensemble was kept at 1 atm via the Langevin piston method [62]. To validate the significance of His256 and to assess the relative stability of the predicted binding poses, the number of hydrogen bonds formed between RAL and PDI, as well as the binding energies along the MD trajectories, was calculated.
In Vivo Animal Experiments and Drug Treatments
All animal procedures in this study were approved by the Institutional Animal Care and Use Committee (IACUC) of The Chinese University of Hong Kong, Shenzhen (October 28, 2021; CUHKSZ-AE2021002). The guidelines for humane care of animals established by the US National Institutes of Health were followed. Male mice (6–8 weeks old, weighing 20–30 g) were obtained from Guangdong Charles River Laboratories (Beijing, China). Upon arrival, the animals were allowed to acclimate for at least 1 week before the experiments began and then randomly assigned to treatment groups (n = 6) with comparable average body weights.
Kainic acid (3 µL of 0.2 mM in saline) was injected bilaterally into the left and right lateral ventricles using a microliter syringe under anesthesia (Zoletil 50 and xylazine, 50 mg/kg, and 5 mg/kg i.p., respectively). Control mice received an equivalent volume of vehicle only (3 µL of saline). The stereotactic injection coordinates were anterior/posterior, − 0.5 mm; lateral, ± 1.1 mm; and dorsal/ventral, 2.7 mm.
Following kainic acid injection, the mice were monitored for 1–2 h. Successful injections typically induced generalized convulsions and spasms, which diminished after a few minutes. Although mortality can occur in isolated cases, no mice were excluded from follow-up measurements based on established scoring criteria. All mice that survived the injection and exhibited convulsions and spasms were used for subsequent experiments. RAL was administered via intraperitoneal (i.p.) injection at a concentration of 1.25 mg/mL (100 μL solution of 10% DMSO and 90% corn oil) every 2 days, corresponding to a dose of approximately 5 mg/kg body weight. The first dose of RAL was given 24 h before the kainic acid injection, and treatment continued for 11 days. Control mice received equivalent i.p. injections of 100 μL vehicle (10% DMSO and 90% corn oil).
Memory and Learning Ability Tests
The first test employed in this study was the classical Y-maze method, designed to assess memory impairments in mice following various treatments [63, 64]. Testing began 6 days after kainic acid injection. The Y-maze, made of polyvinyl plastic, consists of three arms of equal length (30 cm), width (5 cm), and height (15 cm) with equal angles between them. As shown in Fig. 8B, each test began by placing the mouse at the end of one arm, and the sequence and number of arm entries were recorded manually. Based on previous studies [63, 64], an alternation, defined as entering all three arms in succession (e.g., ABC, CAB, BCA but not ABA, BAB, or CBC), was used to assess short-term memory. Between tests, the maze was cleaned with 70% ethanol to remove odors and residues. The alternation score (%) for each mouse was calculated using the following formula [65]:
% alternation = [(number of alternations)/(total arm entries − 2)] × 100.
In addition to the classical test, a newly developed Y-maze-based method was used to further evaluate learning ability and memory impairment in the same animals. Testing for this method began on day 10 post-kainic acid injection (see Fig. 8A). Mice, including controls, were food-restricted 24 h prior to testing, receiving 2–3 g of pellet food on average. As depicted in Fig. 8B, food was placed in one of the maze arms as bait. Mice were placed in the starting arm and allowed to freely explore the maze to find and eat the food. After each trial, the mouse was placed back at the starting position, and the test was repeated. If the mouse immediately located the food, it was considered to have correctly remembered its location.
To assess learning and memory, the number of incorrect entries made during the first 20 trials (10 trials per day over two consecutive days) and the time taken to find and consume the food in each trial were recorded. To minimize random variation, trials were grouped in sets of three. The average for trials 1–3 was used as the first measurement, trials 4–6 as the second, and so on, with the average of trials 19 and 20 used as the final measurement.
Fluorescent and Histochemical Staining of the Brain Sections
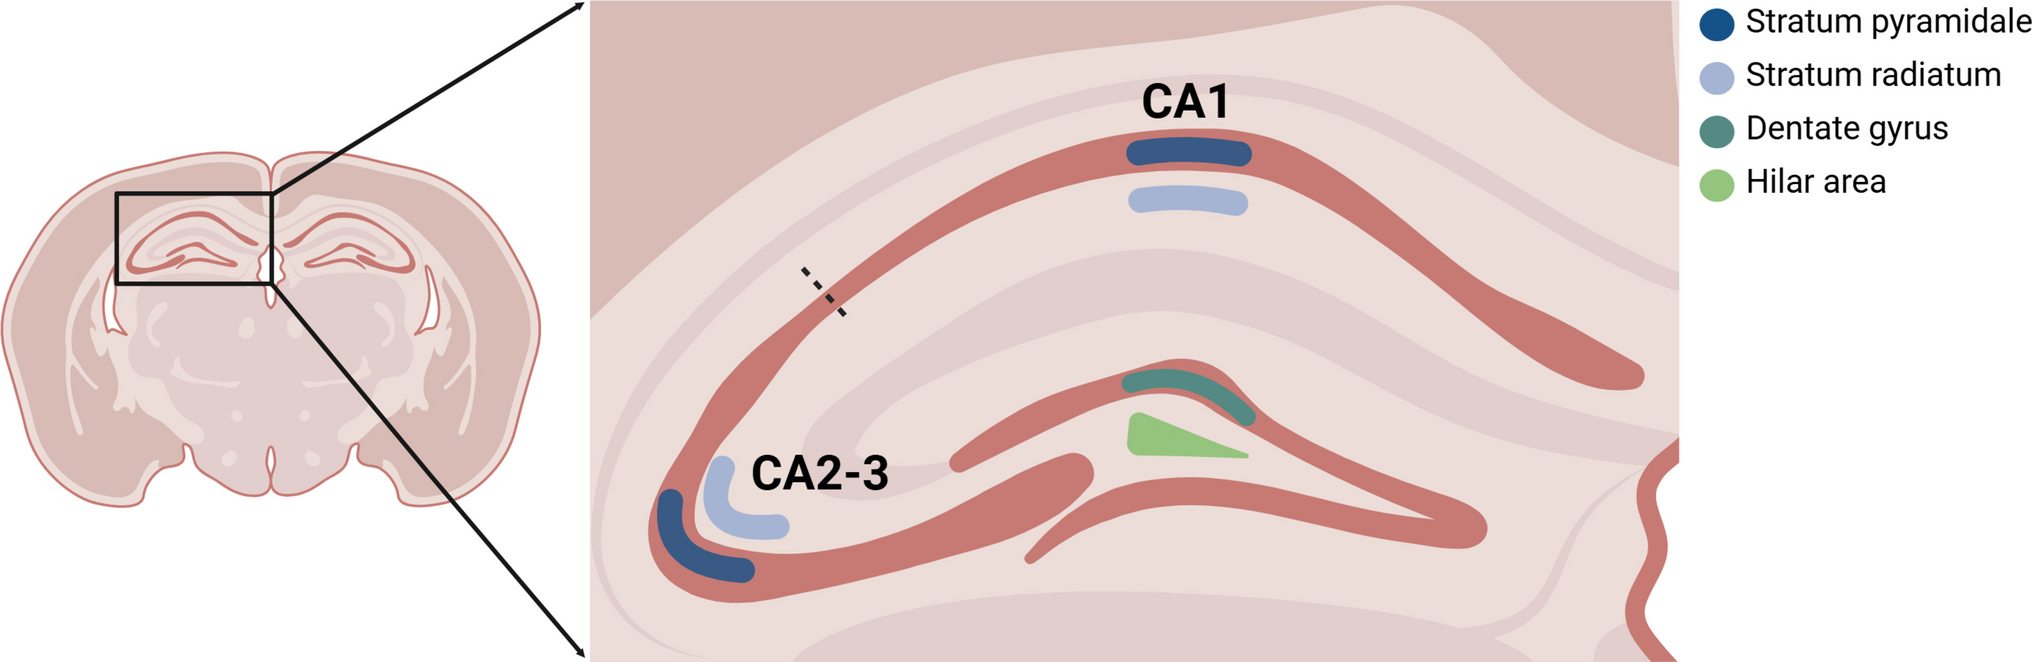
To perform fluorescent and histochemical staining of brain sections, animals from different treatment groups were sacrificed on day 6 following kainic acid injection. Prior to tissue collection, the animals were anesthetized with ketamine and xylazine (50 mg/kg and 5 mg/kg, i.p., respectively) and then perfused via the abdominal aorta with physiological saline (0.9% NaCl) followed by 4% paraformaldehyde. The brain tissues were collected and fixed overnight in 4% paraformaldehyde. After cryoprotection in 30% sucrose/phosphate buffer, the brains were frozen in liquid nitrogen and sectioned at 30-µm thickness. The sections were collected in 0.1 M neutral phosphate buffer, mounted on slides, air-dried on a slide warmer at 50 °C for at least 30 min, and stained with hematoxylin and eosin (H/E) for histological analysis. Bilateral hippocampal regions (CA1, CA3, and the dentate gyrus DG) were examined as described earlier [66]. Apoptotic DNA degradation in the brain tissue was assessed using the terminal deoxynucleotidyl transferase (TdT)–mediated dUDP-biotin nick end labeling (TUNEL) method, following the manufacturer’s instructions (Biosharp, China). Fluoro-Jade B staining was also conducted according to the supplier’s protocol (Biosensis, Australia). Briefly, slides were incubated in 0.06% potassium permanganate for 10 min on a shaker. The Fluoro-Jade B staining solution, prepared from a 0.1 mg/mL stock solution in distilled water, was applied for 10 min, after which the slides were rinsed and dried on a slide warmer. Images were captured using a light microscope (Carl Zeiss Corporation, Germany), and cell counting was performed with ImageJ software.
Statistical Analysis
Most of the experiments described in this study were repeated three times or more to confirm the observations. Data presented in this study are the mean ± S.D. from multiple replicate measurements taken from one representative experiment. Statistical analyses were performed using the GraphPad Prism 7.0 software (GraphPad Software, La Jolla, CA) by using one-way ANOVA coupled with follow-up tests for multiple comparisons. Statistical significance was denoted by P < 0.05 (* or #) and P < 0.01 (** or ##) for significant and very significant differences, respectively. In most cases, * and ** denote the comparison for statistical significance between the control group (cells treated with the vehicle only) and the cells treated with a cell death inducer (such as erastin or RSL3), whereas # and ## denote the comparison between the cells treated with the cell death inducer alone and the cells jointly treated with the cell death inducer plus a modulating compound (such as RAL).


Comments (0)