Animals
Adult BALB/c mice (6 to 8 weeks) were purchased from the Skbex Biotechnology (Henan Province, China). The temperature of the breeding environment was 23 to 25 °C, the humidity was 50 ± 10%, and the photoperiod was 12/12 h. During the feeding period, the mice had ad libitum access to movement, food, and water. All procedures of animal studies were in accordance by institutional regulations and with the approval of the Laboratory Animal Welfare & Ethics Committee of Fujian Medical University (IACUC FJMU 2024-Y-0915).
LPS-induced BK Model and AZD6738 Treatment
Mice were anesthetized using 2% isoflurane inhalation to ensure consistent anesthesia during the procedure. Then, 0.5% tetracaine eye drops (Zhongshan Ophthalmic Center, Sun Yat-Sen University, Guangzhou, China) were applied to all eyes to provide additional local anesthesia. Lipopolysaccharides (LPS, Cat No. HY-D1056, from E. coli O55:B5; MedChemExpress, NJ, USA) was diluted to a working concentration of 1 mg/mL in sterile saline. A precise 2 μL volume of the LPS solution was injected into the central corneal stroma using a 33G Hamilton syringe equipped with a 32G Small RN needle (Model 701 RN SYR; Hamilton Co., Reno, NV, USA) as previously described [13, 23]. The contralateral eye served as a control and was injected with 2 μL of sterile PBS. An experienced ophthalmologist performed all operations.
AZD6738 (Cat No. HY-19323; MedChemExpress, NJ, USA) was dissolved in dimethyl sulfoxide (DMSO) and further diluted in the saline to achieve the working concentrations. A 100-μM dose was selected without adverse effects at this dose based on a preliminary study. Saline for treatment also contained 0.1% DMSO. Immediately after surgery, a 10 μL subconjunctival injection of either saline or 100 μM AZD6738 was administered. Daily treatment began on day 1, with four-times daily (qid) topical administration of 1 drop of saline or 100 μM AZD6738 for a duration of 48 h. Mice were randomly assigned to one of four experimental groups: (1) PBS + Saline group; (2) PBS + AZD6738 group; (3) LPS + Saline group; (4) LPS + AZD6738 group.
Mice were evaluated at 24 and 48 h post-surgery(N [number of animals] = 13 to 14 per group, one mouse from the PBS + Saline group and PBS + AZD6738 group respectively died after injection). Clinical examination of the anterior segment of the eye was performed using slit-lamp biomicroscopy (S350, Shanghai Medi Works Precision Instruments, Hangzhou, China), and representative images were captured to document corneal opacity, edema, neovascularization, and inflammation. Photographs were taken at each observation time point using a mounted digital camera, and the severity of keratitis was graded using a clinical scoring system [24, 25].
Histopathologic Examination
Mice were euthanized 48 h after treatment by cervical dislocation, and the treated eyes were immediately enucleated. The eyes were fixed in formaldehyde, acetic acid, and saline (FAS) fixative (Wuhan Servicebio, Wuhan, China) for 48 h, embedded in paraffin, and cut into serial 4 µm-thick tissue sections. For each eye sample, sections from the corneal apex to the optic nerve plane were used for hematoxylin and eosin (HE) staining to visualize cellular and tissue structures, Masson’s trichrome staining was performed to assess collagen expression (N = 8 per group), and Tnf-α staining to evaluate the degree of inflammation in the cornea (N = 4 per group). Images were captured using a Leica DM4 microscope (DM400B; Leica, Wetzlar, Germany) and analyzed with ImageJ software. Measurements were taken for total corneal thickness, epithelial thickness, and stromal thickness in the central corneal region, and cell counts in the corneal stroma were performed within the field of view. Collagen expression in the corneal stoma was quantified using the collagen volume fraction (CVF), calculated as the ratio of blue-stained tissue area to the total area (%). The degree of DAB which presents the cornea Tnf-α expression was quantified by IHC Toolbox (https://imagej.nih.gov/ij/plugins/ihc-toolbox/index.html) [26] and calculated as the average optical density.
Cell Culture and Treatment Paradigms
The RAW264.7 cells (Saibaikang Biotechnology Co., Shanghai, China) were cultivated at 37℃ in a 5% CO2 incubator in different culture systems (iCell-m047-001b, iCell Bioscience Inc.) which were replaced once a day. Cells at passage 3 to 6 were used in this study. The cells were treated with 0.1, 0.5, 1, 2.5, 5 μM AZD6738 (Cat No. HY-19323; MedChemExpress, NJ, USA), 0.1% DMSO (diluted with cell culture medium) and 1 mg/ml LPS for 24 h. The blank control group was set in all experiments, cells were treated with a culture medium only. AZD6738 was dissolved in DMSO, while LPS was dissolved in distilled water. All the drugs were further diluted in the cell culture medium to reach their working concentrations. The final concentration of DMSO in all groups did not exceed 0.1%. The morphology images of RAW264.7 were taken under a Leica DM4 microscope. Under the same field of view, identified the RAW264.7 cells with pseudopodia and calculated their ratio to the total number of cells in the field (n = 6 per group).
Cell Viability Analysis
Cell Counting Kit-8 (CCK-8) assay kit (Dojindo Molecular Technologies, Kumamoto, Japan) was used to detect cell viability. RAW264.7 were seeded in 96-well plates at 5 × 10³ cells per well and treated with 0.1, 0.5, 1, 2.5 and 5 µM AZD6738 or 1 mg/ml LPS for 24 h, respectively. Three replicate wells were repeated for each group. The original culture medium was discarded and a new Opti-MEM reduced serum medium (31985062; ThermoFisher, NY, USA) containing 10 µl CCK-8 reagent was added to each well. After incubation for 3 h, the absorbance was measured at 490 nm.
Electron Microscopy
RAW264.7 seeded in two 24-well plates were collected 24 h after 2.5 μM AZD6738 treatment. For transmission electron microscope, prefixed with a 3% glutaraldehyde, then the tissue was postfixed in 1% osmium tetroxide, dehydrated in series acetone, infiltrated in Epox 812 for a longer, and embedded. The semithin sections were stained with methylene blue and Ultrathin sections were cut with a diamond knife, stained with uranyl acetate and lead citrate. Sections were examined with JEM-1400-FLASH Transmission Electron Microscope (JEOL Ltd., Japan). For scanning electron microscope, the cell climbing slices samples were dehydrated with graded alcohol, and then the slides were adhered to the conductive glue, observed under an Inspect Scanning Electron Microscope (FEI Co., Hillsboro, OR, USA) after ion sputtering.
Measurement of Reactive Oxygen Species
Reactive oxygen species (ROS) were detected using an OxiSelect™ In Vitro ROS/RNS Assay Kit (LOT: 7081363, Cell Biolabs, Inc., San Diego, CA, USA). RAW264.7 were cultured and treated with 1 mg/ml LPS and 2.5 μM AZD6738 for 24 h in 48-well plates, and then stained with DCFH-DA at 37 °C for 30 min (n = 3 per group). After three washes with PBS, the intensity of the fluorescence was measured using a fluorescence microscope, the result was analyzed by ImageJ and quantified by relative fluorescence intensity.
Total NAD Quantification
Total NAD levels were measured using a NAD/NADH quantification kit (S0175; Beyotime Biotechnology Co., LTD, Shanghai, China) according to the manufacturer’s instructions. RAW264.7 cells treated with 1 mg/ml LPS and 2.5 μM AZD6738 for 24 h were lysed using the provided lysis buffer, and the lysates were centrifuged at 12,000 × g for 10 min at 4 °C to remove cellular debris. The supernatants were used for the quantification of total NAD. The detection was based on an enzymatic cycling reaction, where NAD was converted into a formazan product measurable at 450 nm. A standard curve was generated using known concentrations of NAD, and the results were normalized to protein content determined by a BCA assay (n = 3 per group).
Propidium Iodide (PI) and TUNEL Analysis
PI staining was performed to identify and quantify dead cells. After being treated with 1 mg/ml LPS and 2.5 μM AZD6738 for 24 h, RAW264.7 cells were washed twice with PBS and resuspended in 500 μL of PI staining solution containing 50 μg/mL PI in PBS. The suspension was incubated at room temperature for 15 min in the dark to allow PI to penetrate the membranes of dead cells. After incubation, cells were washed again with PBS and placed on glass slides. Fluorescence microscopy (DM400B; Leica, Wetzlar, Germany) was used to observe PI-positive (PI + , red-stained) cells, indicating dead cells. The number of PI + cells was calculated in each randomly field (n = 3 per group).
For TUNEL analysis, cells were fixed with 4% PFA at room temperature (RT) for 10 min and further incubated with 1% Triton X-100 at RT for 2 min (n = 4 per group). Then, cells were processed with a TUNEL kit (11684817910; Roche, Switzerland) according to the product manual and further counterstained with DAPI for 5 min and visualized under a fluorescence microscope.
Immunofluorescence Analysis
Mouse eye paraffin sections were dewaxed by xylene and gradient concentrations of ethanol (N = 4 per group). After antigen repair by sodium citrate, the sections prepared as mentioned above were blocked with 10% BSA at RT for 1 h after and incubated at 4 ℃ overnight with the anti-CD31 (ab28364, rabbit polyclonal antibody, 1:200; Abcam, Cambridge, MA, USA), anti-F4/80 (ab6640, rabbit polyclonal antibody, 1:200; Abcam, Cambridge, MA, USA) and anti-α-Sma (ab108424, rabbit monoclonal antibody, 1:100; Abcam, Cambridge, MA, USA). Then, sections were incubated with Alexa Fluor 594 goat anti-rabbit (1:1000; Invitrogen, Carlsbad, CA, USA) and further counterstained with DAPI for 5 min and observed under a fluorescence microscope. The fluorescence intensity in the corneal stroma area was quantified by using ImageJ and relative to the PBS + Saline group.
RAW264.7 cells were seeded in round cover slips to obtain cell climbing slices. After treatment, cell climbing slices were fixed with 4% PFA at RT for 10 min and further incubated with 5% BSA and 0.5% Triton X-100 at RT for 1 h (n = 4 to 5 per group). For immunofluorescence, cells were incubated at 4℃ overnight with the primary antibodies against Cleaved-Caspase3 (9661, rabbit monoclonal antibody, 1:200; Cell Signaling Technology, Danvers, MA, USA), COX-4 (ab16056, rabbit polyclonal antibody, 1:200; Abcam, Cambridge, MA, USA), FN (ab45688, rabbit monoclonal antibody, 1:200; Abcam, Cambridge, MA, USA), and RhoA (2117, rabbit monoclonal antibody, 1:200; Cell Signaling Technology, Danvers, MA, USA) followed by incubation with Alexa Fluor 488/594 goat anti-rabbit (1:1000; Invitrogen, Carlsbad, CA, USA). For F-actin staining, cells were incubated with Rhodamine-phalloidin (PHDR1, 1:1000; Cytoskeleton, Denver, CO, USA) at RT for 30 min. Subsequently, the cell climbing slices were taken out and counterstained with DAPI (F6057-20ML, Sigma, MO, USA) for 5 min, and observed under a fluorescence microscope. The results were quantified by ImageJ as relative fluorescence intensity.
Quantitative PCR
After LPS corneal stromal layer injection and treatment by 100 μM AZD6738 as previously described, cornea tissues were cut annularly from the eye. RAW264.7 cells seeded in two 12-well plates were collected after being treated with 1 mg/ml LPS and 2.5 μM AZD6738 for 24 h. Total RNA was extracted from cornea tissue and RAW264.7 cells with Trizol Reagent (Invitrogen, CA, USA). The absorbance values of RNA at OD 260 were detected using a spectrophotometer (Biophotometer plus, Eppendorf, Germany) to calculate the RNA content, and reverse transcription reactions were conducted using a kit (RevertAid First Strand cDNA Synthesis Kit; Fermentas, Thermo Fisher Scientific, Pittsburgh, PA, USA). SYBR Green Real-Time PCR Master Mix (Toyobo, Osaka, Japan) was used for quantitative real-time PCR (qPCR) on a Rotor-Gene Q cycler (QIAGEN, Germantown, MD, USA). Each reaction was run in triplicate. Transcript abundance was reported as relative to GAPDH levels and was calculated using the 2−ΔΔCt method. qPCR was performed in three technical replicates on each biological replicate. The primer pairs used in this study are listed as follows: Atr sense, GAATGGGTGAACAATACTGCTGG; antisense, TTTGGTAGCATACACTGGCGA; Chk1 sense, ATATGAAGCGTGCCGTAGACT; antisense, TGCCTATGTCTGGCTCTATTCTG; Il-1b sense, GCAACTGTTCCTGAACTCAACT; antisense, ATCTTTTGGGGTCCGTCAACT; Il-6 sense, TAGTCCTTCCTACCCCAATTTCC; antisense, TTGGTCCTTAGCCACTCCTTC; Tnf-α sense, CCCTCACACTCAGATCATCTTCT; antisense, CCCTCACACTCAGATCATCTTCT; Fn1 sense, CGGTGGCTGTCAGTCAAAG; antisense, AAACCTCGGCTTCCTCCATAA; Mmp1a sense, AACTACATTTAGGGGAGAGGTGT; antisense, GCAGCGTCAAGTTTAACTGGAA; Vim sense, CGTCCACACGCACCTACAG; antisense, GGGGGATGAGGAATAGAGGCT; Lama1 sense, CAGCGCCAATGCTACCTGT; antisense, GGATTCGTACTGTTACCGTCACA; Mcp1 sense, GAGGACAGATGTGGTGGGTTT; antisense, AGGAGTCAACTCAGCTTTCTCTT; Nlrp3 sense, ATTACCCGCCCGAGAAAGG; antisense, TCGCAGCAAAGATCCACACAG; Bax sense, CCCGAGAGGTCTTTTTCCGAG; antisense, CCAGCCCATGATGGTTCTGAT; Bcl2 sense, GGTGGGGTCATGTGTGTGG; antisense, CGGTTCAGGTACTCAGTCATCC; Vegfa sense, AGGGCAGAATCATCACGAAGT; antisense, AGGGTCTCGATTGGATGGCA; Nf-κb (Nfkb1) sense, ATGGCAGACGATGATCCCTAC; antisense, TGTTGACAGTGGTATTTCTGGTG; P53 sense, CAGCACATGACGGAGGTTGT; antisense, TCATCCAAATACTCCACACGC; Akt sense, AGCGACGTGGCTATTGTGAAGT; antisense, GCCATCATTCTTGAGGAGGAAGT; Gapdh sense, ACAGTCAGCCGCATCTTCTT; antisense, ACGACCAAATCCGTTGACTC.
Western Blot
Cornea tissues were harvested after treatment. HTMCs seeded in two 12-well plates were collected after being treated with 1 mg/ml LPS and 2.5 μM AZD6738 for 24 h. Total proteins were extracted from cornea tissue and RAW264.7 cells using radioimmunoprecipitation assay (RIPA) lysis buffer (CWBio, Beijing, China) containing a 1% protease inhibitor cocktail (Sigma-Aldrich). After incubation on ice for 30 min, debris was removed by centrifugation (13,000 rpm) at 4 °C and protein concentration was quantified by BCA assay. Proteins were diluted in 5 × loading buffer and denatured at 98 °C for 3 min. 20 μg protein samples were fractionated by SDS-PAGE using the commercial polyacrylamide gel (Bio-Rad, Hercules, CA, USA) and transferred onto a polyvinylidene fluoride membrane (Millipore, Burlington, MA, USA). Membranes were blocked in 5% nonfat dried milk in 1 × Tris-buffered saline with 0.1% Tween-20 (TBS-T) at room temperature for 1 h. Subsequently, membranes were incubated with the indicated primary antibodies against ATR (ab2905, rabbit polyclonal antibody, 1:1000; Abcam, cambridge, MA, USA), phosphorylated ATR (p-ATR, phospho S428, ab316925, rabbit monoclonal antibody, 1:1000; Abcam, cambridge, MA, USA), β-Catenin (ab32572, rabbit monoclonal antibody, 1:1000; Abcam, cambridge, MA, USA), F4/80 (ab6640, rabbit polyclonal antibody, 1:1000; Abcam, Cambridge, MA, USA), MMP9 (ab76003, rabbit monoclonal antibody, 1:1000; Abcam, Cambridge, MA, USA), phosphorylated endothelial NO synthase (p-eNOS, phospho T495; 9574, rabbit monoclonal antibody, 1:1000; Cell Signaling Technology, Danvers, MA, USA), Cleaved-Caspase3 (9661, rabbit monoclonal antibody, 1:1000; Cell Signaling Technology, Danvers, MA, USA), RhoA (2117, rabbit monoclonal antibody, 1:1000; Cell Signaling Technology, Danvers, MA, USA), and GAPDH (AF5718, goat polyclonal antibody, 1 mg/mL; R&D Systems, Minneapolis, MN, USA) overnight at 4 ℃. After washing with 1 × TBS-T for 30 min, membranes were incubated with corresponding secondary antibodies (1:10000; ZSGB-Bio) at RT for 1 h. Bands were visualized with a Fluor ChemE (ProteinSimple) and ImageJ was used to analyze the gray value of each protein band.
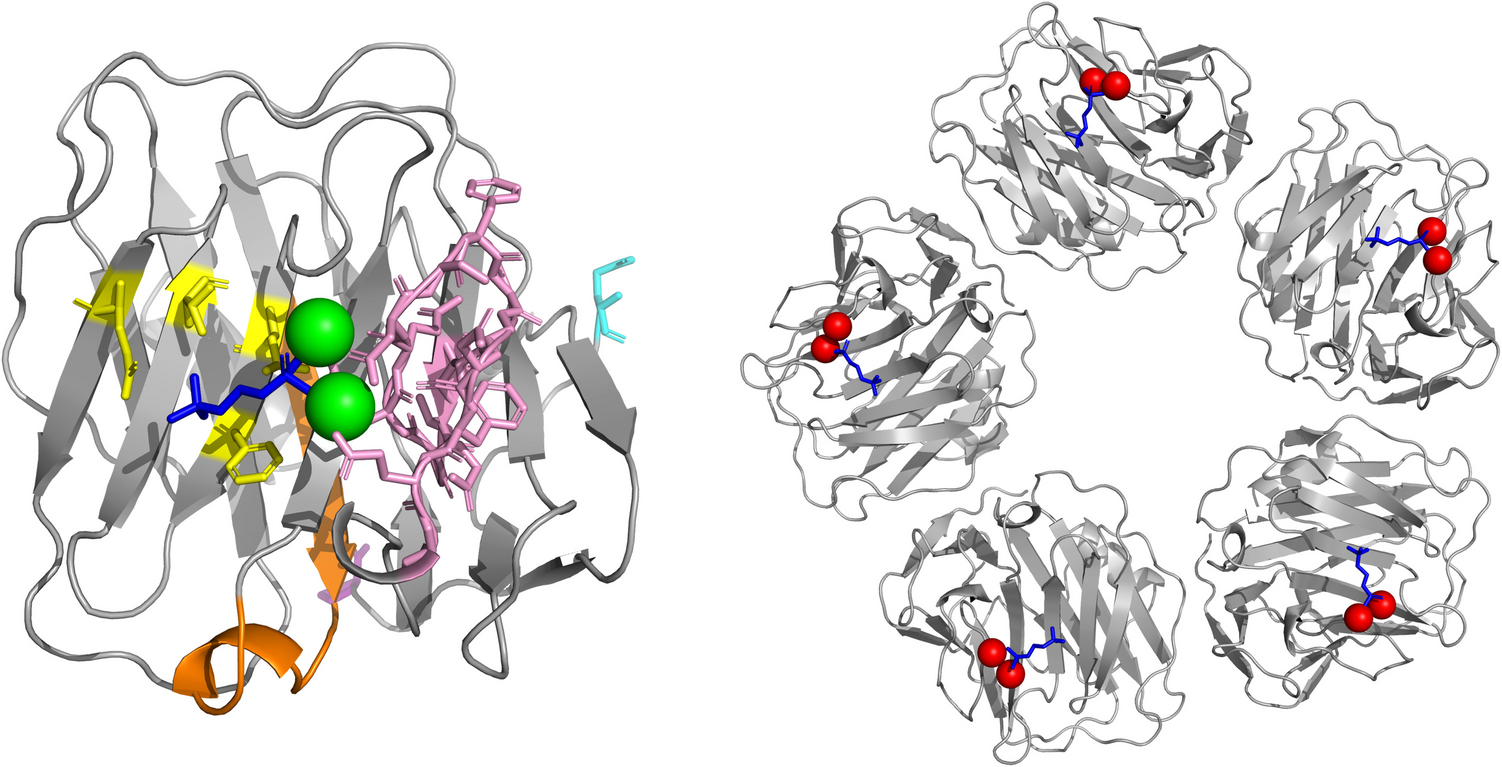
ATR-NFKB1 Docking Model and Protein–protein Network of Key Signaling Molecules
NFKB1 was used as the receptor and ATR as the ligand to establish the ATR-NFKB1 docking model using HDOCK (http://hdock.phys.hust.edu.cn). The model with the highest score, based on the shape-scoring function, was selected, and protein visualization was performed using PyMOL software (The PyMOL Molecular Graphics System, version 2.4.2).
To construct a protein–protein interaction (PPI) network and investigate the interactions of molecules related to ATR inhibitors and inflammation, key molecules previously validated as differentially expressed were submitted to the STRING database (https://cn.string-db.org/). A high-confidence score threshold (0.7) was applied to identify potential interactions among the selected genes. The obtained PPI data were then imported into Cytoscape software (version 3.9.1) for visualization and analysis. The edges between nodes represented predicted associations, including direct physical interactions and indirect functional interactions such as co-expression and pathway co-occurrence.
For protein–protein interaction enrichment analysis, the gene lists of interest were analyzed using the Metascape website (https://metascape.org). The analysis integrated data from multiple databases, including STRING, BioGrid, OmniPath, and InWeb_IM. Only physical interactions from STRING (physical score > 0.132) and BioGrid were considered. The resulting network was visualized to identify key interaction hubs and enriched pathways.
To generate the bar graph of enriched terms (Fig. 10D), Gene Ontology (GO) biological process enrichment analysis was conducted using Metascape. The results were ranked by significance (p-value), and the top-level biological processes and pathways were highlighted.
Statistics
All data were analyzed using SPSS 29 software (IBM-SPSS 29. 0. 0. 0; Chicago, IL, USA). One-way ANOVA was used for comparison among four or more groups in this study, followed by an LSD post hoc test for homogeneous variances or a Games-Howell post hoc test for non-homogeneous variances. A value of P < 0.05 was considered statistically significant. Variation is expressed as SEM.

Comments (0)