
Remember me
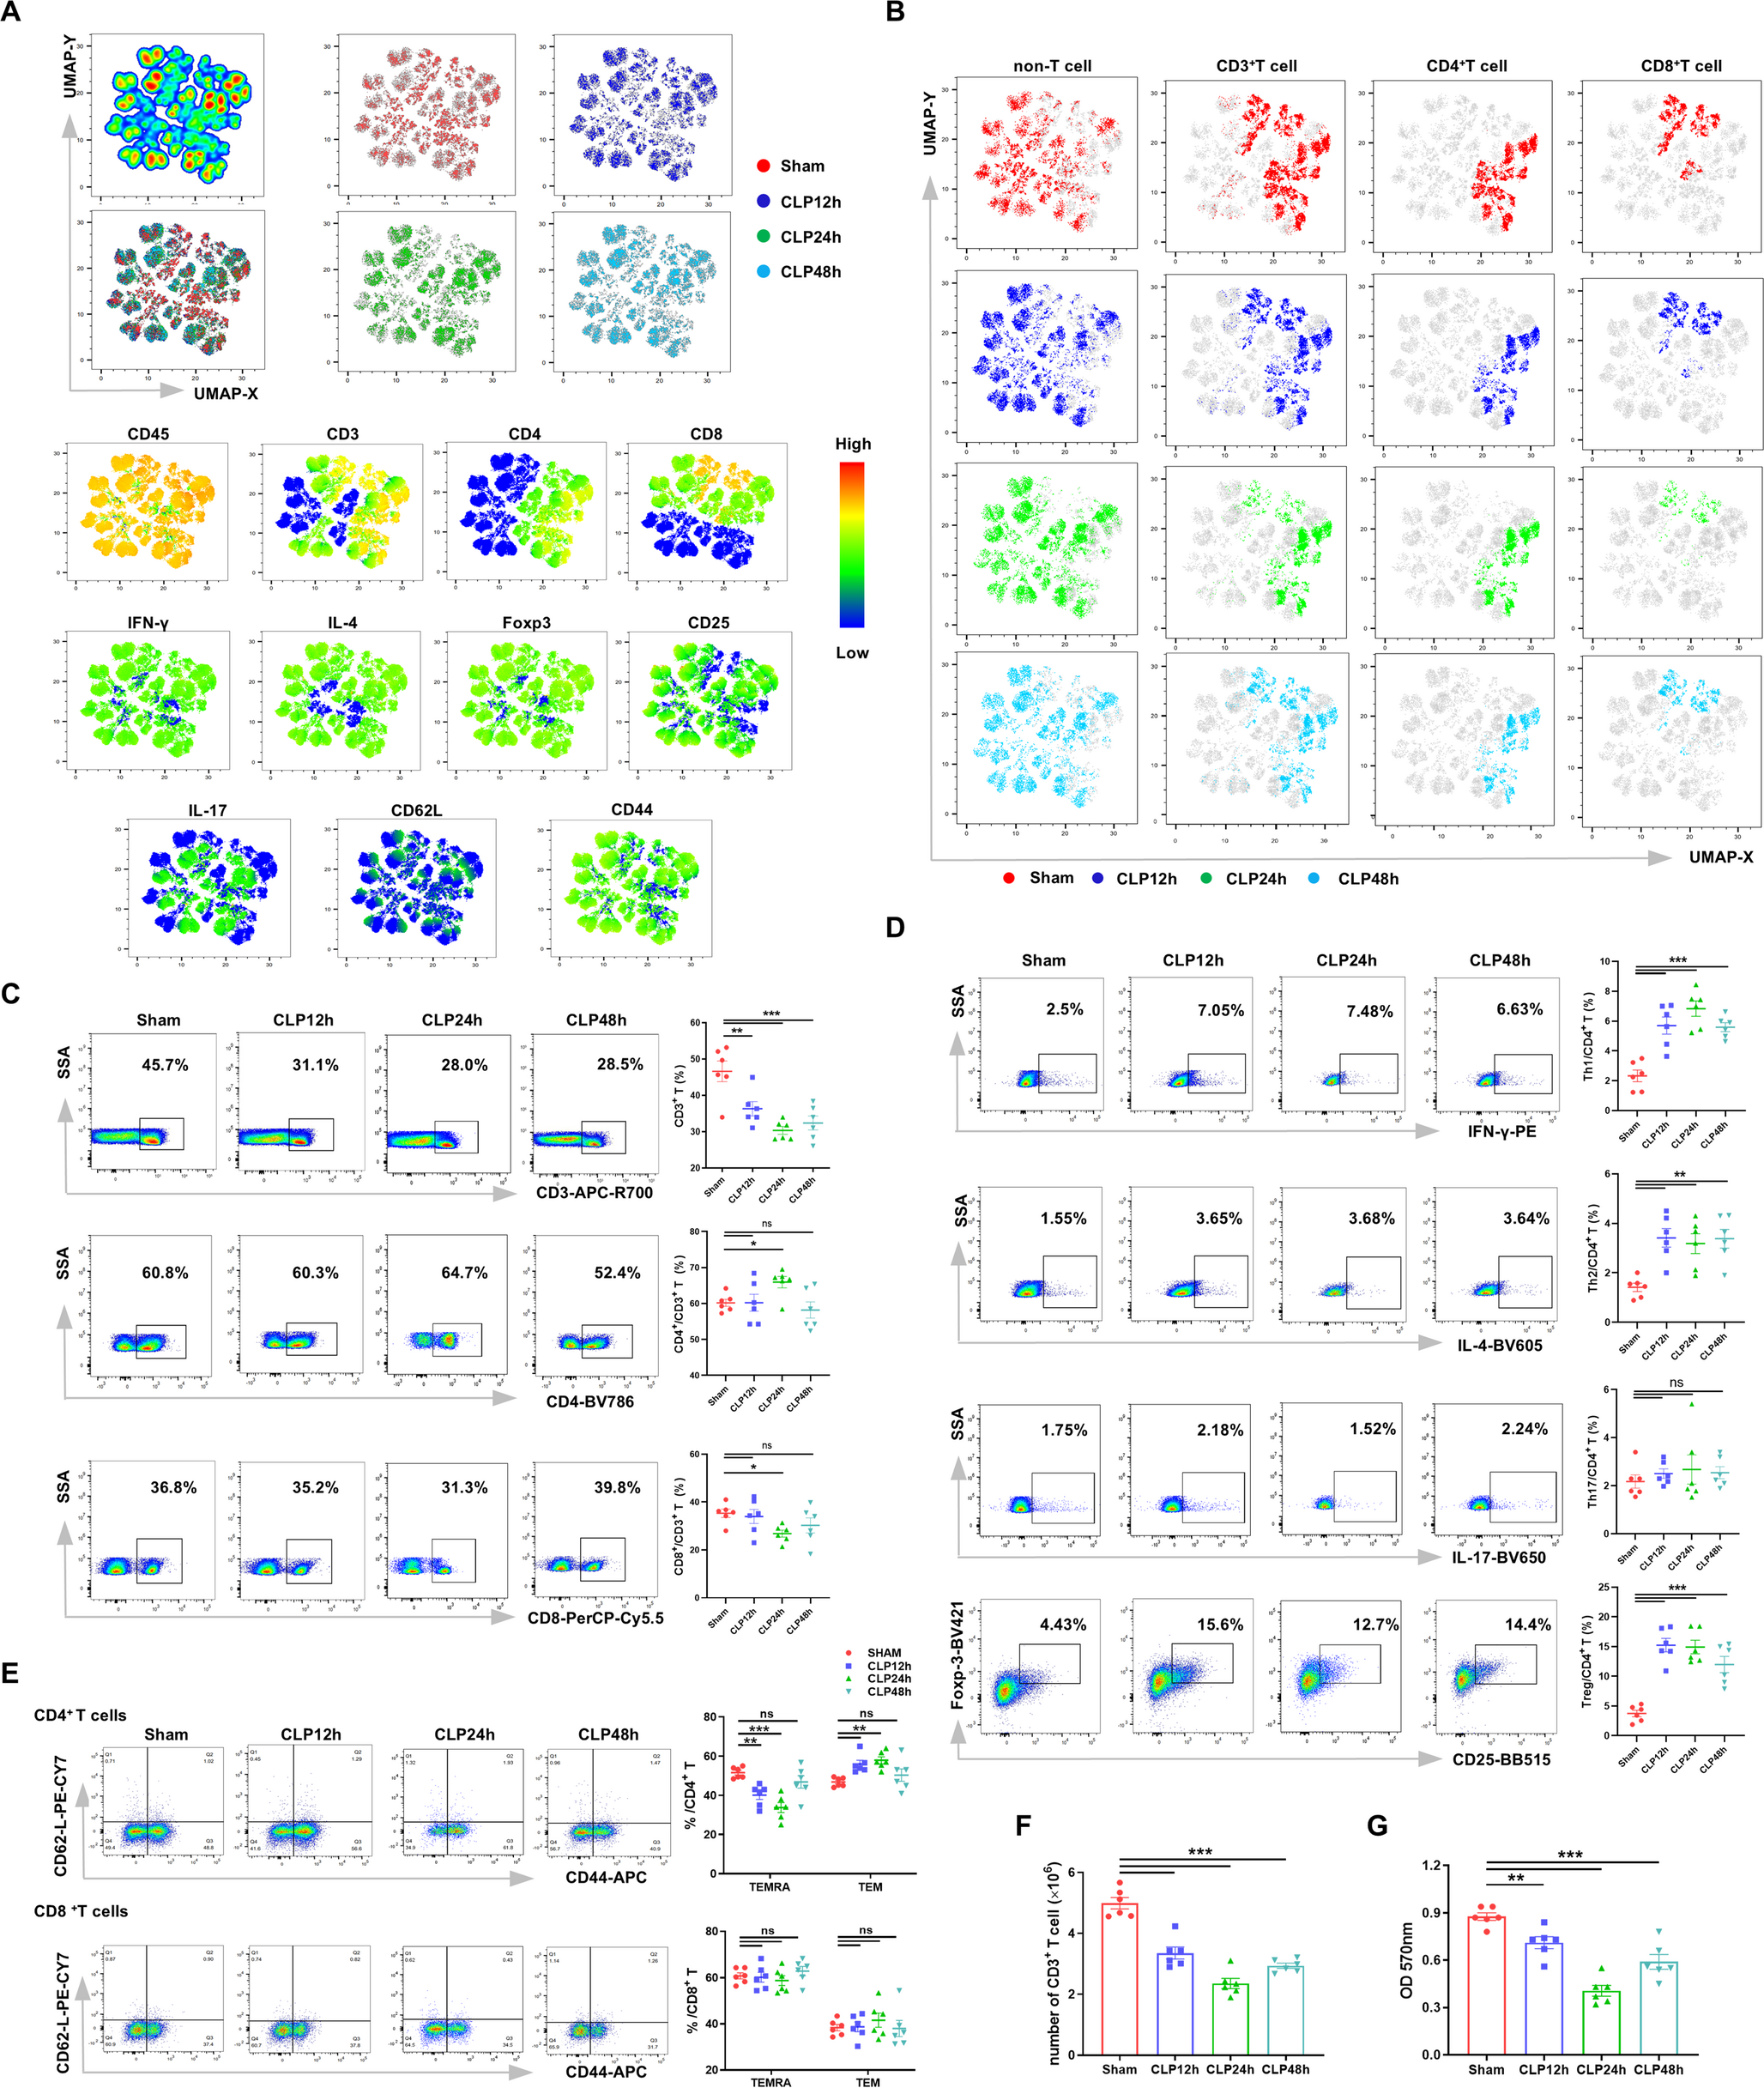
To understand the impact of sepsis on T cell differentiation and immune function, we constructed a CLP model to induce experimental sepsis. Splenic single-cell suspensions were obtained to evaluate the expression of T cell phenotype markers at different time points. Cells were clustered and visualized based on the expression of their surface markers using Uniform Manifold Approximation and Projection (UMAP) for dimensionality reduction [15]. Splenocytes were identified following UMAP-based dimensionality reduction (Fig. 1A). The surface markers of T cells (CD45, CD3, CD4, and CD8) were highly enriched and distinctly clustered. Meanwhile, IFN-γ, IL-4, CD25, Foxp3, and CD44 had lower expression levels, whereas IL-17 and CD62L had the lowest expression levels.
Fig. 1
Impaired differentiation and immunosuppression of T cells in septic mice. (A) UMAP plots showing the expression of various markers in splenic lymphocytes from sham-operated mice and septic mice at 12 h, 24 h and 48 h after CLP. (B) UMAP plots illustrating the dynamic changes in splenic lymphocyte populations in mice treated as described in (A). (C) Representative flow cytometry plots and statistical analysis of the proportions of CD3+ T cells, CD4+/CD3+ T cells, and CD8+/CD3+ T cells in mice treated as described in (A). (D) Representative flow cytometry plots and statistical analysis of the proportions of Th1 (CD4+IFN-γ+), Th2 (CD4+IL-4+) cells, Th17 (CD4+IL-17+) cells, and Tregs (CD4+CD25+Foxp3+) in mice treated as described in (A). (E) Representative flow cytometry plots and statistical analysis of the proportions of CD4+ TEM, CD4+ TEMRA, CD8+ TEM, and CD8+ TEMRA cells in mice treated as described in (A). (F) Quantification of CD3⁺ T cell counts in the spleens of mice treated as described in (A). (G) CD4⁺ T cell proliferation ability assessed using the MTT assay in mice treated as described in (A). Data were shown as mean ± SEM. ns, non-significance; *p < 0.05; **p < 0.01; ***p < 0.001
The proportion of different cell types in each group was shown in Fig. 1B, which showed that CD3+ T cells, CD4+ T cells, and CD8+ T cells were significantly reduced in septic mice. T cells were primarily categorized into CD3+CD4+ T cells and CD3+CD8+ T cells (the gating strategy was provided in Supplementary Fig. S1). As shown in Fig. 1C, the number of CD3+ T cells was significantly reduced in the CLP mice, which was consistent with other studies [16,17,18,19]. Meanwhile, we sorted out CD4+ T cells and CD8+ T cells from CD3+ T cells. Flow cytometry analysis showed that within the remaining CD3⁺ T-cell population, the proportion of CD4⁺ T cells increased, whereas CD8⁺ T cells decreased at 24 h post-CLP. Following activation, CD4⁺ T cells underwent differentiation into specialized subsets: Th1, Th2, Th17, and Tregs. Intriguingly, flow cytometry analysis revealed that the relative proportions of both Th1 and Th2 cells within the CD4⁺ T-cell population were significantly elevated in CLP mice compared to sham-operated animals (Fig. 1D), suggesting a dysregulated immune response during sepsis. No significant change was observed in the proportion of Th17 cells in the spleens of septic mice, while the proportion of Tregs was significantly increased. Then cells were classified into initial cells, central memory T cells, effector memory T cells (TEM) and terminally Differentiated Effector Memory T cells (TEMRA) by staining CD62L and CD44. Since CD62L was found to be largely unexpressed, we quantified the expression of CD4+ TEM, CD4+ TEMRA, CD8+ TEM, and CD8+ TEMRA cell populations. The proportion of CD4+ TEM was increased and CD4+ TEMRA was decreased after CLP, whereas the changes in the proportions of CD8+ TEM and CD8+ TEMRA were not significant (Fig. 1E). To further evaluate the immune function of T cells, we quantified the number of splenic CD3+T cells, as shown in Fig. 1F. Compared with the Sham group, the number of CD3+T cells in the CLP group was decreased, with the most pronounced decline observed at 24 h. The proliferation ability was a major indicator of T cell immune function. MTT was used to assess the proliferation ability of CD4+ T cells in vivo (Fig. 1G). Compared with the Sham group, the proliferation ability of the CLP group was decreased, and found to be most pronounced at 24 h. Collectively, these findings indicate impaired T-cell differentiation and immunosuppression in septic mice.
miR-182 Impairs T Cell Immune Function and Differentiation in Septic MiceTo investigate the role of miR-182 in sepsis, we assessed its expression levels in peripheral blood and splenic lymphocytes at 12 h, 24 h and 48 h after CLP induction. Our qPCR analysis revealed a significant upregulation of miR-182 in both peripheral blood and splenic lymphocytes in CLP-induced septic mice, with the highest expression detected at 24 h post-CLP (Fig. 2A, B). To further investigate whether elevated miR-182 contributed to the immunosuppression of CD4+ T cells, we evaluated the T cell subtypes, proliferative capacity, and cytokine expression in T cells isolated from WT mice and miR-182-/- mice after CLP treatment. The UMAP plots revealed increased populations of CD3+, CD4+, and CD8+ T cells in the splenic lymphocytes of miR-182−/− mice after CLP, compared to WT mice (Fig. 2C, D). Furthermore, flow cytometry analysis showed an increased in CD3+ T cells in the splenic lymphocytes of miR-182−/− mice after CLP (Fig. 2E). Compared to the WT-CLP group, the proportion of CD4+ T cells was increased, while that of CD8+ T cells was decreased in the miR-182−/−-CLP group. Moreover, knockout of miR-182 resulted in reduced proportions of Th1 cells, Th2 cells, Th17 cells, and Tregs following CLP treatment (Fig. 2F). We also evaluated the proportions of CD4+ TEMRA, CD4+ TEM, CD8+ TEMRA, and CD8+ TEM cells. As shown in Fig. 2G, there was no significant difference in the proportions of CD4+ TEMRA and CD4+ TEM cells between the miR-182−/−-CLP group and the WT-CLP group. However, the proportion of CD8+ TEMRA cells was increased while that of CD8+ TEM cells was decreased in miR-182−/− mice compared to the WT mice after CLP. The shift from CD8⁺ TEM to TEMRA subsets in miR-182−/− mice may reflect altered differentiation or survival of cytotoxic T lymphocytes, warranting further investigation. To further explore the impact of miR-182 knockout on T cell immune function, we measured the number of splenic CD3+ T cells. As shown in Fig. 2H, the number of CD3+ T cells was notably higher in the miR-182−/− -CLP group compared to the WT-CLP group. Additionally, T cell proliferation was assessed using the MTT assay. The results showed that miR-182 knockout enhanced T cell proliferation post CLP (Fig. 2I). Splenic Tregs were significantly reduced after knockout of miR-182 in septic mice. Therefore, we further investigated the effect of miR-182 on Tregs. Using flow cytometric sorting, we isolated CD4+CD25+ Tregs and CD4+CD25− Teff, with a purity of over 90% (Fig. 2J). Compared with the WT-CLP group, the ability of miR-182−/− CD4+CD25+ T cells to secrete IL-10 and TGF-β was significantly reduced (Fig. 2K, L). For proliferation assays, CD4⁺CD25⁺ Tregs and CD4⁺CD25⁻ effector T cells were co-cultured at a 1:10 ratio under ConA stimulation (5 µg/mL). Because CD4⁺CD25⁻ effector T cells are highly responsive to ConA-induced proliferation, while Tregs exhibit limited proliferative capacity under these conditions [20], the observed proliferation predominantly reflects the activity of CD4⁺CD25⁻ effector T cells. As shown in Fig. 2M, knockout of miR-182 reduced the immunosuppressive capacity of CD4⁺CD25⁺ Tregs, leading to enhanced proliferation of CD4⁺CD25⁻ Teff. Collectively, these results suggest that miR-182 mediated the immunosuppression of CD4+ T cells, especially Tregs, in septic mice.
Fig. 2
miR-182 impairs T cell immune function and differentiation in septic mice. (A) The mRNA expression levels of miR-182 in peripheral blood from sham-operated mice and septic mice at 12 h, 24 h and 48 h after CLP. (B) The mRNA expression levels of miR-182 in splenic lymphocytes from mice treated as described in (A). (C) UMAP plots showing the expression of various markers in splenic lymphocytes from miR-182−/− mice and WT mice at 24 h after CLP. (D) UMAP plots showing changes in splenic lymphocyte populations in mice treated as described in (C). (E) Representative flow cytometry plots and statistical analysis of the proportions of CD3+ T cells, CD4+/CD3+ T cells, and CD8+/CD3+ T cells in splenic lymphocytes from mice treated as described in (C). (F) Representative flow cytometry plots and statistical analysis of the proportions of Th1 (CD4+IFN-γ+) cells, Th2 (CD4+IL-4+) cells, Th17 (CD4+IL-17+) cells, and Tregs (CD4+CD25+Foxp3+) in splenic lymphocytes from mice treated as described in (C). (G) Representative flow cytometry plots and statistical analysis of the proportions of CD4+ TEM, CD4+ TEMRA, CD8+ TEM, and CD8+ TEMRA cells in splenic lymphocytes from mice treated as described in (C). (H) Total number of CD3+ T cells in the spleens of mice treated as described in (C). (I) CD4⁺ T cell proliferation assessed using the MTT assay in mice treated as described in (C). (J) Representative flow cytometry plots showing the gating strategy used to distinguish CD4+CD25+ Tregs and CD4+CD25− Teff. (K, L) Supernatant levels of IL-10 and TGF-β in cultured CD4+CD25+ Tregs from mice treated as described in (C). (M) CD4+CD25+ Tregs from mice treated as described in (C) were co-cultured with CD4+CD25− Teff at a ratio of 1:10 for 68 h, and the proliferation of cells within the co-culture system (primarily reflecting Teff proliferation) was assessed using the MTT assay. Data were shown as mean ± SEM. ns, non-significance; *p < 0.05; **p < 0.01; ***p < 0.001
Knockout of miR-182 Protects Septic MiceTo further investigate the effect of miR-182 knockout on organ pathology in septic mice, we collected lung and kidney tissues 24 h post-CLP. Histopathological changes were assessed using H&E staining. As shown in Fig. 3A, WT mice exhibited alveolar edema, hemorrhage, and inflammatory cell infiltration in the lungs 24 h post-CLP, whereas miR-182−/− mice showed less severe lung injury. Similarly, Fig. 3B showed that, compared to the WT-CLP group, miR-182−/− mice displayed less severe kidney pathology 24 h post-CLP, with less disruption of the renal tubular structure, reduced glomerular swelling, and fewer infiltrating inflammatory cells. Furthermore, survival rates were evaluated in both groups post-CLP (Fig. 3C), and the miR-182−/−-CLP group had a significantly higher survival rate than the WT-CLP group, suggesting better resistance to septic shock. These findings support the idea that miR-182 deficiency mitigates sepsis-induced organ damage and improves survival in mice.
Fig. 3
Knockout of miR-182 protects septic mice. (A) H&E staining of lung tissues from miR-182−/− mice and WT mice 24 h post-CLP. (B) H&E staining of renal tissues from mice treated as described in (A). (C) Survival rates of mice treated as described in (A) over 96 h post-CLP. Data were shown as mean ± SEM. ns, non-significance; *p < 0.05; **p < 0.01; ***p < 0.001
Integrated Metabolomic and Proteomic Profiling of CD4+ T Cells in miR-182 Knockout Septic MiceTo explore the potential mechanism by which miR-182 regulates T cells, we employed a combined metabolomic and proteomic analysis of purified CD4+ T cells. Orthogonal partial least squares discriminant analysis (OPLS-DA) of metabolomic data revealed a distinct separation between WT and miR-182⁻/⁻ groups (Fig. 4A). A total of 465 metabolites were detected in positive-ion mode. Using P < 0.05 and variable importance in projection (VIP) > 1 as the significance criteria, 31 metabolites were identified as significantly different between the two groups (Fig. 4B, C). Notably, the level of 1-methylhistamine was significantly lower in the miR-182−/− group compared to the WT group (p = 0.0124, Fig. 4D). Pathway analysis of the differentially expressed metabolites (DEMs) identified histidine metabolism, tryptophan metabolism, and aminoacyl-tRNA biosynthesis as the most enriched pathways (Fig. 4E). To gain a comprehensive understanding of the effect of miR-182 on CD4+ T cells, we further performed proteomic analyses. A total of 2044 proteins were detected, among which 49 were significantly upregulated and 58 were downregulated in the miR-182−/− group (p < 0.05, fold-change < 0.83 or > 1.2) (Fig. 4F, G). Interestingly, histidine ammonia-lyase (HAL) and acetaldehyde dehydrogenase-1 (ALDH1A1) were significantly reduced in the miR-182−/− group compared to the WT group (Fig. 4H, I). To explore the relationship between metabolites and proteins, we performed a multi-omics analysis integrating proteomic and untargeted metabolomics data. We found that the two differentially expressed proteins, HAL and ALDH1A1, along with the differentially expressed metabolite 1-methylhistamine, were closely associated with histidine metabolism (Fig. 4J). KEGG pathway analysis further revealed that the knockout of miR-182 impaired histidine catabolism, suggesting histidine accumulation in miR-182⁻/⁻ mice (Fig. 4K-M). Finally, we validated these findings via Western blot and ELISA. The expression levels of histidine decarboxylase (HDC), HAL, and ALDH1A1 were lower in the miR-182−/− group compared to the WT group (Fig. 4N-Q), whereas histidine levels in the cell supernatant were elevated (Fig. 4R). In summary, these data demonstrate that miR-182 modulates CD4+ T cell function through histidine metabolism.
Fig. 4
Metabolomic and proteomic profiling of CD4+ T cells following miR-182 knockout in septic mice. (A) OPLS-DA score plots of CD4+ T cells from miR-182−/− and WT mice in positive-ion mode (left) and negative-ion mode (right). (B) Volcano plot based on DEMs in CD4+ T cells from mice described in (A). (C) Heatmap displaying the relative abundance of 31 key metabolites identified in CD4+ T cells from mice described in (A). (D)Relative levels of 1-Methylhistamine in CD4+ T cells from mice described in (A). (E) Pathway analysis of key metabolites in CD4+ T cells from mice described in (A). (F) Volcano plot showing differentially expressed proteins in CD4+ T cells from mice described in (A). (G) Heatmap displaying the relative abundance of 107 key proteins identified in CD4+ T cells from mice described in (A). (H, I) Violin plots showing the expression levels of HAL and ALDH1A1 in CD4+ T cells from mice described in (A). (J) Schematic representation of the histidine metabolism pathway, highlighting key enzymes and metabolic intermediates. (K, L, M) KEGG pathway analysis of histidine metabolism and related metabolites, highlighting key enzymes and their regulation. (N, O, P, Q) Western blot analysis of HDC, HAL, and ALDH1A1 expression at 24 h post-CLP in CD4+ T cells from mice described in (A). (R) ELISA analysis showing histidine levels in the supernatants of CD4+ T cells from mice described in (A). Data were shown as mean ± SEM. ns, non-significance; *p < 0.05; **p < 0.01; ***p < 0.001
Histidine Supplementation Enhances T Cell Immune Function in Septic MiceBased on the previous results, we investigated the effect of histidine supplementation on T cells in septic mice. We administered L-histidine immediately after CLP via intraperitoneal injection at doses of 50 mg/kg, 100 mg/kg, and 200 mg/kg. Flow cytometry analysis revealed that, compared to the CLP group, the proportion of CD3+ T cells was increased significantly in the CLP + L-histidine groups (Fig. 5A). Among CD3+ T cells, the proportion of CD4+ T cells decreased, while that of CD8+ T cells increased in the CLP + L-histidine groups compared to the CLP group. Furthermore, the proportions of Th1 cells, Th2 cells, and Tregs significantly decreased in the CLP + L-histidine groups, while the proportion of Th17 cells did not change significantly compared to the CLP group (Fig. 5B).
Fig. 5
L-histidine supplementation improves T cell immune function in septic mice. (A) Representative flow cytometric analysis and statistical analysis of the proportions of CD3+ T cells, CD4+/CD3+ T cells, and CD8+/CD3+ T cells in mice treated with sham operation, CLP, CLP + 50 mg/kg L-histidine (i.p.), CLP + 100 mg/kg L-histidine (i.p.), and CLP + 150 mg/kg L-histidine (i.p.). (B) Representative flow cytometric analysis and statistical analysis of the proportions of Th1 (CD4+IFN-γ+) cells, Th2 (CD4+IL-4+) cells, Th17 (CD4+IL-17+) cells, and Tregs (CD4+CD25+Foxp3+) in mice treated as described in (A). (C, D) Supernatant levels of IL-10 and TGF-β in cultured CD4+CD25+ T cells from mice treated as described in (A). (E) CD4+CD25+ Tregs from mice treated as described in (A) were co-cultured with CD4+CD25− Teff at a ratio of 1:10 for 68 h. MTT assay was used to assess the proliferation of cells within the co-culture system (primarily reflecting Teff proliferation). (F) Venn diagram showing the 26 common target genes of miR-182 identified by ten databases. (G) Western blotting analysis of FOXO3 expression in the WT group and the miR-182−/− group. Data were shown as mean ± SEM. ns, non-significance; *p < 0.05; **p < 0.01; ***p < 0.001
The marked reduction in Treg proportions and cytokine secretion (Fig. 5B-D) suggested that L-histidine preferentially modulated Treg-mediated immunosuppression. Additionally, MTT assays showed that CD4+CD25− Teff, co-cultured with CD4+CD25+ Tregs, exhibited enhanced proliferative capacity when L-histidine was added (Fig. 5E).
To predict the potential target genes of miR-182, we screened for miR-182 targets using 10 different databases (miRWalk, Microt4, miRanda, miRDB, miRMap, miRNAMap, PITA, RNA22, RNAhybrid, and TargetScan). A total of 26 common target genes were identified, including Adcy6, Prdm1, Bmi1, Clock, Fbn1, Gnaq, Ppp1r13b, Gria3, Foxo3, Fam134b, Smc6, Zfand4, Dusp6, Paip2, Nrn1, Dcaf12, Taf15, Wdr44, Wasl, Pabpc5, Ube3c, Pdzd8, Etl4, Zbtb41, Slitrk4, and Frs2 (Fig. 5F). Among these, Foxo3 regulates immune homeostasis and tolerance by controlling immune cell development and function [21,22,23]. It is closely linked to T cell differentiation and is a likely target gene of miR-182. To validate this hypothesis, we assessed FOXO3 protein expression in the WT group and the miR-182−/− group. The results showed that FOXO3 was significantly downregulated following miR-182 knockout, confirming that miR-182 regulates T cell immune function through FOXO3 (Fig. 5G). These results indicated that L-histidine supplementation improved T cell immune function, especially by regulating the function of Tregs. In addition, these findings suggest that miR-182 may regulate histidine metabolism to affect T-cell immune function and differentiation through the modulation of its target gene, Foxo3.
miR-182 as a Potential Predictor for sepsis Severity and PrognosisTo evaluate the prognostic value of plasma miR-182 in sepsis, we enrolled 128 sepsis patients (46 with sepsis and 82 with septic shock) and 50 age- and sex-matched healthy controls. The baseline characteristics were summarized in Table 1. The primary infection sources were hepatobiliary (21.09%), urinary tract (14.06%), gastrointestinal (13.28%), pulmonary (11.72%), and others (15.63%). Patients with septic shock exhibited significantly higher APACHE II scores (16 (11–21) vs. 14 (10–17), p = 0.0044), SOFA scores (5 (3–9) vs. 9 (6-11.75), p < 0.0001), lactate levels (3.398 ± 0.36 vs. 6.11 ± 0.74 mmol/L, p = 0.0014), and procalcitonin (PCT) levels (28.65 ± 5.59 vs. 62.87 ± 6.831 mg/L, p < 0.0001) compared to sepsis patients. Although 28-day mortality was higher in septic shock (17.39% vs. 24.35%), the difference was not statistically significant (p = 0.44). Plasma miR-182 levels were markedly elevated in sepsis patients versus controls (Fig. 6A), with further increases in septic shock (Fig. 6B). Moreover, plasma miR-182 levels in sepsis patients were not significantly associated with the number of organ failures (Fig. 6C). As shown in Fig. 6D, E, miR-182 concentrations positively correlated with APACHE II (r = 0.2068, p = 0.0192) and SOFA scores (r = 0.1747, p = 0.0485). Histidine levels were reduced in sepsis patients compared to controls (Fig. 6F) and further decreased in non-survivors versus survivors (Fig. 6G). Correlation analysis showed that histidine levels were negatively correlated with plasma miR-182 concentrations (r = 0.2118, p = 0.01164) (Fig. 6H). Receiver operating characteristic (ROC) analysis revealed that miR-182 (AUC = 0.735) and histidine (AUC = 0.676) had comparable predictive accuracy for 28-day mortality to APACHE II (AUC = 0.702) and SOFA (AUC = 0.695), with no significant differences in AUC values (Fig. 6I; Table 2). Optimal cutoffs were 31.9 ng/mL for miR-182 (81.5% sensitivity, 71.3% specificity) and 10 ng/mL for histidine (74.1% sensitivity, 64.4% specificity). Kaplan-Meier analysis confirmed that patients with miR-182 < 31.9 ng/mL or histidine ≥ 10 ng/mL had significantly improved survival (log-rank p < 0.001) (Fig. 6J, K). Notably, our results show that plasma miR-182 is associated with the severity of sepsis and serves as a promising prognostic biomarker for 28-day mortality.
Fig. 6
miR-182 may be used as a predictor to assess severity and prognosis of septic patients. (A) Plasma miR-182 concentrations in healthy controls and sepsis patients. (B) Plasma miR-182 concentrations in healthy controls, septic patients, and septic shock patients. (C) Plasma miR-182 concentrations in septic patients with more than 2 organ failures and with 2 or fewer organ failures. (D) The correlation between plasma miR-182 concentrations and APACHE II scores. (E) The correlation between plasma miR-182 concentrations and SOFA scores. (F) Plasma histidine concentrations in healthy controls and sepsis patients. (G) Plasma miR-182 concentrations in the sepsis survivor group and the sepsis non-survivor group. (H) The correlation between plasma miR-182 concentrations and histidine concentrations. (I) ROC curve analyses of miR-182, histidine, lactate, APACHE II scores, and SOFA scores for predicting 28-day mortality in septic patients. (J) Kaplan-Meier curves of 28-day mortality in patients with sepsis, stratified by the optimal cut-off value of miR-182 concentrations. (K) Kaplan-Meier curve of 28-day mortality in patients with sepsis, stratified by the optimal cut-off value of histidine concentrations. Data were shown as mean ± SEM. ns, non-significance; *p < 0.05; **p < 0.01; ***p < 0.001
Table 1 Baseline characteristics of the study populationTable 2 AUC and cut off for predicting 28-day mortality in septic patients
Comments (0)