
Remember me
Cel (Fig. 1a; purity ≥ 98%), methotrexate (MTX; purity ≥ 99%) and enzyme-linked immunosorbent assay (ELISA) kits for IL-1β, IL-6, and TNF-α were acquired from Solarbio (Beijing, China). Dexamethasone (Dex; purity = 97%), tumor necrosis factor-α (TNF-α) and MTT were obtained from Sigma‒Aldrich (Saint Louis, MO, USA). Chick type II collagen (CII), complete Freund’s adjuvant (CFA, 1 mg/mL), and incomplete Freund’s adjuvant (IFA, 1 mg/mL) were acquired from Chondrex, Inc. (Redmond, WA, USA). The Active Oxygen Detection Kit was purchased from Beyotime Biotechnology Co., Ltd. (Shanghai, China). An EdU cell proliferation assay kit was obtained from Ribo Biotechnology Co., Ltd. (Guangzhou, China), and a coimmunoprecipitation (Co-IP) kit was obtained from Absin Biotechnology Co., Ltd. (Shanghai, China). Primary antibodies against pp65, p65, p-IκB-α, NLRP3, Hsp90, ASC, vimentin, normal rabbit IgG, and GAPDH were obtained from Cell Signaling Technology (Beverly, MA, USA). An anti-cleaved caspase-1 antibody was purchased from R&D Systems (MN, USA). The anti-Hsp90 antibody was purchased from Abcam (Cambridge, UK), and the anti-CD68 antibody was purchased from Novus Biologicals (CO, USA).
Fig. 1
Cel disrupts CIA progression and improves metabolism and immunity. (a) Chemical structure of Cel. (b) Images of the joints of the mice. (c) Images of the mice spleen. (d) Paw swelling degree were measured via plethysmometer. (e) Images of the mice thymus. (f) Cel treatment reduced the arthritis index score of CIA mice. (g, h) Cel treatment improved the spleen index (g) and thymus index (h) of CIA mice. (i) Body weight of treated mice over time. Data were presented as mean ± SD (n = 6). ##P < 0.01 vs. control; *P < 0.05, **P < 0.01 vs. model group.
AnimalsSeven-week-old male DBA/1 (SPF, 18 ± 22 g) mice were procured from Changzhou Cavens Laboratory Animal Co., Ltd. [SCXK(SU)2016-0010, Jiangsu, China] and fed at the Laboratory Animal Centre of Binzhou Medical University. Except for during the fasting test, the animals had free access to food and water throughout the trial period. All mice were fed according to the experimental standards authorized by the Animal Ethics Committee of Binzhou Medical University.
CIA Model InductionThe CIA model was established in 8-week-old mice according to the previously described methods [22]. An equal volume of CII (2 mg/mL, Chondrex, Inc., Redmond, WA, USA) and CFA (Chondrex, Inc.) were fully mixed in an EP tube and sonicated on ice until complete emulsification. On day 0, 100 μL emulsion was injected subcutaneously into the tail root (1–2 cm) of mice. On day 21, the equal volume of CII was added to IFA (Chondrex, Inc.), and the emulsion was prepared by the same method, and 100 μL of enhanced immunity was injected into the tail root of mice.
Drug AdministrationThe CIA model mice were randomized into five experimental groups of 6 mice each: model, MTX (2 mg/kg), and Cel (0.5 mg/kg, 1 mg/kg and 2 mg/kg) groups. Unmodeled mice composed the control group (n = 6). After the second immunization, Cel and MTX were administered to the mice with CIA by gavage once a day. Furthermore, the control group and the model group were administered 0.5% sodium carboxymethyl cellulose (CMC-Na) by gavage once a day. The dose of Cel used in this research was based on previous studies and preliminary experiments [9]. On day 56, the mice were removed, and the serum was collected and stored for subsequent analysis.
Body Weight and Paw Swelling MeasurementsA toe measuring instrument (PV-200, Chengdu Tai Meng Technology Co., Ltd., Chengdu, China) was used to measure paw swelling, and the body weights of the mice were measured using an electronic scale. Briefly, from day 28 to day 56, the left paw volume of each mouse was measured every 4 days as an indicator of paw swelling, and the body weights of the mice with CIA were measured.
Arthritis ScoreThe degree of inflammation in the mice with arthritis was observed daily. The clinical arthritis score was used to assess the development of the disease based on previously established identification criteria [23]. The total score of each mouse was used as the arthritis index, and the maximum value was 12 (3 points × 4).
Visceral IndexAt 56 days after immunization, the thymus and spleen were completely removed, and the organ indices were calculated. The organ indices are reported as the weight of each immune organ relative to the body weight of the mice (mg/g).
Histological ExaminationFor standard histological assessments, when the mice were euthanized on day 56, the ankle joints, liver, and kidney were isolated and fixed with a 4% paraformaldehyde solution for 72 h, after which the ankle joints of the mice with CIA were decalcified with EDTA. After the joints softened, they were subjected to gradient dehydration, embedded in paraffin, and cut into thin slices. Hematoxylin and eosin (H&E) staining was performed to observe pathological changes in the tissues under an optical microscope. The samples were evaluated and scored according to previously reported methods.
RadiographyAfter sampling, 3 mice were randomly chosen, and the left posterior bone and joints of the mice with CIA were removed for molybdenum target radiography. X-ray imaging was performed on the breast molybdenum target instrument of the affiliated hospital, and the parameters were set to 30 kVp and 90 mA.
Microcomputed Tomography (micro-CT) AnalysisThree mice with CIA were randomly selected from each group for micro-CT (PerkinElmer, Waltham, MA, USA) detection of the left posterior joint. The specific criteria for the micro-CT ankle bone destruction score were as follows: 0) normal, 1) slight bone destruction, 2) moderate bone destruction, 3) severe bone destruction, and 4) ankylosis [24].
Cell Culture and ActivityFLSs were obtained from Yantai University (Yantai, China). The specific extraction method can be seen in the above studies [25]. The experimental samples were from three batches of different tissues, and each experiment was repeated three times. The 4-8 generations of FLSs were selected for use in subsequent experimental research [26].
After seeding on plates, the FLSs were divided into the control group, model group, Cel groups (12.5, 25, and 50 nM) and Dex (50 nM) group, and incubated with different drugs for 2 h. After which TNF-α (10 ng/mL) was added to each well. The impact of Cel on the proliferation of FLSs was determined using the MTT assay.
In addition, the TNF-α-induced proliferation of FLSs was detected by an EdU assay. After 48 h of incubation with EdU (10 μM), the cells were infiltrated with 4% paraformaldehyde and disrupted with 0.5% Triton X-100. Then, Hoechst 33342 reaction solution was added to stain the nucleus. The FLSs were immediately photographed with a high content screening system (PerkinElmer, Llantrisant).
FLSs were cultured in 96-well plates, treated with Cel or Dex for 2 h, and induced with TNF-α for different durations until the appropriate measurements were recorded to analyze the anti-inflammatory effects of Cel.
Scratch Wound Healing ExperimentFLSs were inoculated in 6-well plates at a density of 5 × 10⁴ cells per well. Then, the cells were cultured in an incubator for 24 h, and the monolayer surface was scratched with tips of sterile 200 μL microneedles. The cell fragments were removed with PBS, and then, fresh DMEM/F12 was added. Before TNF-α stimulation, cells in the appropriate wells were pretreated with Dex or Cel for 2 h. The 6-well plates were removed at 0 and 48 h after injury, and the scratch wounds were imaged with an inverted phase-contrast microscope (Olympus, Tokyo, Japan).
Cytokine DeterminationFor in vitro studies, the supernatant of FLSs was collected and centrifuged after 48 h of stimulation with TNF-α and stored at -80 °C. The inflammatory cytokine levels in mouse serum and cell supernatants were detected in strict accordance with the instructions of the ELISA kit.
Intracellular ROS DetectionThe level of ROS in FLSs was determined using the DCFH-DA method. Briefly, after drug treatment, the cells were incubated with DCFH-DA for 30 min. Then, the intracellular ROS level was detected with a high content screening system.
Immunofluorescence StainingThe ankle joint tissues were dewaxed, dehydrated, sealed, incubated, rinsed with PBS, and sliced for antigen repair. Goat serum was added to the FLSs, and the cells were incubated at room temperature for 30 min for blocking. After the blocking solution was added, diluted primary antibody against NLRP3 was added to the sections, which were incubated at 4 °C overnight. On the second day, the sections were rinsed with PBS, and fluorescently labeled secondary antibodies were added. The sections were incubated at 37 °C for 30 min and washed with PBS. The sections were stained with DAPI and incubated at room temperature. After the slides were rinsed with sterile PBS, they were sealed with antifluorescent quenchers and photographed using a high content screening system.
FLSs were subjected to immunofluorescence staining to determine their purity, and the expression of cleaved caspase-1 and NLRP3 and the nuclear translocation of p65 were determined. After different treatments, 50 μL of 4% paraformaldehyde was added to the FLSs in each well, and the cells were fixed at room temperature for 30 min. Then, 50 μL of 0.3% Triton X-100 was added to each well, and the cells were incubated for 15 min for cell membrane penetration. Subsequently, the FLSs were blocked with 1% sterile BSA for 30 min. Primary antibodies against vimentin, CD68, p65, NLRP3 and cleaved caspase-1 (1:200) were incubated with the FLSs overnight at 4 °C. Finally, the fluorescent dye-conjugated secondary antibody working solution was added, and the cells were incubated at room temperature in the dark for 2 h. After the FLSs nuclei were stained with DAPI, a high content screening system was used to immediately obtain images.
Western BlottingTotal protein was extracted from FLSs or joint tissues with RIPA buffer. The protein concentration was determined according to the instructions of the BCA kit. According to the prepared separation gel and concentrating gel, 30 μg of protein sample was added to each well of the gel for electrophoresis. Moreover, the proteins were transferred to a PVDF membrane. The PVDF membrane was placed in a closed solution and incubated at room temperature for 2 h. The specific primary antibodies against p65, p-p65, p-IκBα, cleaved caspase-1, ASC, NLRP3 and GAPDH (1:1000 dilution for all) were incubated with the membrane at 4 °C overnight. Then, the membranes was placed in the corresponding diluted secondary antibody working solution and incubated at room temperature for 2 h. Finally, the luminescent liquid was added to the enhanced chemiluminescence (ECL) immunoblotting imaging system (ChemiDoc TM XRS; Bio-Rad Shanghai, China), followed by exposure and imaging, and the gray values were assessed to calculate the relative expression.
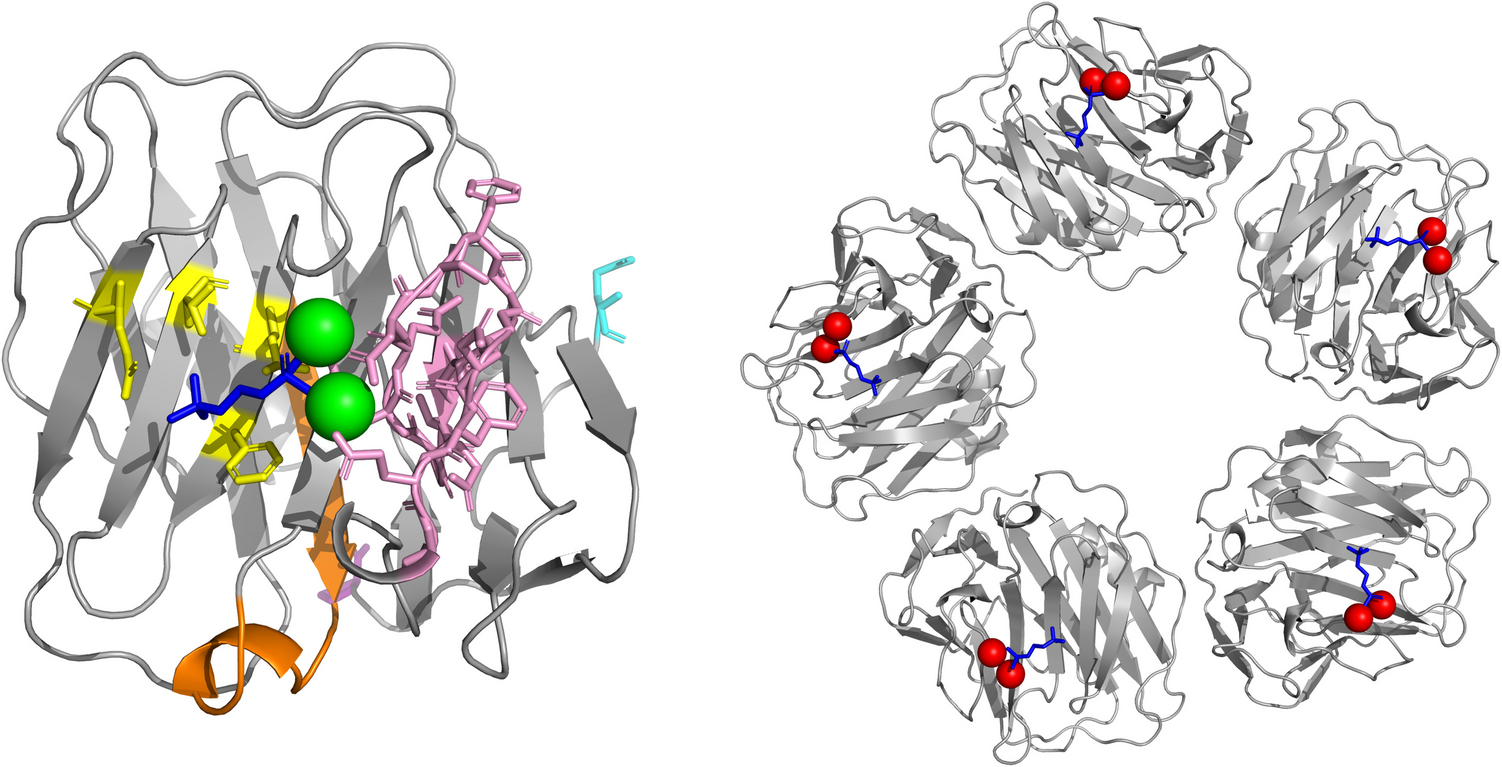
Molecular DockingThe molecular docking program was used according to the C-DOCKER protocol of Discovery Studio 2017 R2. Briefly, the human Hsp90 N-terminal crystal structure (PDB code: 2CCS) was acquired from the Protein Data Bank database. For the preparation of ligands, Discovery Studio 2017 R2 was used to generate and minimize the 3D structures of Cel and geldanamycin. Protein preparation requires the addition of hydrogen atoms, the removal of water molecules, and the use of the CHARMM force field. Binding sites were identified using the Find Sites From Receptor Cavities tool under Receptor‒Ligand Interactions. The compounds were subjected to molecular docking. After molecular docking, the type of interaction between the docking protein and the ligand was analyzed.
Co-IPFLSs were treated with or without Cel (50 nM) and placed in precooled lysis buffer. An anti-Hsp90 antibody (EPR16621-67, 1:200, Abcam Biomedicine, UK) and Protein A/G agarose were added to the lysate and incubated at 4 °C overnight. After the immunoprecipitation reaction, the cells were centrifuged (10,000 × g) for 10 min in a precooled centrifuge. After being fully washed with lysis buffer, the immunoprecipitate was boiled in loading buffer, and the proteins were detected using western blotting.
Affinity DeterminationThe interaction between Cel and Hsp90 was detected using a super streptavidin (SSA) biosensor in the Octet RED96 system (ForteBio, Inc., Menlo Park, CA, USA). First, the extracellular domain of the recombinant human Hsp90 protein (Abiocenter Biotechnology Co., Beijing) was biotinylated in PBS (0.1% BSA and 0.05% Tween-20) and loaded onto the SSA biosensor at 119 μg/mL. The biosensors were blocked with biocytin (5 μg/mL) for 60 s. Cel diluted in PBS (0.1% BSA, 0.05% Tween-20 and 10% DMSO) was added to the SSA biosensor loaded with Hsp90. By subtracting the nonspecific binding of Cel to the SSA biosensor, the real-time binding response (∆λ is nanometer, nm) between Cel and Hsp90 was calculated. Octet 8.5 data analysis software (ForteBio, Inc., Menlo Park, CA, USA) was used to perform nonlinear global fitting of the data, and the kinetic parameters and affinities were obtained.
Statistical AnalysesAll the data were analyzed using SPSS 20.0 software and are presented as the mean ± standard deviations (mean ± SD). The data were statistically significant according to ANOVA and were normally distributed, which satisfied the assumption of homogeneity of variance. The Dunnett test was used to evaluate the significance of pairwise comparisons. P < 0.05 was considered to indicate statistical significance.
Comments (0)