
Remember me

NOTA-D10CM was synthesized in accordance with a published protocol [14]. In brief, D10CM in dimethyl sulfoxide was conjugated to NOTA-N-hydroxysuccinimide ester in borate buffer for 18 h at room temperature, with stirring. The product was then diluted with deionized water, concentrated using an ultrafiltration cell under nitrogen gas pressure, and lyophilized to yield a white solid product.
The NOTA-D10CM was labeled with the near infrared dye Alexa Fluor® 488 tetrafluorophenyl ester (Alexa Fluor® 488 Microscale Protein Labeling Kit A3006; Invitrogen) according to the manufacturer’s protocol. Briefly, to make 1 mg/mL Alexa-488-NOTA-D10CM, a reaction tube containing 100 µL of a 1 mM stock solution of NOTA-D10CM was supplemented with 10 µL of 1 M sodium bicarbonate. The mixture was then homogenized manually using a micropipette. To make a stock solution of reactive dye, 10 µL of deionized water were added to a vial containing the Alexa Fluor® 488 tetrafluorophenyl ester provided in the kit, resulting in a reactive dye solution with a concentration of 11.3 nmol/µL. Subsequently, 8 µL of reactive dye solution was added to the reaction tube containing NOTA-D10CM in sodium bicarbonate and then incubated for 15 min at room temperature. The unreacted dye was removed from the mixture using the purification resin and spin filters provided in the labeling kit.
Al[18F]F-NOTA-D10CM was prepared according to a previously published method [12]. Briefly, the Al[18F]F-fluorination technique was used to radiolabel NOTA-D10CM (6.8 nmol in 50 µL water) with [18F]fluoride (220 µL in saline) by heating at 100⁰C for 13 min in a mixture of AlCl3/1 M sodium acetate buffer (pH 4.0, 40 µL), acetonitrile (60 µL), and 150 mM ascorbic acid (40 µL); the mixture was then cooled to 40⁰C. Trifluoroacetic acid (TFA) in water (1%, 810 µL) was then added to the reaction mixture, the whole mixture was purified following the previously described method [12]. Al[18F]F-NOTA-D10CM was collected in an end product bottle containing a mixture of 0.15 mL of 150 mM ascorbic acid and 1.35 mL phosphate-buffered saline (PBS). The radiochemical purity was measured using a radiodetector-coupled high-performance liquid chromatography (HPLC) tandem system (Hitachi; Merck), as previously described [12].
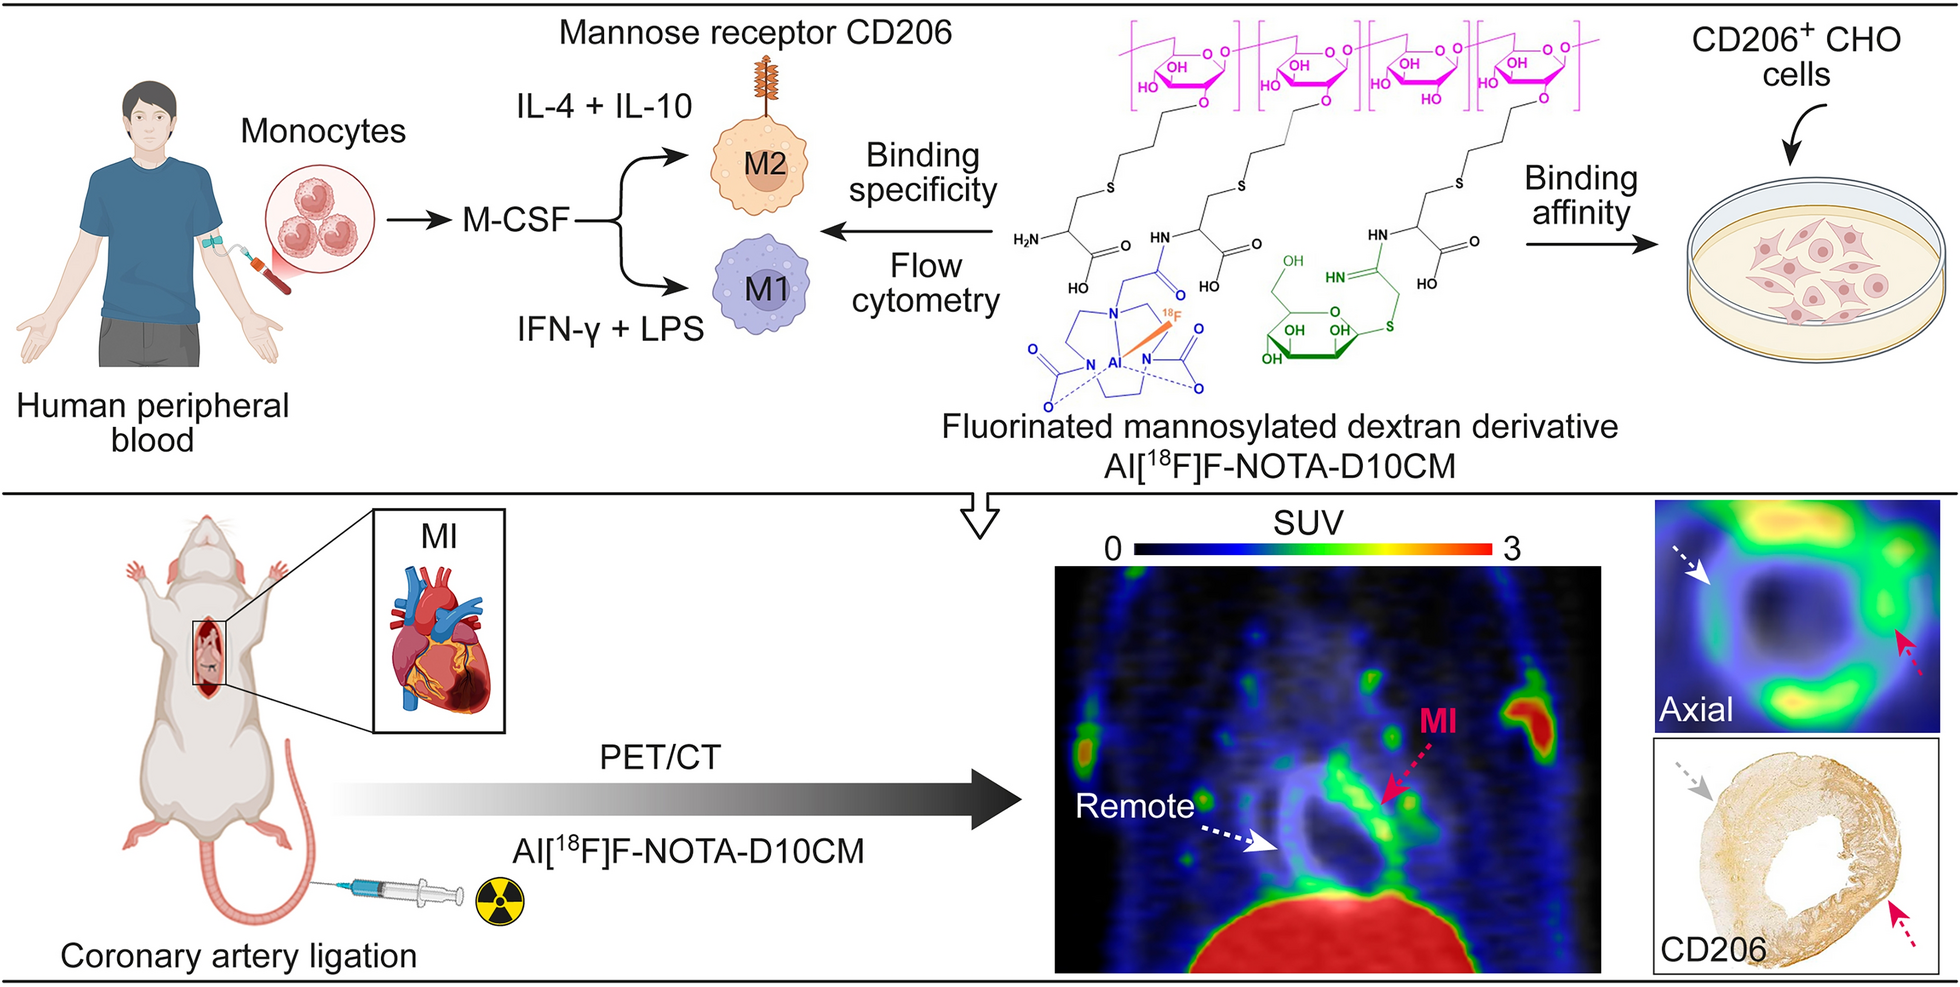
Binding of Alexa-488-NOTA-D10CM to M1/M2-polarized human macrophagesPeripheral blood mononuclear cells (PBMCs) were isolated from human buffy coats by Ficoll centrifugation. Monocytes were enriched from PBMCs by positive selection using a magnetic-activated cell sorting kit (Monocyte isolation kit with CD14 MicroBeads; Miltenyi Biotec). The monocytes were then cultured and polarized into M1 or M2 macrophages as previously described [15]. To assess CD206 expression, cells were pre-blocked with human immunoglobulin (Ig 100 μg/mL; KIOVIG, Baxter) and then incubated with an Alexa Fluor® 647-conjugated anti-human CD206 antibody (mouse IgG1; BioLegend) or an isotype control (mouse IgG1; BD Biosciences). Post-incubation, cells were fixed with paraformaldehyde and analyzed by flow cytometry (Fortessa, BD Biosciences) and Flowing software (Turku Center of Biotechnology). To evaluate binding of Alexa-488-NOTA-D10CM, macrophages were harvested and incubated for 30 min or 4 h at 37 °C in a CO2 incubator with fresh medium (Iscove’s Modified Dulbecco’s medium containing 2% AB serum and 2 mmol L-glutamine; Gibco, Thermo Fisher Scientific) containing Alexa-488-NOTA-D10CM (10 µg/mL). After incubation, the cells were rinsed twice with 1 mL of PBS to remove any unbound Alexa-488-NOTA-D10CM. Finally, cells were fixed using paraformaldehyde and analyzed by flow cytometry and Flowing software.
Binding of Al[18F]F-NOTA-D10CM to CHO cellsChinese hamster ovary (CHO) cells stably expressing mouse CD206 (CHO-CD206+) and CD206-negative CHO cells (CHO-CD206−) were a kind gift from Prof. Luisa Martinez-Pomares (University of Nottingham, United Kingdom). The cells were cultured at 37 °C in a CO2 incubator in RPMI 1640 medium (Gibco/Thermo Fisher Scientific) supplemented with 10% fetal bovine serum (Biowest), 2 mmol l-glutamine; (Gibco/Thermo Fisher Scientific), 100 U/mL penicillin, and 100 µg/mL streptomycin (Sigma-Aldrich/Merck). To validate CD206 expression, the cells were harvested and then incubated with an Alexa Fluor® 488-conjugated anti-mouse CD206 antibody (rat IgG2; Bio-Rad) or with an isotype control (rat IgG2; BD Biosciences). Then, the cells were fixed using paraformaldehyde and analyzed using flow cytometer and Flowing software.
To study the binding affinity of Al[18F]F-NOTA-D10CM, CHO-CD206+ and CHO-CD206− cells were cultured and allowed to attach to opposite sides of a 92 mm Petri dish in accordance with the LigandTracer (Ridgeview Instruments AB) guidelines. An empty region on the Petri dish (with no attached cells) was used as a background control for non-specific binding of Al[18F]F-NOTA-D10CM. The dissociation constant (KD) of Al[18F]F-NOTA-D10CM was measured using a LigandTracer Yellow instrument, where the assay protocol includes sequential measurement of radioactivity in the target cells (CHO-CD206+), the negative control cells (CHO-CD206−), and the cell-free background regions of the Petri dish. Radioactivity in each region was measured for 30 s (as raw counts per second (cps)) with a 5 s delay over the time course of the experiment. The target regions (cps) were corrected for background signals and radioactive decay. Al[18F]F-NOTA-D10CM was added to the medium in a stepwise fashion to achieve a concentration range of 50–450 nM, followed by replacement with fresh medium without tracer to measure the dissociation. The ratio of bound Al[18F]F-NOTA-D10CM (to the cells) to background (Petri dish) and the KD value were calculated using the TraceDrawer software (Ridgeview Instruments AB).
Animals and experimental designAll animal experiments were approved by the National Project Authorization Board in Finland (license number ESAVI/43134/2019) and carried out in compliance with the EU Directive 2010/EU/63 on the protection of animals used for scientific purposes.
MI was induced in male Sprague–Dawley rats by permanent ligation of the left anterior descending (LAD) coronary artery [16]. In brief, approximately 30 min prior to anesthesia, rats were subcutaneously (s.c.) medicated with 0.5 mg/kg buprenorphine (Temgesic 0.1 mg/kg, Schering-Plough); anesthesia was induced by intraperitoneal (i.p.) administration of a mixture of 80 mg/kg ketamine (Ketaminol®vet 50 mg/mL, Intervet) and 0.5 mg/kg medetomidine (Cepetor vet 50 mg/mL, Vetmedic). The thoracic area was shaved, cleaned, and treated with s.c. < 7 mg/kg lidocaine (Lidocaine, 10 mg/mL; Orion Pharma). The body temperature of the rats was maintained using a heating pad, and monitored with a digital thermometer. The rats were intubated and attached to a rodent ventilator (TOPO dual mode ventilator; Kent Scientific). All surgical equipment was sterilized, and the surgical area was kept sterile. LAD coronary artery was permanently ligated, and infarction was verified by the paleness of the myocardium. Sham-operated rats underwent the same procedure, except that the artery was not ligated. The incision was closed and the rats were revived by i.p. injection of 1 mg/kg atipamezole (Antisedan 5 mg/mL, Orion Pharma). Saline was administered s.c. before and after the surgery. The rats were monitored closely, and treated with buprenorphine every 8 h for 3 days following the operation. The mortality rate after the LAD ligation procedure was ~ 27% on MI Day 7, and ~ 55% on MI Day 3, mainly due to development of significant infarction on Day 0 after surgery or on Day 1 after surgery.
The experimental study design is depicted in Fig. 1. A total of 23 rats were divided into four groups. Group 1: MI Day 3 = 3 days post-MI (n = 7, weight 263.30 ± 56.00 g, age 7–8 weeks); Group 2: Sham Day 3 = 3 days after sham-operation (n = 4, 218.60 ± 18.00 g, 7 weeks); Group 3: MI Day 7 = 7 days post-MI (n = 10, 265.60 ± 28.50 g, 7–8 weeks); and Group 4: Sham Day 7 = 7 days after sham-operation (n = 4, 275.80 ± 6.00 g, 8 weeks). Rats underwent PET/computed tomography (CT) scans on consecutive days after intravenous (i.v.) injection of 2-deoxy-2-[18F]-fluoro-D-glucose ([18F]FDG; 34.90 ± 1.31 MBq) or Al[18F]F-NOTA-D10CM (50.51 ± 2.32 MBq [range 43.98–54.65 MBq], 0.29 ± 0.14 mg [range 0.12–0.63 mg], 13.39 ± 6.56 nmol [range 5.67–28.64 nmol]), followed by ex vivo analyses performed 70 min after Al[18F]F-NOTA-D10CM injection. Left ventricles were dissected, frozen, and cross-sectioned for digital autoradiography, histology (hematoxylin–eosin [H&E]), and anti-CD206 and anti-cluster of differentiation 68 (CD68) immunostaining.
Fig. 1
Animal study design. Sprague Dawley rats (n = 23) underwent permanent LAD ligation or sham-operation on Day 0. Then, the rats were divided to four groups: MI Day 3 (Group 1), Sham Day 3 (Group 2), MI Day 7 (Group 3), and Sham Day 7 (Group 4). All rats were imaged with [18F]FDG PET/CT 1 day before Al[18F]F-NOTA-D10CM PET/CT. All rats were euthanized immediately after Al[18F]F-NOTA-D10CM PET/CT imaging to measure ex vivo biodistribution, autoradiography, hematoxylin–eosin (H&E) staining, CD206 immunohistochemical staining, and double CD206 and CD68 immunofluorescence staining of the left ventricle
In vivo PET/CT studiesRats were imaged with Inveon Multimodality PET/CT (Siemens Medical Solution) under isoflurane anesthesia (4–5% induction, 1.5–2% maintenance). The tail vein was cannulated before imaging. CT was performed for attenuation correction and anatomical reference. A 10-min static PET acquisition was performed 20 min after [18F]FDG injection to visualize the myocardium. A 60 min dynamic PET acquisition was started at the time of Al[18F]F-NOTA-D10CM injection. PET data were reconstructed using an ordered subsets expectation maximization 3-dimensional algorithm into 30 × 3 s, 9 × 10 s, 4 × 30 s, 5 × 60 s, and 10 × 300 s time frames. PET/CT images were analyzed using Carimas 2.10 software (Turku PET Centre, www.turkupetcentre.fi/carimas/). Regions of interest (ROI) within the main organs were defined manually using CT as a reference, and [18F]FDG PET to localize the myocardium. ROIs in the MI area were defined based on reduced [18F]FDG uptake on the short-axis images, and in the remote area based on strong [18F]FDG uptake in the septum, excluding the apical area to avoid spill-over from the liver. MI area ROIs were defined in each frame that showed visible Al[18F]F-NOTA-D10CM uptake. In addition, H&E stains were used to confirm the location of the MI and remote areas. At least three consecutive planes were analyzed at 50–60 min post-injection of Al[18F]F-NOTA-D10CM. Time-activity curves (TACs) were extracted from dynamic PET data and expressed as the mean standardized uptake value (SUV) as a function of time post-injection. Size of the MI was measured in [18F]FDG polar maps as myocardium showing < 70% tracer uptake of the maximum uptake.
Modeling of PET dataThe dynamic Al[18F]F-NOTA-D10CM PET data were analyzed using a graphical Patlak method, along with one- and two-tissue compartment models. The blood TACs obtained from the heart left ventricle cavity were used as an input function without metabolite-correction.
TACs were extracted from dynamic Al[18F]F-NOTA-D10CM PET data obtained from three manually defined ROIs: the MI area, an area remote from the infarction, and the left ventricle cavity. Due to the small target size, along with movement of the heart (beating, respiration), the TACs do not represent the pure intended target regions; rather, they are mixtures of the target regions and adjacent regions. This effect is particularly conspicuous in the myocardial regions during the first few minutes after injection, when the concentration of radioactivity in the heart cavities is very high. The effect is less prominent during the late phase of dynamic imaging (50–60 min post-injection), which is used to calculate the regional SUVs. During dynamic data analysis, the left ventricle cavity TAC was assumed to represent the concentration of intact Al[18F]F-NOTA-D10CM in arterial blood, ignoring the relatively low contribution of radioactive metabolites to the total concentration in the blood. The Patlak plot became linear about 8 min post-injection (results not shown), suggesting rapid kinetics, and that uptake by the myocardial muscle is irreversible, as to be expected for a radioligand that is internalized. Since the Patlak plot does not properly account for the highly variable volume of the heart cavity inside myocardial ROIs, compartmental models were applied to analyze the data. In these compartmental models, the regional TACs are assumed to be a composite of myocardial tissue (C_T) and blood (C_B),
$$}\_}\left( } \right) = }\_}*}\_}\left( } \right) + \left( - }\_}} \right)*}\_}\left( } \right)$$
The one- and two-tissue compartment models tested showed a good fit to the data, but only the irreversible one-tissue compartment model with three parameters, Ki, K1, and Vb, provided consistent parameter estimates and so were used for further analyses.
Ex vivo Al[18F]F-NOTA-D10CM studiesRats were euthanized by cardiac puncture and cervical dislocation under isoflurane anesthesia 70 min after i.v. injection of Al[18F]F-NOTA-D10CM. Tissues of interest were excised, weighed, and their radioactivity measured using a gamma counter (Triathler 3 ̋; Hidex). The results were decay-corrected to the time of injection, compensated for radioactivity remaining in the tail, and expressed as a percentage of the injected radioactivity dose per gram of tissue (%ID/g).
The left ventricle was collected and washed with saline, embedded in Tissue-Tek OCT compound, frozen in dry ice-cooled isopentane, and cross-sectioned (serial 20 µm and 8 µm sections at approximately 1 mm intervals from the apex to base) using a cryostat (Leica CM3050 S, Leica Biosystems, Richmond Inc.); sections were then mounted on microscope slides (Leica Surgipath X-tra Adhesive, Leica Biosystems, Richmond Inc.) as described previously [17]. The slides were briefly air-dried, opposed to phosphor imaging plates (BAS-TR2025; Fuji), an exposed overnight. The plates were then scanned with a Fuji Analyzer BAS-5000. ROIs were analyzed on superimposed autoradiography and digitalized H&E histology images (20 µm sections) using Carimas. The results were expressed as photostimulated luminescence per square millimeter (PSL/mm2) decay-corrected to injection time and exposure time, and normalized to the injected radioactivity dose. All slides were stored in -70⁰C prior to H&E and immunohistochemical staining.
In vitro binding of Al[18F]F-NOTA-D10CM to tissue sectionsCryosections (20 µm thickness) of the left ventricle were defrosted at 4 °C for 40 min, and placed in an incubation chamber for 15 min at room temperature in N-(2-hydroxyethyl)-piperazine-N’-(2-ethanesulfonic acid) (HEPES, Sigma-Aldrich) buffer pH 7.4 containing 10 mM Ca2+. For the total binding assay, slides were transferred to another chamber containing Al[18F]F-NOTA-D10CM (35 kBq/mL) in the HEPES buffer. For the competitive binding assay, adjacent tissue sections were incubated for 70 min with Al[18F]F-NOTA-D10CM (35 kBq/mL) and an approximately 200-fold molar excess of unlabeled NOTA-D10CM in the HEPES buffer. Then, the slides were rinsed twice with the cold HEPES buffer and dipped into cold water. The slides were briefly air-dried, exposed overnight to a phosphor imaging plate, scanned, and analyzed as described above. Experiments were performed in triplicate using tissue samples obtained from rats in MI Day 7 group (n = 3).
Histology and immunostainingFollowing autoradiography, frozen sections of left ventricle were stained with H&E (20 µm) as a histological reference, or with anti-CD206 (8 µm). Briefly, sections were fixed with 10% formalin, stained with hematoxylin (Fluka) and eosin (Reagena) using a Leica Autostainer, mounted in Pertex, and scanned with a digital slide scanner (Pannoramic P1000; 3DHistech Ltd.). For anti-CD206 immunohistochemical staining, sections were fixed in 4% paraformaldehyde, followed by antigen retrieval, washing, and blocking of endogenous peroxidase activity. Then, the sections were incubated for 60 min at room temperature with the polyclonal rabbit anti-mannose receptor (CD206/MRC1) antibody (working dilution 1:10,000; ab64693, Abcam), rinsed, and incubated with a secondary antibody (BrightVision horseradish peroxidase conjugated goat anti-mouse secondary antibody, DPVR110HRP, WellMed) for 30 min at room temperature. The sections were then reacted with 3,3-diaminobenzidine (BrightDAB, BS04-110, WellMed), counterstained with Mayer’s hematoxylin, mounted in Pertex, and dried overnight. Stained sections were scanned with a digital slide scanner (Pannoramic P1000 or Pannoramic 250 Flash, 3DHISTECH Ltd.), and examined using Pannoramic Viewer 1.15 software (3DHISTECH Ltd.) [12]. Quantitative analysis of the percentage CD206-positive area (CD206-positive area-%) were performed as described previously [13]. In brief, for quantitative analysis of the CD206-positive area-%, sections were separated to the MI area and the remote area using the manual selection tool in GIMP (version 2.10.24), using H&E histological reference to define the MI area (Supplementary Fig. 1). Quantification of the CD206-positive area-% in the MI and remote areas was performed separately by color deconvolution analysis using ImageJ 1.52n (Wayne Rasband), based on hematoxylin and DAB staining.
For double immunofluorescence staining, frozen left ventricle sections were incubated in citrate buffer (pH 6.0, BioSite) that was pre-warmed in boiling water. Then, the slides were cooled down for 20 min, washed with detergent (0.05% Tween 20)/PBS (pH 7.4), and pre-protein blocked (normal antibody diluent, BD09-125, WellMed). The slides were then incubated for 60 min at room temperature with mouse anti-rat CD68 (1:1000, MCA341GA, Bio-Rad) and polyclonal rabbit MRC-1 (1:10,000, ab64693, Abcam) primary antibodies in normal antibody diluent (BD09-125, WellMed). Subsequently, the sections were incubated with Alexa Fluor® 594-conjugated donkey anti-rabbit secondary antibody (A-21207, Invitrogen), and with an Alexa Fluor® 488-conjugated goat anti-mouse secondary antibody (A-11017, Invitrogen), for 30 min each at room temperature. Finally, the sections were mounted in Prolong Gold Antifade reagent with 4′,6-diamidino-2-phenylindole (DAPI, P36935, Invitrogen) and imaged with a Pannoramic Midi fluorescence slide scanner (3DHistech Ltd.). Data were analyzed using CaseViewer (version 2.4, 3DHistech Ltd.).
Statistical analysisResults are expressed as the mean ± standard deviation (SD). All data sets were first checked for normality using the D’Agostino-Pearson or Shapiro Wilk’s test. Differences between groups were determined by an unpaired Student’s t test, one-way Analysis of Variance (ANOVA), or the Wilcoxon test for non-normally distributed data. P-values < 0.05 were considered statistically significant. The association between two variables was evaluated by calculating Pearson’s correlation coefficient. All statistical analyses were conducted using GraphPad Prism (version 10.1.2 (324), 2023).
Comments (0)