
Remember me


This retrospective single-center study enrolled patients who underwent a baseline contrast-enhanced computed tomography (CT) scan of the primary pancreatic tumor prior to chemoradiation and subsequent surgery. Inclusion criteria: (1) Baseline pretreatment CT study with both arterial and venous phase of acquisition; (2) Histologic confirmation of a primary tumor of the pancreas; (3) CT scans performed exclusively at our hospital. Exclusion criteria: (1) pancreatic tumors identified as histological types other than adenocarcinoma; (2) patients presenting with metastases in organs other than the liver and lungs (Table 1). A total of 120 patients were enrolled, 98 with hepatic metastasis and 22 with only lung metastasis. Five participants were excluded, one with a carcinosarcoma, two with squamous cell carcinoma, and two with pancreatic acinar cell carcinomas. Therefore, the patients definitively recruited in the study consist of 94 cases of PDAC with hepatic metastases and 21 cases with pulmonary metastases.
Table 1 Study inclusion and exclusion criteriaSample Size and Power AnalysisA post-hoc power analysis was performed to evaluate the statistical power of the study. With the sample size (94 liver and 21 lung metastases cases), 80% power was achieved to detect effect sizes > 0.40 at a significance level of 0.10. However, it is acknowledged that a formal a priori sample size calculation was not performed, representing a limitation of this retrospective study. For future validation studies, a prospective sample size calculation was performed based on the findings. Using the observed effect size of the primary discriminative feature (LargeDependenceEmphasis, Cohen's d = 0.435) and aiming for 90% power at a significance level of 0.05, a minimum of 42 lung metastasis cases would be required for adequate validation. This calculation assumes:
Two-tailed testing
1:2 ratio between lung and liver metastases groups
Primary endpoint of discriminating between metastatic patterns
Allowance for 10% data loss or unsuitable imaging (Table 2)
Table 2 Sample size calculations based on LargeDependenceEmphasis feature, two-tailed testing (α = 0.05), with 10% allowance for data lossSample Size Requirements:
Current Study: n = 115 (94 liver, 21 lung)
Observed Power: 80% for effect size > 0.40
Required for Validation: minimum 42 lung cases (84 liver cases)
Target Total: 126 cases for future validation studies.
Image Acquisition and AnalysisThe patients in this study underwent pretreatment abdominal contrast-enhanced CT scans over the course of a decade, from 2013 to 2023, with both arterial and venous phase. CE-CT scans were performed at the institution (GB Rossi University Hospital).
Contrast-enhanced computed tomography (CT) examinations were performed on 64-slice scanners (Philips Brilliance) using a standardized pancreatic protocol acquired intravenously after injecting iodine-containing contrast media. Image acquisition included late arterial (40–45 s) and venous (65–70 s) phases following intravenous contrast administration. Images were reconstructed at 2.5-mm slice thickness.
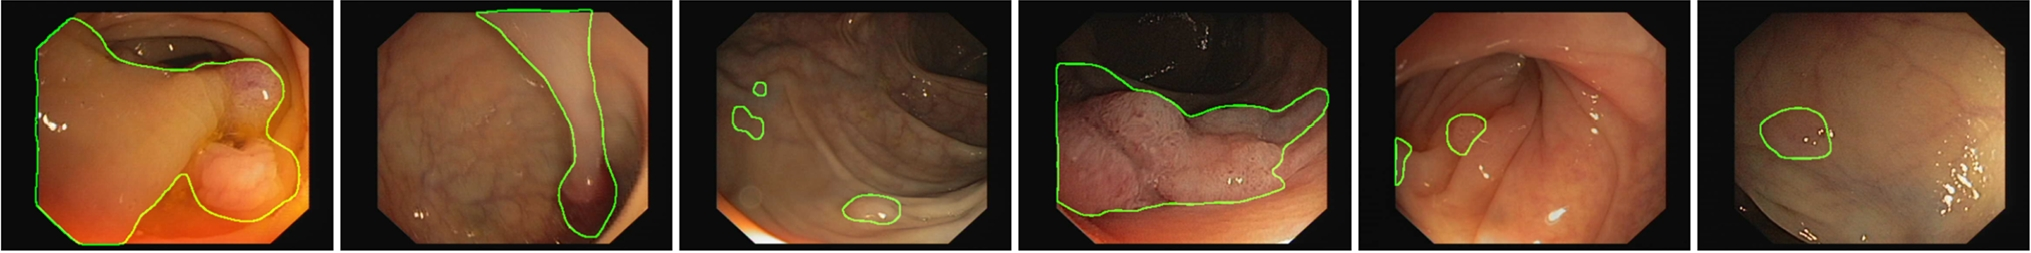
Image Segmentation and Inter-reader Reliability AssessmentAll 115 patients were independently segmented by two board-certified radiologists with 4 years of experience each (Fig. 1). Inter-reader reliability was assessed in a randomly selected subset of 20 cases (16 hepatic metastases, 4 pulmonary metastases), maintaining approximately the same proportion as the overall cohort (94 hepatic, 21 pulmonary). Intraclass correlation coefficients (ICC) were calculated between the two readers'measurements for all radiomic features in this subset. Features demonstrating ICC > 0.9 were considered reproducible and retained for subsequent analysis. For the final analysis of all 115 patients, feature values were calculated as the arithmetic mean of measurements from both readers, but only for those features that had demonstrated ICC > 0.9. Features with ICC ≤ 0.9 were excluded from further analysis. A senior radiologist with 10 years of experience reviewed all segmentations for anatomical accuracy but did not participate in the ICC calculations.
Fig. 1
Pancreatic tumor segmentation example (green region of interest) in late arterial (a) and portal venous phase (b)
Radiomic Feature Extraction and AnalysisQuantitative image features were extracted using the PyRadiomics platform, following the Image Biomarker Standardization Initiative guidelines [22, 23, 24, 25, 26] (Fig. 2). The extraction process yielded 120 standardized features categories included:
First Order Statistics (19 features)
Shape-based 3D (16 features)
Gray Level Co-occurrence Matrix (24 features)
Gray Level Run Length Matrix (16 features)
Gray Level Size Zone Matrix (16 features)
Neighboring Gray Tone Difference Matrix (5 features)
Gray Level Dependence Matrix (14 features).
Fig. 2
Features extraction process flow-chart
Harmonization and PreprocessingTo address scanner-related variability over the 10-year collection period, images were resampled to uniform voxel spacing (1 × 1 × 2.5 mm3) and texture features were calculated using fixed bin width (25 HU) discretization. First-order features preserved original HU values for clinical interpretability. ComBat harmonization was applied to extracted radiomic features with scanner parameters as covariates, reducing technical batch effects while maintaining biological variability.
Statistical AnalysisStatistical analysis followed a comprehensive validation framework.
Feature SelectionFeature selection was performed in two steps; 1) Initial filtering: Features demonstrating inter-reader reproducibility (ICC > 0.9) were retained, reducing the feature set from 120 to 42 (Table S1). 2) LASSO regularization: The 42 reproducible features underwent LASSO (Least Absolute Shrinkage and Selection Operator) regression with fivefold cross-validation to identify the most predictive features while addressing multicollinearity. The optimal lambda parameter was selected using the one-standard-error rule to favor model parsimony. This process selected 18 features for the final model. Feature values used in the analysis represented the average of measurements from both readers. Variance inflation factors (VIF) were calculated to confirm the absence of severe multicollinearity in the final feature set (all VIF < 5).
Class Imbalance ManagementTo address the class imbalance between hepatic (n = 94) and pulmonary (n = 21) metastases, multiple strategies were implemented:
1.Synthetic Minority Over-sampling Technique (SMOTE) was applied during the training phase of each cross-validation fold to generate synthetic samples for the minority class (lung metastases).
2.Class weights were adjusted in the logistic regression model using the'balanced'option, which automatically adjusts weights inversely proportional to class frequencies.
3.Threshold optimization was performed using the validation set to identify the optimal decision threshold that maximizes the geometric mean of sensitivity and specificity, rather than using the default 0.5 threshold.
4.Model performance was evaluated using balanced accuracy and F1-score in addition to standard metrics, as these are more appropriate for imbalanced datasets.
Sensitivity analyses were conducted comparing model performance with and without these class imbalance corrections to assess their impact on the results.
Model EvaluationModel performance was evaluated at the optimal threshold determined by maximizing Youden's index (sensitivity + specificity—1). Performance metrics including sensitivity, specificity, positive predictive value, negative predictive value, precision, recall, and F1 score were calculated with 95% confidence intervals obtained through 1000 bootstrap iterations. The reported AUC-ROC represents the performance of the final multivariate model incorporating all selected features.
Sensitivity AnalysisA comprehensive sensitivity analysis framework was implemented to assess model robustness across multiple parameters. Feature stability was evaluated through different preprocessing methods while threshold analysis was performed across a range of 0.55–0.75 to determine optimal discrimination points. Segmentation variability was assessed through multiple independent readings, and the impact of CT acquisition parameters was systematically evaluated. Model stability was further validated through bootstrap resampling with 1000 iterations, while random subsampling analysis was conducted maintaining the original metastatic ratio to assess generalizability. This multi-faceted approach enabled thorough assessment of the model's technical stability and identification of critical parameters for standardization.
Comments (0)