Cell lines and cell culture
The HEK293T (human embryonic kidney cells), Raji (Burkitt lymphoma cells), and K562 (chronic myelogenous leukemia cells) cell lines were obtained from the American Type Culture Collection (ATCC, USA). For in vivo studies, Raji cells were transduced with luciferase lentivirus and sorted to obtain 100% purity. Raji and K562 cells were cultivated in RPMI-1640 medium (Gibco, USA) supplemented with 10% FBS (Gibco, USA) and 1% glutamine (Gibco, USA), whereas HEK293T cells were cultured in DMEM (Gibco, USA) supplemented with 10% FBS and 1% glutamine (Gibco, USA). All the cell cultures were cultured at 37 °C in a humidified incubator with 5% CO2. The viability of all cells, including T cells, CAR-T cells, and tumor cells, was assessed using Trypan Blue staining before the experiments.
Plasmid preparation
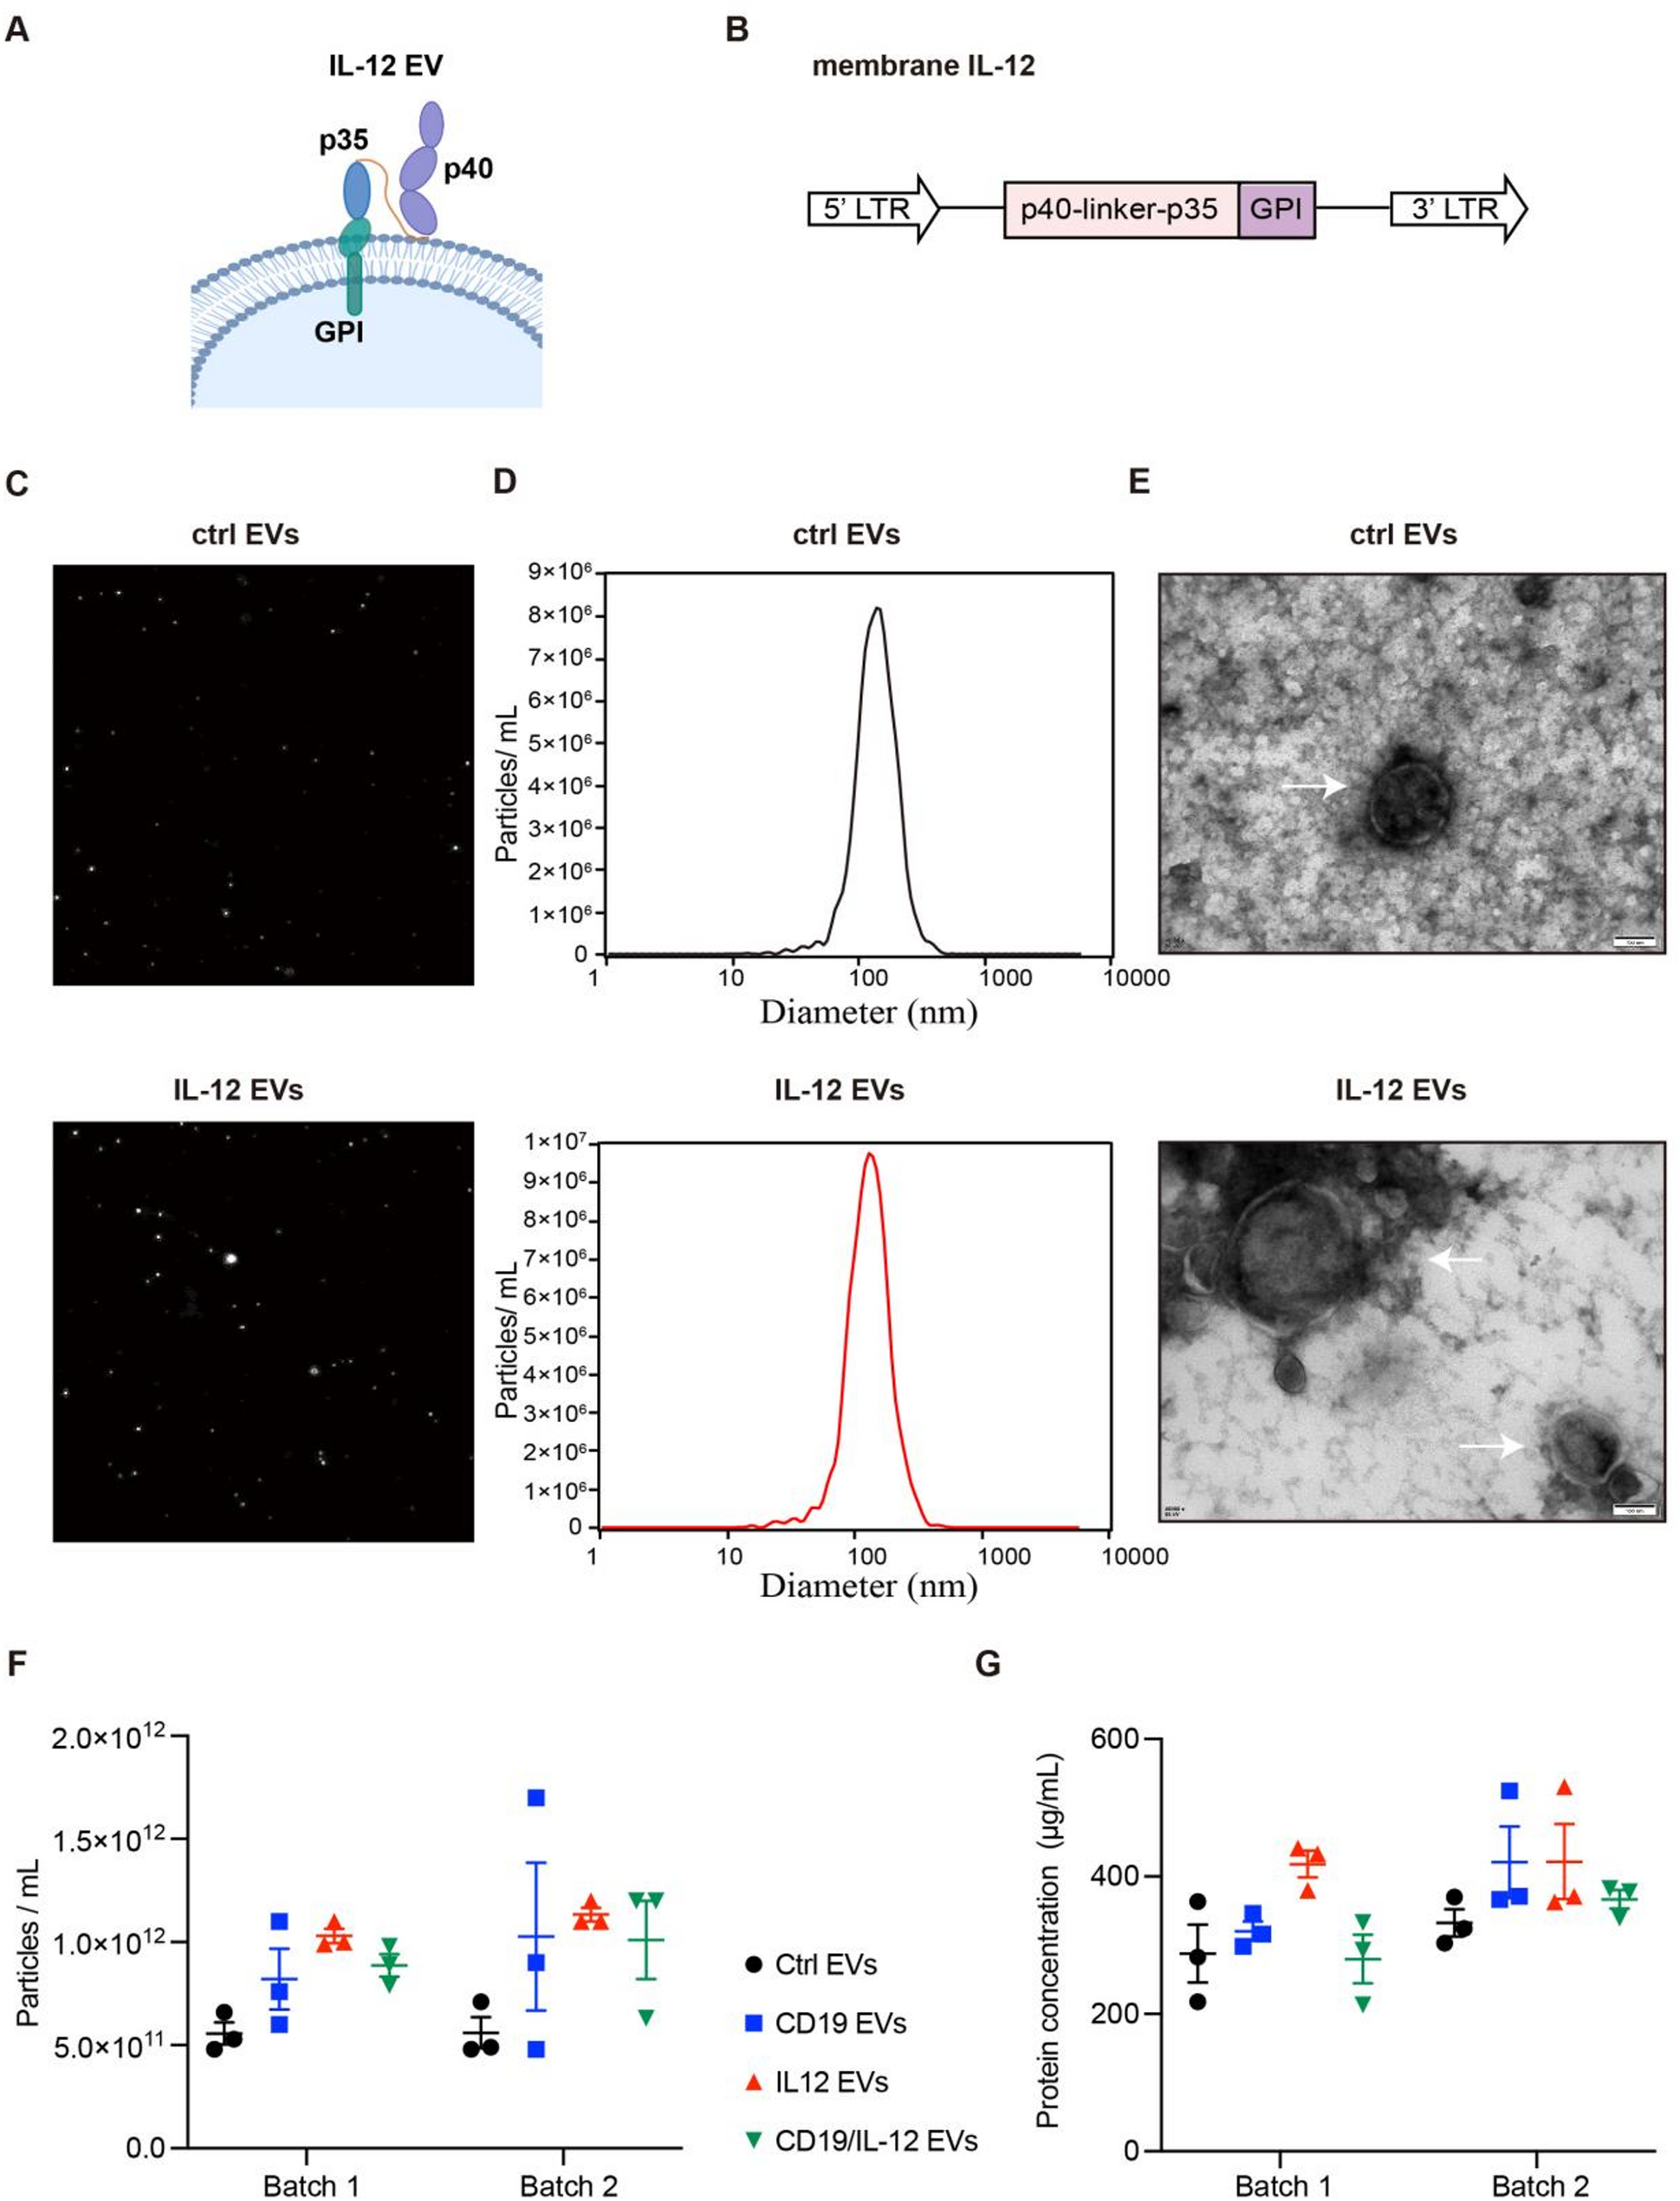
The lentiviral vector encoding CD19, pCDH-CMV-CD19, was obtained from GeneCopoeia. The plasmid encoding human CD22 was purchased from GeneChem (Shanghai, China). The CD19 and CD22 cDNA were amplified and cloned into a lentiviral expression vector provided by GenScript. To express IL-12, a plasmid encoding membrane-anchored IL-12 was constructed by linking the human IL12 subunit p35 and p40 sequences via a flexible linker coupled to a GPI-anchor signal sequence. Similarly, membrane-anchored super IL-2 was constructed by linking the human super IL-2 sequence to a GPI-anchor signal sequence through a flexible linke. These DNA fragments were synthesized, cloned, and inserted into the same lentiviral expression vector provided by GenScript.
The anti-CD19 CAR and anti-CD22 CAR lentiviral plasmid were constructed as described previously [49]. For laboratory verification, the anti-CD19 CAR gene was linked to a truncated sequence of epidermal growth factor receptor (EGFRt) via the T2A sequence [50]. The CD3ζ-deficient anti-CD19 CAR lentiviral plasmid was generated by removing the CD3ζ signaling domain from the aforementioned structures.
Lentivirus preparation and transfection
Lentiviral particles were produced by transient transfection of HEK293T cells with packaging vectors of psPAX2 and pMD2.G and lentiviral expression vectors containing the target plasmids at a 1:1 ratio using PEI reagents. After 48 h of transfection, the viral supernatants were collected and centrifuged at 4 °C for 30 min to remove debris. The supernatants were passed through a 0.45 μm Thermo Scientific filter, and the viral particles were subsequently concentrated via centrifugation at 4 °C and 30,000 × g for 150 min (Avanti J-26 S XPI high-performance centrifuge, Beckman Coulter). To determine lentiviral titer, HEK293T cells were transduced with serial dilutions of concentrated lentiviral particles. 48 h post-transduction, genomic DNA was extracted, and the number of integrated lentiviral copies was quantified by RT-PCR, and the titer was calculated as described previously [51, 52].
Generation of overexpressing cell lines
1 × 10⁵ HEK293T cells were transduced with 2 × 10⁶ TU lentiviruses encoding either a control lentiviral vector or lentiviral vectors encoding human IL-12, CD19, CD22, or IL-2 at a multiplicity of infection (MOI) of 20. To obtain cell lines stably expressing IL-12, CD19, CD22, and IL-2 respectively, HEK293T cells were sorted for stable expression of corresponding surface proteins using a MoFlo XDP flow cytometer (Beckman Coulter). To obtain CD19/IL-12, CD22/IL-12 or CD19/IL-2 coexpressed HEK293T cell lines, IL-12 or IL-2 expressing HEK293T cells were transduced with lentiviral vectors encoding either a control lentiviral vector or lentiviral vectors encoding human CD19 or CD22 at a MOI of 20 and sorted again.
Isolation and characterization of EVs
EVs were isolated from HEK293T cells and engineered HEK293T cell lines using previously described methods [26, 28]. 1 × 10⁷ EV producer cell lines were plated in 15 cm dishes and incubated in 25mL serum-free medium for 24 h to allow EVs secretion. Subsequently, the cells were exposed to ultraviolet B (UVB) irradiation (300 J/m²) for 1.5 h. The conditioned medium was collected and centrifuged at 500 × g for 10 min to remove cell debris. Subsequently, the supernatant was filtered through a 0.45-µm sterile filter (Thermo Scientific), and further centrifuged at 14,000 × g for 1 h at 4 °C using an Avanti J-26 S XPI high-performance centrifuge (Beckman Coulter). The isolated EVs were resuspended in 100 µL of phosphate-buffered saline (PBS) and stored at -80 °C until further analysis.
The protein concentration of isolated EVs was determined using a BCA protein analysis kit (Beyotime, China). The concentration and size distribution of EVs were determined by nanoparticle tracking analysis (NTA) based on their Brownian motion. The NTA results were analyzed using the ZetaView multiple-parameter particle tracking analyzer (Particle Metrix), and size distribution data and particle tracking videos were subsequently processed with ZetaView software. EVs characterization by NTA and protein quantification was performed using two independent EVs batches, each measured in three technical replicates. The morphology of EVs was determined by transmission electron microscopy (TEM) using a Tecnai G2 20 TWIN microscope operated at 80 kV. The presence of the EV-associated marker Annexin A1 was further confirmed by immunoblotting, as described below. The concentrations of human IL-12 and IL-2 in EVs were measured using quantitative ELISA kits specific for each cytokine (QuantiCyto, Shenzhen, China).
EV labeling and data acquisition
Purified EVs were stained with PE-conjugated anti-human IL-12 p70 (clone: 20C2; BD Biosciences) and APC-conjugated anti-human CD19 (clone: HIB19; BioLegend) diluted in PBS filtered through membranes with 0.22 μm-sized pores at 4 °C for 30 min in the dark, washed with filtered PBS and resuspended in filtered PBS. The samples were immediately subjected to flow cytometry (ImageStreamxMkII cytometer, Amnis), and the data were analyzed using IDEAS 6.2 software (Luminex) as described previously [53, 54]. The fluidics settings were set to “low speed/high sensitivity” for all sample data acquisition at 60x magnification.
The same gating strategy was used when different samples were analyzed. The controls included unstained samples, buffer-only controls, and buffer plus reagent controls, and single-stained samples were used for fluorescence compensation. The low-SSC region was circled by side scatter (Ch06) and then used to further analyze the fluorescence events (> 10,000 events were acquired). On the basis of these single-positive fluorescent populations, single-positive gating areas were established, and double-positive gates were set on the basis of the boundaries of the single-positive gates. The low ends of the various gates were defined via unstained samples.
Western blotting
To characterize the molecules present in EVs and cells, western blotting was conducted. Briefly, purified EVs or cells were lysed with RIPA lysis buffer supplemented with 1 mM PMSF and a protease inhibitor cocktail. Protein lysates (40 µg per sample) were then separated via 4–12% SDS‒PAGE. The resulting proteins were transferred onto PVDF membranes (Millipore, USA) and blocked with 5% skim milk for 1 h at 25 °C. For EV molecule characterization, the membranes were incubated overnight at 4 °C with the following antibodies on a shaker: an anti-Annexin A1 antibody (Abcam, ab214486, 1:2000), and anti-IL-12 p70 antibody (R&D Systems, MAB219-SP, 1:1000). Total STAT4 and phosphorylated STAT4 in T cells were detected using an anti-Stat4 (C46B10) antibody (CST, 2653 S, 1:1000) and an anti-phospho-Stat4 (Tyr693) antibody (CST, 5267 S, 1:1000). After three washes with TBST, the membranes were incubated with HRP-conjugated secondary antibodies (1:1000) at room temperature for 1 h. The membranes were then developed using Pierce ECL reagent (Thermo Fisher, USA), and all images were captured using Image Lab software (Bio-Rad).
Generation of CAR-T cells
Peripheral blood mononuclear cells (PBMCs) were harvested from whole blood using Ficoll-Paque Plus (GE Healthcare, USA), and CD3 + T cells were isolated from human PBMCs using Miltenyi Biotec CD3 microbeads (Germany). Primary T cells were stimulated with T-Activator CD3/CD28 magnetic beads (Thermo Fisher Scientific, 11131D) at a bead: cell ratio of 1:1 and cultured in CTS medium (Gibco, USA) supplemented with 2% human FBS, 2 mM l-glutamine (Gibco, USA), and 200 IU/mL human recombinant IL-2 (PeproTech, USA). After 24 h, activated T cells were transfected with the anti-CD19 CAR virus or anti-CD22 CAR virus, while non-transduced T cells served as a negative control. Throughout the cultivation process, T cells and CAR-T cells were cultivated at a density of 0.5–2.0 × 10⁶/mL, and the medium was changed every 2–3 days. CAR transduction efficiency was routinely assessed by flow cytometry prior to every functional assay.
Primary NK cells isolation and culture
Human primary NK cells were obtained from Milestone Biological Science&Technology Co., Ltd. (Shanghai, China). NK cells were isolated by Positive Selection using an NK cell isolation kit (STEMCELL Technologies, Catalog #17855), following the manufacturer’ s protocol. Fresh NK cells were activated using m21-K562 feeder cells (Hangzhou Zhongying Biomedical Technologies, China) at a 1:2 ratio. The NK cells were cultured in complete KBM581 medium (Corning, New York, USA), supplemented with 10% FBS and 200 IU/ mL IL-2 for 10 days prior to use.
Flow cytometry
For cell surface staining, the cells were resuspended in PBS supplemented with antibodies for 15 min at room temperature. Flow cytometry analysis was conducted using either a NovoCyte flow cytometer (ACEA Biosciences) or a MACSQuant Analyzer 10 flow cytometer (Miltenyi Biotec), and the data were analyzed with NovoExpress software (ACEA Biosciences) or FlowJo software (Tree Star).
PE-conjugated anti-human IL-12 p70 (clone: 20C2; BD Biosciences) and APC-conjugated anti-human CD19 antibodies (clone: HIB19; BioLegend) were used to assess the expression of CD19 and IL-12 on 293T cells. PE-conjugated anti-human IL-2(clone: MQ1-17H12; BioLegend) and APC-conjugated anti-human CD19 antibodies (clone: HIB19; BioLegend) were used to assess the expression of CD19 and IL-2 on 293T cells. For the assessment of CD22 and interleukin-12 (IL-12) expression, PE-conjugated anti-human IL-12 p70 antibody (clone 20C2; BD Biosciences) and Brilliant Violet 421 (BV421)-conjugated anti-human CD22 antibody (clone S-HCL-1; BioLegend) were applied. The following antibodies were used to characterize the phenotype and function of CAR-T cells: PE/Cyanine7-conjugated anti-human CD8 (clone: RPA-T8, BioLegend), BV421-conjugated anti-human CD4 (clone: RPA-T4; BD Biosciences), FITC-conjugated anti-human CD3 (clone: HIT3a; BD Biosciences), APC-conjugated anti-human CD45RO (clone: UCHL1, BioLegend), BV605-conjugated anti-human CD62L (clone: DREG-56; BD Biosciences), BV785-conjugated anti-human PD-1 (clone: EH12.2H7, BioLegend), BV650-conjugated anti-human LAG-3 (clone: HC3C65, BioLegend), PE-conjugated anti-human TIGIT (clone: A15153G; BioLegend), BV421-conjugated anti-human TIM-3(clone: A18087E; Bioligand), and PerCPCy5.5-conjugated anti-human CD4 (clone: RPA-T4; BioLegend) antibodies.
For CD19 CAR expression assays, cells were stained with PE-labeled (Acro Biosystems, Cat.CD9-HP2H3) or FITC-labeled human CD19 protein (Acro Biosystems, Cat. CD9-HP2H3) or APC-conjugated anti‐human EGFR (clone: AY13; BioLegend) For CD22 CAR expression analysis, cells were stained with FITC-labeled (Acro Biosystems, Cat. No. CD2-HF254) or APC-labeled recombinant human CD22 protein (Acro Biosystems, Cat. No. SI2-HA2H4).
T cell degranulation assay
CAR-T cells (5 × 10⁴ CAR + cells) were co-incubated with Raji cells at an effector: tumor (E: T) ratio of 1:1 in 200 µL RPMI 1640 medium containing APC-conjugated CD107a antibody (clone H4A3; BioLegend) for 4 h. During the incubation, cells were treated with EVs (total protein concentration: 167 µg/mL, approximately 3.4 × 10¹¹ EVs particles/mL, IL-12 concentration for EVs containing IL-12: 667 pg/mL) or PBS. After incubation, cells were washed twice with PBS, stained with anti-human CD3/CD8/CAR antibodies, and analyzed by flow cytometry.
Functional analysis of CAR-T cells
For the cytokine release assays, CAR-T cells (5 × 10⁴ CAR + cells) were seeded in a 96-well plate and cocultured with 5 × 10⁴ Raji cells or K562 cells at an E: T ratio of 1:1 in the presence of various types of EVs (167 µg/mL) or recombinant IL-12 (667 pg/mL). After 24 h, culture supernatants were harvested by centrifugation at 300 × g for 10 min and stored at − 80 °C. Secretion of IFN-γ, TNF-α, and IL-2 in the supernatants were quantified using cytokine-specific ELISA kits (Neobioscience Technology, China).
For the phenotype assay, 3 × 10⁵ CAR-T cells were incubated with 300 µL EVs (167 µg/mL) for 7 days, after which differentiation status and exhaustion marker expression were assessed by flow cytometry.
To analyse the proliferation of T cells, 3 × 10⁵ CAR-T cells were labeled in advance with 2 µM CellTrace™ Violet (Thermo Fisher) and mixed with various types of EVs (167 µg/mL) in 300 µL medium. As a control, labeled CAR-T cells were cultured in presence of 20 ng/mL rhIL-2. After a 96-hour incubation period, cell proliferation was evaluated by flow cytometry.
In vitro cytotoxicity assay
Raji or K562 cells were labeled with 1 µM CellTrace™ Violet (Thermo Fisher) before being washed with PBS to remove excess dye. 5 × 10⁴ CAR-T cells were subsequently cocultured with 5 × 10⁴ CFSE-labeled Raji or K562 cells at an effector: tumor (E: T) ratio of 1:1 in the presence of various types of EVs (167 µg/mL). The cells were harvested after 24 h and stained with propidium iodide (PI) (BD Pharmingen). Flow cytometry was used to analyze the relative cytotoxicity of CAR-T cells toward tumor cells by quantifying the percentage of dead tumor cells among the CFSE-labeled tumor cells.
Repeated stimulation assays with EVs
CAR-T cells (3 × 10⁵ CAR + cells) were co-cultured with 1 × 10⁵ Raji cells at a 3:1 ratio of in the presence of EVs (167 µg /mL). After 3 days, T cells were harvested, counted, and re-plated with fresh Raji cells at the same effector-to-target ratio, together with the corresponding EVs. This cycle of counting, replating with fresh tumor cells, and EVs supplementation was repeated every 3 days. At the end of each stimulation round, T cells were analyzed by flow cytometry to assess T cell subsets and expression of exhaustion markers.
Intracellular IFN-γ and phosphorylated STAT-4 staining
2 × 10⁶ CAR-T cells were resuspended in 2 mL medium and incubated with different EVs (167 µg/mL) or PBS, in the presence of a protein transport inhibitor (BD Bioscience, 54655). Cell surface staining was conducted, followed by cell fixation and permeabilization via a Cytofix/Cytoperm Kit (BD Biosciences, 558050). The cells were subsequently stained with the intracellular antibody FITC-conjugated anti-human IFN-γ (clone 4 S. B3; BioLegend) at 4 °C for 30 min. After a wash step, flow cytometry analysis was performed.
Before analysis, human NK cells were deprived of IL-2 by incubation in serum-free medium for 24 h. Following starvation, 2 × 10⁶ NK cells were cultured with different EVs (total protein concentration: 250 µg/mL, IL-12 concentration for EVs containing IL-12: 1000 pg/mL) in 2 mL medium for 45 min. Cells were then harvested for surface and intracellular staining. Surface markers were stained first, followed by fixation and permeabilization using the Cytofix/Cytoperm Kit (BD Biosciences, cat. 558050), according to the manufacturer’s protocol. IFN-γ secretion was measured using ELISA kits specific for human IFN-γ (QuantiCyto, Shenzhen, China). Intracellular staining was performed using AF647-conjugated anti-pSTAT4 (Y693) antibody (BioLegend, cat. 562074) at 4 °C for 30 min. After washing, samples were analyzed by flow cytometry.
Binding and cellular uptake of EVs
EVs were labeled with 10 µM DIO (Invitrogen, USA) in PBS at 4 °C for 2 h, washed twice with PBS to remove free dye and then pelleted by ultracentrifugation at 14,000 × g for 1 h at 4 °C. To analyze the efficiency of EV uptake by CAR-T cells, 3 × 10⁵ CAR-T cells were incubated with 167 µg/mL DIO-labeled EVs in 300 µL medium for 4 h at 37 °C and then analyzed by flow cytometry (Nova Express).
Imaging of CAR-T-cell–EV interactions
To image and evaluate the interactions between CAR-T cells and EVs, 2 × 10⁶ CAR-T cells were resuspended in 2 mL medium and treated with different EVs (167 µg/mL) for 45 min at 37 °C. The cells were then collected and washed with PBS to remove unbound EVs, followed by staining with anti-EGFR-APC, anti-CD3-FITC, and anti-IL-12p70-PE antibodies at room temperature for 30 min.
The samples were immediately assessed by flow cytometry (ImageStreamxMkII cytometer, Amnis). A minimum of 5000–15,000 cell events were acquired on each sample with a low acquisition rate for high sensitivity at 60x magnification. Compensations were performed with at least 2000 cell events acquired from singly stained tubes. The acquired images and data were analyzed via IDEAS 6.2 software (Luminex) as previously described [55, 56]. The gating strategy employed the following steps: focusing on events based on the gradient RMS values; identifying singlets by evaluating the area of the bright field (Ch01) vs. the aspect ratio of the bright field (Ch01), with a defined aspect ratio > 0.8; further selecting singlets using CD3-FITC (Ch02) to define T cells; within the T-cell gate, distinguishing between CAR-positive and CAR-negative T cells using EGFR-APC (Ch05); and detecting cells bound to EVs by IL-12p70-PE (Ch03) positivity within the CAR-positive T-cell population, as EVs were labeled with IL-12p70. The same gating strategy was applied for the analysis of different samples.
RNA-seq and analysis
CAR-T cells were treated with control EVs, CD19 EVs, IL-12 EVs, or CD19-IL12 EVs for 24 h. The cells were then harvested and washed with PBS. RNA library sequencing was performed on the Illumina HiSeq2500 platform by Gene Denovo Biotechnology Co., Ltd. (Guangzhou, China). The raw sequencing data in this study are available upon request. The DESeq2 R package was used to estimate differential gene expression. Differentially expressed genes were defined as genes with Q values < 0.05 and log2FC > 1. Pathways of enrichment analysis of differentially expressed genes were analyzed via the clusterProfiler R package. Gene set enrichment analysis (GSEA) was conducted via the GSEA tool in R.
IL-12 regulon identification and analysis
The IL-12-regulated gene set was obtained by comparing the upregulated DEGs in the IL-12 EV group with those in the control EV group and the upregulated DEGs in the CD19/IL-12 EV group with those in the CD19 EV group (thresholds: log2-fold change > 1, FDR < 0.05; Table S1). Gene signature scores were calculated as described previously [57]. The expression data used for scoring the gene signature included gene expression data from activated anti-CD19 CAR-T-cell products derived from CLL patients published by Joseph A. Fraietta et al. [3]. The enrichment scores of the IL-12 regulon were analyzed via single-sample GSEA (ssGSEA). The Mann‒Whitney U test was performed to compare ssGSEA enrichment scores between responders and nonresponders.
In vivo mouse experiments
All animal experiments were performed in compliance with the procedures adopted by the Laboratory Animal Welfare and Ethics Committee of Tongji Hospital, Wuhan, China (TJH-202011005).
Female 5- to 6-week-old NCG mice (obtained from GemPharmatech, China) were subcutaneously injected in the right flank with Raji-luc lymphoma cells (5 × 10⁶ cells in 50 µl of Matrigel matrix and 50 µl of PBS). Following tumor implantation, tumor length and width were measured with a digital caliper every 3–5 days, and tumor volume was calculated via the formula (width^2 × length)/2. In addition, weekly in vivo imaging of Raji-luc cells in the mice was performed via an IVIS imaging system, and the obtained data were analyzed using Living Image software. Once the subcutaneous tumors reached 50 to 100 mm3, the mice were intravenously injected with 1 × 10⁶ CAR-T cells (with CAR transduction efficiency of 15%) or 6.67 × 10⁶ untransduced T cells as control. The mice were randomly assigned to different treatment groups and received intratumoral injections of control EVs, CD19 EVs, IL-12 EVs, or CD19/IL-12 EVs (with protein content of 200 µg, approximately 4 × 10¹¹ EV particles per mouse) on days 1, 3, and 5 following CAR-T-cell treatment. The body weights and overall conditions of the mice were monitored every three days. The mice were euthanized if they exhibited signs such as initial weight loss exceeding 20%, significant lethargy, a hunched posture, severe diarrhea, severe dermatitis, or if the tumor volume exceeded 1500 mm3.
To evaluate inflammatory cytokines and monitor CAR-T-cell amplification, 100 µl of peripheral blood from each mouse was collected via orbital blood for subsequent flow cytometry analysis and cytokine assays.
Droplet digital PCR
The expansion and persistence of CAR-T cells in mice were detected via droplet digital PCR as previously described [58]. The following primers were used in this study: the CAR forward primer 5’-CAGCAAAAA TACGACCTCCTCACT-3’, the reverse primer 5’-TGGTGCTGCCTTTGA TCTCA-3’, and the probe 5’-FAM-TTGGCGGGAGGGACC-3’. The samples were tested via a Quantalife QX200 Droplet Digital PCR system (Bio-Rad). The data were analyzed using QuantaSoft software version 1.7.4 (Bio-Rad).
Measurement of serum cytokine levels
Mouse serum was isolated from whole blood supernatants for cytokine analysis. The serum levels of human IFN-γ, TNF-α, IL-12p40, IL-2, IL-10, and IL-4 were evaluated by a human cytokine cytometric bead array kit (Human IL-2 Flex Set #cat.558270; Human IL-4 Flex Set #cat.558272; Human TFN-a Flex Set #cat.560112; Human IL-6 Flex Set #cat.558276; Human IL-12 Flex Set #cat.55828; Human IFN-g Flex Set cat.560111; BD Biosciences) according to the manufacturer’s instructions. The data were collected using a NovoCyte Flow Cytometer (ACEA Biosciences) and analyzed using FCAP.GUI. software.
Histopathological analysis
After therapy, the major organs of the mice were excised, fixed in 4% paraformaldehyde, and embedded in paraffin. Sections were cut at 3 μm, and pathological examination was performed by hematoxylin and eosin (H&E) staining.
Statistical analysis
All experiments were independently repeated at least three times. Data are presented as mean ± SEM and were analyzed using GraphPad Prism version 9.0.The statistical significance of differences between two groups was determined via two-tailed paired or unpaired t tests, whereas comparisons between multiple groups were performed via one-way or two-way ANOVA. Animal survival was assessed via the log-rank (Mantel‒Cox) test. The error bars in this study represent mean ± standard error of the mean (SEM). A p value of less than 0.05 was considered statistically significant, with significance levels indicated by asterisks (ns for not significant; *p < 0.05; **p < 0.01; ***p < 0.001; ****p < 0.0001).


Comments (0)