Inclusion and ethics
This study was performed in line with the principles’ approval of the Declaration of Helsinki. Study protocol approval was granted by the Medical Ethics Committee of the Netherlands Cancer Institute—Antoni van Leeuwenhoek Hospital (METC-AVL) under file no. NL72486 031 20, dated 26 June 2020. Written informed consent was obtained from all participants. The authors affirm that human research participants provided informed consent for publication of their images. Participants received no compensation for participating in this study.
Patient eligibility
Patients aged ≥18 years, with a World Health Organization’s performance status scale WHO 0–1, who presented with CSCC stage III–IVa eligible for extensive curative-intent surgery (± adjuvant RT), or patients with (multifocal) stage I–II CSCCs and an indication for disfiguring curative-intent surgery were included. Tumors were staged according to the American Joint Committee on Cancer Guidelines, 8th edn (AJCC 8th edn)51. Key exclusion criteria were distant metastases, irresectable disease, prior RT to the current tumor bed, prior IT, autoimmune disease, HIV or hepatitis B or C infection, or use of immunosuppression. Details are provided in the study protocol (Supplementary Note 1).
Trial design
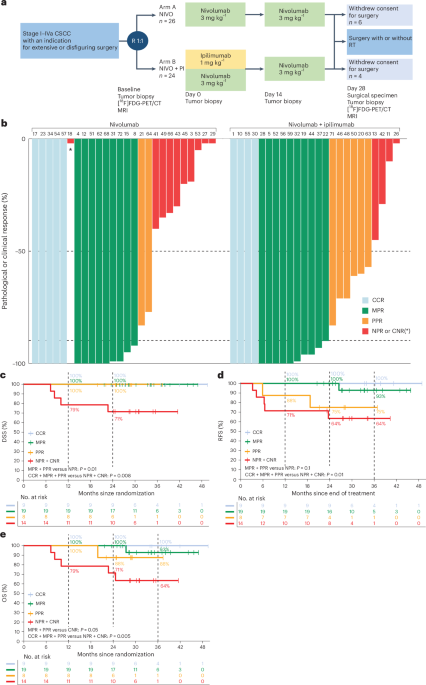
We aimed to include 40 patients in this investigator-initiated, randomized, noncomparative, multicenter phase 2 trial. This study was conducted across two Dutch centers at the Netherlands Cancer Institute—Antoni van Leeuwenhoek Hospital (NKI-AVL) and University Medical Center Utrecht (UMCU). Patients were randomized 1:1 into either arm A, receiving two courses of nivolumab 3 mg kg−1 (weeks 0 and 2) or arm B, receiving two courses of nivolumab 3 mg kg−1 (weeks 0 and 2) and one course of ipilimumab 1 mg kg−1 (week 0 only), before SOC surgery (week 4) with or without RT (Fig. 1a), coordinated by the independent NKI-AVL trial bureau through ALEA Clinical Services. No blinding for the treatment arm was performed. Ten patients opted to forgo surgery and were not evaluable for the primary trial endpoint. They were not excluded from the trial, received neoadjuvant ICB, trial interventions (tumor samples and HRQoL questionnaires) and equal FU when compared to patients receiving neoadjuvant ICB and SOC Ten additional patients were included to meet the primary trial endpoint. Adjuvant RT was administered according to national guidelines32. Sex was recorded as assigned at birth based on medical records. Sex-based and gender-based analyses were not pre-specified in the study design, due to the low sample size.
Patients received functional (f)MRI and [18F]FDG-PET/CT scans, US-FNAC of regional lymph nodes when indicated and clinical photography at baseline and after IT shortly before surgery. QoL questionnaires (European Organisation for the Research and Treatment of Cancer Quality of Life Questionnaire Core 30 (EORTC-QLQ-C30) and EuroQol-5 Dimension 5-Level (EQ-5D-5L)) were collected at baseline, before surgery in week 4, and at months 3, 6, 9, 12, 18 and 24 of FU. FU started from the last day of treatment (surgery or last course of IT). Tumor biopsies and blood samples were collected at baseline and weeks 1, 2 and 4 upon IT. Sequential tumor biopsies were collected from the original tumor site (also in case of a (near) complete response) as the previous tumor biopsy. Lymph node biopsies were not mandatory.
Primary objective
The primary objective was to determine the histopathological response rate to neoadjuvant NIVO and NIVO + IPI at the time of SOC surgery with or without adjuvant RT. Histopathological tumor response was defined as the proportion of viable tumor cells left in the surgical resection specimen. The trial was not designed or powered to compare the efficacy of both treatment arms.
Secondary objectives
The secondary objectives included safety of neoadjuvant nivolumab with or without ipilimumab before SOC surgery (via CTCAE v.5.0 and the Clavien–Dindo criteria33). IrAEs were registered up to 100 d after the last ICB dose. We assessed DSS, RFS and OS at 6 months and 2 years of FU. OS and DSS were calculated from the day of randomization. RFS was calculated from the last day of treatment, which was defined as the last day of adjuvant RT, surgery or last IT. We investigated HRQoL (via EORTC-QLQ-C30 v.3.0 and EQ-5D-5L questionnaires) and cost-effectiveness of adding NIVO and NIVO + IPI to the SOC treatment regimen. [18F]FDG-PET/CT and MRI were correlated to the histopathological tumor response as measured in the surgical resection specimen. MRI data have been described briefly in this paper, whereas fMRI data will be described separately in another paper. The pathological response of post-treatment tumor biopsies in week 4 were correlated to the pathological response in the whole tumor resection specimen. Finally, we assessed the clinical and pathological response of actinic keratosis to ICB at day 28 (at time of surgery) and during FU. The results of this last secondary endpoint will be reported in another paper.
Exploratory endpoints
To investigate the predictive biomarkers for response to IT and the dynamics of the tumor immune compartment in responders and nonresponders during IT, patients provided a serial collection of tumor specimens and blood samples at multiple timepoints per patient: at baseline, weeks 1, 2 and 4 after start of IT, for WES, RNA-seq, single-cell sequencing analyses and an ex vivo platform52. Single-cell sequencing data, data from the ex vivo platform and detailed peripheral blood data will be reported in another paper.
Pathological assessment
Pathological response was centrally reviewed by an experienced head and neck pathologist (L.S.) on hematoxylin and eosin-stained, formalin-fixed paraffin-embedded (FFPE) sections of the post-treatment surgical specimens according to the International Neoadjuvant Melanoma Consortium scoring system proposed by Tetzlaff et al.53: PCR (the absence of viable tumor in the surgical specimen), MPR (≤10% viable tumor, including PCR), PPR (>10% but ≤50% viable tumor) and NPR (>50% viable tumor). For patients with a primary tumor (cT1–4 N0–3), the pathological response at the primary tumor site was taken as the endpoint. For patients with LNMs only (cT0 N1–3), the averaged pathological response of all LNMs was taken as the endpoint.
For primary tumors (patients with cT1–4 N0–3 CSCC), the proportion of viable tumor within the total tumor bed area was quantified as a percentage. This tumor bed area was defined as the combined region in the resection specimen occupied by viable tumor cells, along with areas of necrosis, keratinous debris, fibrosis and multinucleated giant cell reactions (indicating immune-related regression of the pre-existing tumor bed).
To determine the pathological response in patients with one or more LNM(s), the same method, as described above, is used to assess the pathological response (defined as MPR, PPR or NPR) in all LNMs. At baseline, US-FNAC was performed on all suspect lymph nodes to confirm a LNM. In the case of N+ disease, a regional lymph node dissection was performed in week 4. In the surgical specimen, the response in each LNM was assessed separately and then averaged in case of more than one LNM. Subsequently, we were able to make a definite distinction between LNMs (and assess their individual response to ICB) and reactive lymph nodes. As spontaneous necrosis is relatively common in CSCC LNMs, necrosis alone, without other indicators of IT response (such as fibrotic scar tissue formation, neovascularization, abundance of multinucleated giant cells or macrophage aggregates), was not considered sufficient to qualify as a treatment response.
As previously reported in patients with stage III melanoma treated with neoadjuvant IT34, the pathological response of the ILN is a surrogate marker for the average pathological response of all LNMs. In the MATISSE study, we also assessed the accuracy of the pathological ILN response as an indicator for the averaged pathological LNM response at time of surgery. The ILNs were defined as the largest LNMs observed on pre-treatment MRI or Blanco-CT scan and anatomical correlation was made in the resection specimen to assess its pathological response. Subsequently, its pathological response was correlated to the averaged overall lymph nodal response in the whole regional lymph node dissection.
To correlate the pathological response in the tumor biopsy (collected in week 4) to the pathological response in the whole resection specimen or clinical response in patients who opted to forgo surgery, tumor biopsies were collected at week 4 from the primary tumor (n = 31) and/or the (index) LNM (n = 8). Tumor biopsies (4–5 mm) were collected during surgery under either general anesthesia (n = 27) or local anesthesia in patients who opted to forgo surgery (n = 7), or at the pathology department directly after surgery and before routine formaldehyde fixation (n = 5). Reasons for missing tumor biopsies (n = 11) included: no pathological lymph node palpable (n = 4), lymph node too small for US-guided biopsy (n = 1), nonrepresentative biopsy (n = 1), no patient consent (n = 1) or forgot to take biopsy (n = 4). The same method, previously described above, was used to determine the pathological response in the tumor biopsies.
Clinical response assessment
The clinical response was based on the SOC physical examination, imaging and pathology. The CCR to neoadjuvant IT was defined as the absence of macroscopic disease (via physical examination and imaging) and no microscopic disease (via cytological puncture or histological biopsy).
Imaging-based response evaluation
[18F]FDG-PET/CT scans were performed at baseline, repeated in week 4 shortly before surgery and evaluated by a blinded (for pathological or clinical response) nuclear physician (M.W.). At the primary tumor site and/or at the ILN, the following cutoff measurements were calculated: SUVmax (signal intensity of most avid voxel), SUVmean (mean intensity of voxels within tumor volume with intensity ≥50% of SUVmax) and metabolic tumor volume (MTV50%; volume taken up by voxels within the tumor with intensity ≥50% of SUVmax, respectively). The tumor area with ≥50% of SUVmax of the tumor at baseline was used to define the on-treatment MTV50% in week 4 before surgery. TLG50% was defined as the product of MTV50% and SUVmean. TLG50% was not feasible in superficial or low metabolic tumors. MTV50%, and therefore TLG50%, could not be reliably calculated in patients whose tumors could not be clearly visualized or distinguished from surrounding physiologically FDG-avid tissues. The percentage changes in TLG50% of the primary tumor and ILN between pre-treatment and on-treatment PET scans were separately correlated to their pathological or clinical ICB response.
MRI scans were predominantly acquired on a 3-T MRI scanner (Philips Healthcare) acquired at baseline and repeated in week 4 shorty before surgery. The protocol included T2-weighted (4 mm), short tau inversion recovery (5 mm), T1-weighted (4 mm) and post-contrast T1-weighted sequences (4 mm with and without fat suppression) using gadoteric acid (Dotarem, Guerbet). Diffusion-weighted imaging was performed using both EPI (b = 0, 200 or 1,000 s mm−2) and SPLICE sequences (b = 0–1,000 s mm−2; 10 steps), each with a slice thickness of 4 mm. MRI-based radiological response to IT was assessed in week 4 using MR-RECIST v.1.1 (ref. 54) by a blinded (for pathological or clinical response), experienced head and neck radiologist (B.W.) and correlated to the pathological response in the surgical specimen or clinical response. The pathological response was based on the response in the primary tumor (T1–4 N0–3) or the averaged nodal response (T0 N1–3).
QoL, healthcare needs and costs
To prospectively investigate the HRQoL, the EORTC-QLQ-C30 and EQ-5D-5L questionnaires were collected at baseline, in week 4 before surgery and in FU at 3, 6, 9, 12, 18 and 24 months. At the time of the data cutoff (30 September 2024), 361 EORTC-QLQ-C30 questionnaires were completed at baseline (n = 50), week 4 (n = 48) and in FU at months 3 (n = 45), 6 (n = 46), 9 (n = 46), 12 (n = 45), 18 (n = 45) and 24 (n = 36). The patient with CNR (MAT no. 18) was excluded from these analyses because he was treated with palliative RT only, after choosing not to undergo surgery. Differences in unadjusted mean HRQoL scores per treatment response groups (CCR, MPR, PPR and NPR) were calculated at multiple timepoints (baseline, week 4, and 3, 6, 12, 18 and 24 months of FU). Differences in adjusted HRQoL mean scores (adjusted for age and sex) were calculated and compared between patients treated with IT alone (n = 9) and patients who were treated with neoadjuvant IT and SOC (n = 40), in a linear mixed-effect model. Clinical relevance was according to the guidelines of Cocks et al.55.
Furthermore, a model-based cost-effectiveness analysis was performed to compare the expected cost-effectiveness of neoadjuvant IT (IT alone) to neoadjuvant IT + SOC surgery with or without adjuvant RT (IT + SOC) in patients with CSCC. The outcomes are expressed in incremental costs, incremental QALYs and the incremental cost-effectiveness ratio. A Markov model is developed with three mutually exclusive health states, using a 24-month time horizon after the trial and a 3-month cycle length, a healthcare perspective from the Netherlands56. Input parameters for the cost-effectiveness model are shown in Supplementary Table 8. Effectiveness data were derived from the trial, expressed by OS and RFS. QALYs were calculated by multiplying the life-years gained by the QoL, expressed by utility measures obtained from the EQ-5D-5L questionnaire for the ‘progression-free’ health state in each arm. The utility after progression was obtained from the literature, similar for both treatment groups57. Direct healthcare costs were obtained for 47 patients from the hospital financial system of the Netherlands Cancer Institute. Three patients from the UMCU were excluded because of restrictions in sharing prices. The γ distributions were used to reflect uncertainty in the cost parameters and β distributions for the survival and utilities. Discount rates from the Netherlands were applied and the national willingness-to-pay threshold of €80.000 per QALY to reflect the ceiling ratio for cost-effectiveness.
WES and RNA-seq
Tumor DNA and RNA were extracted from FFPE primary tumor and LNM sections containing at least 10% viable tumor cells present in the sample, except for on-treatment samples with a CPR in which we isolated samples with at least 10% immune infiltration and no viable tumor cells. A pathologist (L.S.) scored the tumor percentage and indicated the most tumor-dense region on a hematoxylin and eosin-stained slide for subsequent DNA or RNA isolation. According to the manufacturer’s protocol, 5–10 FFPE slides (10 µm) were used for DNA and RNA isolation using the AllPrep DNA or RNA FFPE isolation kit (QIAGEN, cat. no. 80234) and the QIAcube. Germline DNA was isolated from baseline peripheral blood mononuclear cells using the AllPrep DNA, RNA or microRNA Universal isolation kit (QIAGEN, cat. no. 80224) and the QIAcube, according to the manufacturer’s protocol. Genetic Diagnostics and Sequencing Services (CeGaT) performed both WES and RNA-seq in Germany.
Preprocessing WES data
WES was performed on 41 available baseline tumor samples out of the 50 patients from our cohort. A total of nine patients were not included, due to insufficient FFPE material (n = 3), low tumor purity of isolated DNA (n = 3) or missing biopsies (n = 3) (Extended Data Fig. 4a). Demultiplexing of the sequencing reads was performed with Illumina bcl2fastq (v.2.20). Adapters of the reads were trimmed with Skewer (v.0.2.2)58, without quality trimming. Sequencing reads were aligned with BWA (v.0.7.17)59 to the human reference genome GRCh38 (Ensemble, v.105). Duplicated reads were marked using Picard (v.2.25.0) MarkDuplicates, after which quality scores were recalibrated using GATK4 (v.4.2.2.0)60 BaseRecalibrator. FastQC (v.0.12.1)61, MultiQC (v.1.14)62, Mosdepth (v.0.3.3)63 and NGScheckmate (v.1.0.1)64 were used for assessing data quality, on FASTQ files and intermediate processing steps.
Preprocessing bulk RNA-seq data
Bulk RNA-seq was performed on tumor biopsies of 48 patients at baseline and 47 patients across timepoints (baseline n = 48, week 1 n = 38, week 2 n = 34 and week 4 n = 37), including LNMs that were sequenced in addition to the primary tumor or in case no primary tumor was present (Extended Data Fig. 4a). Two patients were excluded due to no available baseline tumor sample. In the 48 included patients, a total of 34 samples (across all timepoints) were not included due to insufficient FFPE material (15 samples), low quality of isolated RNA (1 sample), failed library preparation at CeGaT (6 samples) or missing biopsies (12 samples). Demultiplexing of the sequencing reads was performed with Illumina bcl2fastq (v.2.20). Adapters of the reads (Pico v.2 SMART adapter, first 3 nt of the second sequencing read) were trimmed with Skewer (v.0.2.2)58, without quality trimming. RNA-seq data were aligned to GRCh38 (Ensembl v.109) using STAR (v.2.7.9)65 in two-pass mode with default settings. Gene counts were generated with HTSeq (v.2.0.2)66. FastQC (v.0.12.1)61 and MultiQC (v.1.14)62 were used for assessing data quality, on FASTQ files and intermediate processing steps.
Somatic mutations
SNVs and short insertions and deletions were called using GATK4 (v.4.2.2.0)60 Mutect2 on the matched tumor and germline samples. Variants were filtered with the PASS filter and annotated using Ensembl Variant Effect Predictor (VEP, v.105). Maf files were generated using vcf2maf (v.1.6.21). The TMB was calculated by summarizing the total number of nonsynonymous somatic mutations with a minimal variant allele frequency of 5%. FACETS (v.0.6.2)67 was used for computationally calculating the purity. Samples that both produced not available values in FACETS for the purity and had a TMB < 10, indications of low tumor content, were excluded from the downstream analysis (n = 4; MAT nos. 22, 10, 32 and 37). TMB calculated from the OpACIN-neo68 and IMCISION35 cohorts was obtained using the same pipelines described earlier.
Statistical analyses
The sample size calculation of 20 patients in each arm was powered on a 94% probability in both arms that 8 or more of 20 included patients who achieved a PCR and on a 89% probability that 4 or more of 20 included patients who achieved an NPR based on data derived from ref. 30. This study was not designed or powered to compare efficacy in both treatment arms. Comparison between treatment responses was performed using two-sided Fisher’s exact test or a two-sided linear-to-linear test for categorical variables and a two-sided Mann–Whitney U-test was used for independent continuous variables. Continuous variables across ICB response categories were compared using a two-sided Wilcoxon’s rank-sum test or logistic regression analysis. Paired comparisons of continuous variables within the same patient were performed using a two-sided Wilcoxon’s signed-rank test. Independent (unpaired) comparisons of continuous variables between patient groups were conducted using the two-sided Mann–Whitney U-test. Kaplan–Meier curves and two-sided log(rank tests) were used for survival data analyses, performed in RStudio (R, v.4.3.2) and, for plotting the ‘ggplot2’ (v.3.4.2), the R package was used. The data cutoff was set on 30 September 2024.
The WES analyses were performed in RStudio (R, v.4.0.5), with the tidyverse (v.1.3.0) and broom (v.1.0.5) R packages for data handling. The Maftools R package (v.2.6.05)69 was used for the analysis of somatic mutations. For plotting, the ggplot2 (v.3.4.2) R package was used.
For bulk RNA-seq analyses, count data were normalized using the DESeq2 R package (v.1.30.1)70 with variance stabilizing transformation. The average expression was calculated for the Danaher signatures71. The signature scores were calculated with the GSVA R package (with Gaussian kernel, v.1.38.2)72. The complete list of analyzed gene signatures (n = 105) with references can be found in Supplementary Table 7. For the signature analysis, no multiple testing correction was performed. The analyses were performed in RStudio (R, v.4.0.5), with the tidyverse (v.1.3.0) and broom (v.1.0.5) R packages for data handling. For plotting, the ggplot2 (v.3.4.2) R package was used.
Reporting summary
Further information on research design is available in the Nature Portfolio Reporting Summary linked to this article.


Comments (0)