
Remember me


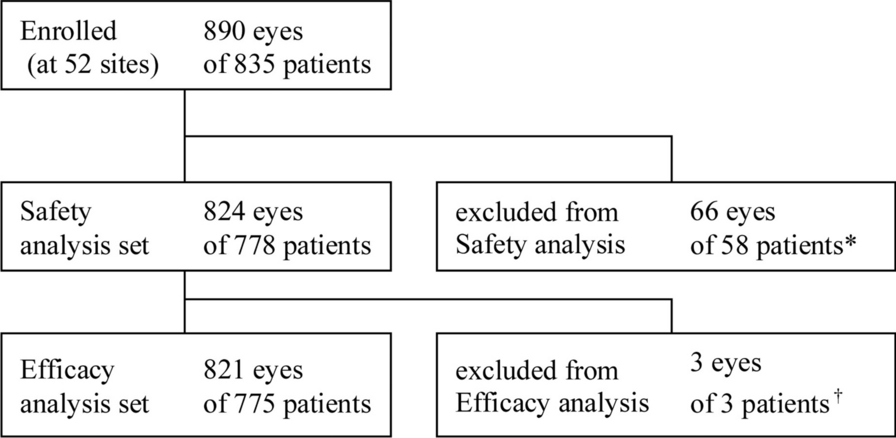

In the combined OPUS and OrPHeUS database there were 4626 patients with a diagnosis of PAH and follow-up data, and of these, the majority had both a race (99.2%) and ethnicity (99.6%) reported (Fig. 1). For race, 16.4% (n = 752/4589) of patients were Black/African American and 75.9% (n = 3484/4589) were White. For ethnicity, 11.2% (n = 517/4609) of patients were Hispanic/Latino and 84.8% (n = 3907/4609) were not Hispanic/Latino.
Fig. 1
Patient disposition. A total of 155 sites contributed to the combined OPUS and OrPHeUS database. aOther includes n = 53 American Indian or Alaska Native, n = 26 Native Hawaiian or Other Pacific Islander, n = 274 “Other”. bHispanic/Latino patients categorized by race: n = 10 (1.9%) Black/African American, n = 378 (73.1%) White, n = 119 (23.0%) “Other”, n = 10 (1.9%) missing race. Not Hispanic/Latino patients by race: n = 703 (18.0%) Black/African American, n = 2991 (76.6%) White, n = 204 (5.2%) “Other”, n = 9 (0.2%) missing race. PAH pulmonary arterial hypertension
Baseline CharacteristicsBaseline characteristics for patients by race and by ethnicity are reported in Table 1. At macitentan initiation, Black/African American compared to White patients were slightly younger at diagnosis (median [interquartile range; Q1, Q3] 57 [47, 66] vs 61 [48, 71] years), were more likely to be female (81.5% vs 74.1%) and more likely to have PAH associated with connective tissue disease (33.0% vs 25.1%), respectively. Black/African American patients were more likely than White patients to have a medical history of hypertension (42.6% vs 34.2%), diabetes mellitus (29.0% vs 21.8%), anemia (14.9% vs 9.4%), or renal insufficiency (12.4% vs 6.6%). Hispanic/Latino patients compared to patients who were not Hispanic/Latino were younger at diagnosis (median [Q1, Q3] 53 [39, 63] vs 60 [48, 70] years), were more likely to have PAH associated with congenital heart disease (12.8% vs 5.3%) and less likely to have idiopathic/heritable PAH (49.5% vs 57.0%). Hispanic/Latino patients were more likely to have a medical history of obesity (34.2% vs 29.2%) and hepatic abnormality (17.4% vs 11.4%) and were less likely to have a history of edema (6.4% vs 13.8%) and renal insufficiency (2.9% vs 8.0%).
Table 1 Demographics and baseline characteristics at macitentan initiationMeasures of PAH severity are presented in Table 2 for patients with available data (range 32.1–57.8%). Black/African American patients had greater disease severity than White patients, according to assessments of 6MWD (median [Q1, Q3] 256 [165, 335] m vs 300 [198, 382] m) and the proportions of patients in World Health Organization functional class (WHO FC) III/IV (71.4% vs 61.8%) and the high-risk category for brain natriuretic peptide/N-terminal pro-brain natriuretic peptide (BNP/NT-proBNP; 39.2% vs 33.9%), respectively. However, hemodynamics were similar between the groups (Table 2). Hispanic/Latino patients had a higher 6MWD than patients who were not Hispanic/Latino (median [Q1, Q3] 317 [232, 381] m vs 290 [192, 378] m) and there were more Hispanic/Latino patients in the BNP/NT-proBNP low risk category (32.5% vs 26.4%, respectively). The proportions of patients in WHO FC III/IV (59.4% vs 63.8%) were similar between the groups, as were their hemodynamics.
Table 2 Measures of PAH severity at macitentan initiationTreatment PatternsOverall treatment patterns were comparable between Black/African American and White patients: the median (Q1, Q3) macitentan exposure was 13.9 (5.4, 26.8) months and 14.6 (5.2, 29.6) months, respectively, and median (Q1, Q3) time from diagnosis to macitentan initiation was 8.4 (1.5, 36.3) versus 7.4 (1.3, 40.3) months (Table 1). At least one PAH-specific therapy prior to starting macitentan was recorded in 65.4% of Black/African American and 64.9% of White patients, with approximately half taking a phosphodiesterase-5 inhibitor (PDE5i; 51.9% and 52.2%, respectively) (Table 3). Specific combinations of therapy, including the number of patients initiating macitentan as monotherapy, or as part of combination therapy are described in Table S1. The median (95% CL) time from diagnosis to first, double combination, and triple combination PAH therapy was 2.3 (1.8, 3.0), 19.6 (14.8, 26.1), and 139.2 (111.4, 159.4) months for Black/African American patients and 2.0 (1.8, 2.2), 18.7 (17.0, 21.0), and 146.7 (128.3, 161.0) months for White patients, respectively. KM estimates are shown in Fig. 2. Breakdowns of first, second, and third therapies are described in Table S2.
Table 3 PAH-specific therapies prior to and at macitentan initiationFig. 2
Kaplan–Meier estimates of treatment escalation by race. Patients with an incomplete date of diagnosis, or a diagnosis date after the date of initiation of first PAH therapy were excluded from these analyses. a KM estimates of percent of patients on PAH-specific treatment with median (95% CL) time to therapy displayed. b Table of KM (95% CL) estimates at 12, 24, and 36 months. CL confidence limit, KM Kaplan–Meier, PAH pulmonary arterial hypertension
For Hispanic/Latino patients, the median (Q1, Q3) macitentan exposure was 13.1 (5.5, 26.8) months versus 14.6 (5.1, 29.5) months for patients who were not Hispanic/Latino; the median (Q1, Q3) time from diagnosis to macitentan initiation was 6.9 (1.1, 38.7) months and 7.9 (1.4, 40.3) months, respectively (Table 1). The proportion of patients with ≥ 1 previous PAH-specific therapy prior to starting macitentan was 59.4% and 66.0% for patients who were Hispanic/Latino versus patients who were not; fewer Hispanic/Latino patients were taking a prior PDE5i (46.0% vs 53.3%; Table 3). Specific combinations of therapy at macitentan initiation are described in Table S1. The median (95% CL) time from diagnosis to first, double combination, and triple combination PAH therapy was longer in Hispanic/Latino patients (2.8 [2.3, 3.7], 35.6 [29.9, 46.9], and 213.6 [127.5, 372.7] months, respectively) compared to patients who were not Hispanic/Latino (1.9 [1.7, 2.2], 17.9 [16.3, 19.9], and 140.4 [127.5, 152.3] months, respectively). KM estimates are shown in Fig. 3; breakdowns of first, second, and third therapies are described in Table S2.
Fig. 3
Kaplan–Meier estimates of treatment escalation by ethnicity. Patients with an incomplete date of diagnosis, or a diagnosis date after the date of initiation of first PAH therapy were excluded from these analyses. a KM estimates of percent of patients on PAH-specific treatment with median (95% CL) time to therapy displayed. b Table of KM (95% CL) estimates at 12, 24, and 36 months. CL confidence limit, KM Kaplan–Meier, PAH pulmonary arterial hypertension
OutcomesSurvival was similar between Black/African American and White patients, with 120 (16.0%) and 536 (15.4%) deaths during the observation period, respectively. KM estimates (95% CL) of survival for Black/African American patients and White patients were 89.6% (86.8, 91.8) and 90.3% (89.1, 91.4) at 12 months, 80.2% (76.2, 83.6) and 81.6% (79.9, 83.2) at 24 months, and 73.0% (67.9, 77.5) and 74.9% (72.7, 77.0) at 36 months (Fig. 4a). Slightly more Black/African American patients compared to White patients experienced an all-cause hospitalization (51.2% vs 45.1%). The KM estimates (95% CL) for freedom from all-cause hospitalization for Black/African American and White patients were 52.5% (48.4, 56.4) and 61.2% (59.4, 63.0) at 12 months and 38.9% (34.5, 43.2) and 45.2% (43.1, 47.3) at 24 months, (Fig. 5a). For patients with data available from baseline to follow-up (range 23.8–43.9%), improvements in functional parameters were seen in both Black/African American and White patients: WHO FC remained unchanged or improved in 90.6% of patients in both groups, there were improvements in 6MWD of median (Q1, Q3) 17.0 (−15.0, 78.0) m and 9.0 (−30.0, 57.0) m, and unchanged or improved BNP/NT-proBNP risk category in 83.8% and 86.0% of patients, respectively (Table S3).
Fig. 4
Kaplan–Meier estimates of survival from macitentan initiation by race a and ethnicity b. *Incidence rates are estimates using a Poisson model with log (exposure time) as an offset. CL confidence limit
Fig. 5
Kaplan–Meier estimates of first all-cause hospitalization from macitentan initiation by race a and ethnicity b. Kaplan–Meier curves were truncated at the time point when < 10% of patients in either group were at risk, in accordance with Pocock’s stopping rule [21]. Patients with an ongoing hospitalization at baseline were excluded from the analyses *Incidence rates are estimates using Poisson model with log (exposure time) as an offset. CL confidence limit
Survival was higher for Hispanic/Latino patients compared to patients who were not Hispanic/Latino, with 50 (9.7%) and 622 (15.9%) deaths during the observation period, respectively. KM estimates (95% CL) of survival for Hispanic/Latino patients and those who were not were 93.8% (91.0, 95.8) and 89.9% (88.8, 90.9) at 12 months, 86.9 (82.5, 90.3) and 81.2% (79.6, 82.8) at 24 months and 80.5% (73.8, 85.7) and 74.3% (72.2, 76.3) at 36 months (Fig. 4b). Similar numbers of Hispanic/Latino patients and those who were not Hispanic/Latino, experienced at least one all-cause hospitalization (42.4% vs 46.6%, respectively). The KM estimates (95% CL) for freedom from all-cause hospitalization for Hispanic/Latino patients and those who were not were 62.5% (57.6, 67.0) and 59.2% (57.4, 60.9) at 12 months and 48.1% (42.5, 53.5) and 43.8% (41.9, 45.8) at 24 months (Fig. 5b). From baseline to follow-up, improvements in functional parameters were seen in both Hispanic/Latino and not Hispanic/Latino patients (with data reported ranging from 23.4% to 42.6%). WHO FC remained unchanged or improved in 91.5% and 90.5% of patients, there were improvements in 6MWD of median (Q1, Q3) 9.0 (− 16.8, 55.0) m and 10.0 (− 28.2, 60.0) m, and unchanged or improved BNP/NT-proBNP risk category in 83.5% and 85.8% of patients, respectively (Table S3).
Safety and TolerabilitySafety and tolerability data are shown in Table 4. A comparable proportion of Black/African American and White patients remained on macitentan; 12-month KM estimates (95% CL) for persistence were 70.1% (66.5, 73.3) and 69.6% (68.0, 71.1), respectively. Of those patients who discontinued within 1 year and had a reason for discontinuation reported, 13.4% (101/752) of Black/African American and 14.4% (501/3484) of White patients did so as a result of an AE. Overall, 16.8% of Black/African American patients and 18.1% of White patients discontinued macitentan because of an AE. In OPUS, an AE was experienced by 81.7% of Black/African American patients and 80.3% of White patients. The most common (occurring in > 10% of patients in any group) AEs were similar between Black/African American and White patients and included dyspnea (27.9% vs 22.8%), headache (12.4% vs 12.3%), peripheral edema (11.8% vs 10.2%), nausea (11.0% vs 10.1%), dizziness (10.4% and 8.1%), and cough (10.1% and 7.2%). Serious AEs (SAEs) occurred in 57.2% of Black/African American and 51.0% of White patients; the only SAE with > 5% difference between the groups was dyspnea (20.3% vs 13.2%, respectively). Comparable proportions of Black/African American and White patients experienced an AESI (grouped terms) of edema (29.6% vs 28.5%), anemia/hemoglobin decrease (9.9% vs 10.7%), or hepatic event (5.1% vs 6.3%), respectively. Overall, the safety profiles were similar between the two race groups and consistent with the known profile of macitentan.
Table 4 Adverse events (OPUS only) and discontinuationsA comparable proportion of patients who were Hispanic/Latino and those who were not Hispanic/Latino remained on macitentan at 12 months; KM estimates (95% CL) for persistence were 68.6% (64.2, 72.6) and 69.5% (68.0, 70.9), respectively. Of those patients who discontinued within 1 year and had a reason for discontinuation reported, 12.4% (64/517) of Hispanic/Latino patients and 14.6% (572/3907) of patients who were not Hispanic/Latino did so as a result of an AE. Overall, similar proportions of Hispanic/Latino patients and those who were not Hispanic/Latino discontinued macitentan because of an AE (14.9% and 18.5% of patients, respectively). Slightly fewer patients who were Hispanic/Latino experienced an AE compared to those who were not Hispanic/Latino (74.5% vs 81.5%, respectively). The most common (occurring in > 10% of patients in any group) AEs in Hispanic/Latino patients and those who were not were dyspnea (15.3% vs 24.3%), headache (14.6% vs 11.9%), peripheral edema (8.8% vs 11.0%), and nausea (8.4% vs 10.6%). SAEs occurred in 43.4% of Hispanic/Latino patients and 53.1% of patients who were not Hispanic/Latino; the only SAE with > 5% difference between the groups was dyspnea (9.5% vs 14.7%, respectively). Similar proportions of Hispanic/Latino patients and those who were not experienced an AESI (grouped terms) of edema (25.9% vs 28.9%) or hepatic event (7.2% vs 6.0%). Hispanic/Latino patients experienced fewer events of anemia/hemoglobin decrease than those who were not (4.0% vs 11.2%). Overall, safety profiles were similar between the ethnicity groups and consistent with the known profile of macitentan.
Comments (0)