
Remember me


A total of 2666 adults with an initial diagnosis of ES-SCLC initiated 1L PBC during the patient identification period (Fig. 1). After exclusion of 93 patients due to receipt of clinical trial drugs during the study period (n = 90) or oxaliplatin in 1L–4L treatment (n = 3), the final 1L cohort comprised 2573 patients. Of the patients in the 1L cohort, 992 (38.6%), 344 (13.4%), and 114 (4.4%), respectively, were included in the 2L, 3L, and 4L cohorts. Therefore, 38.6% of patients in the 1L cohort, 34.7% in the 2L cohort, and 33.1% in the 3L cohort went on to receive at least one subsequent line of therapy during the patient identification period, demonstrating substantial attrition across lines of therapy among this patient population.
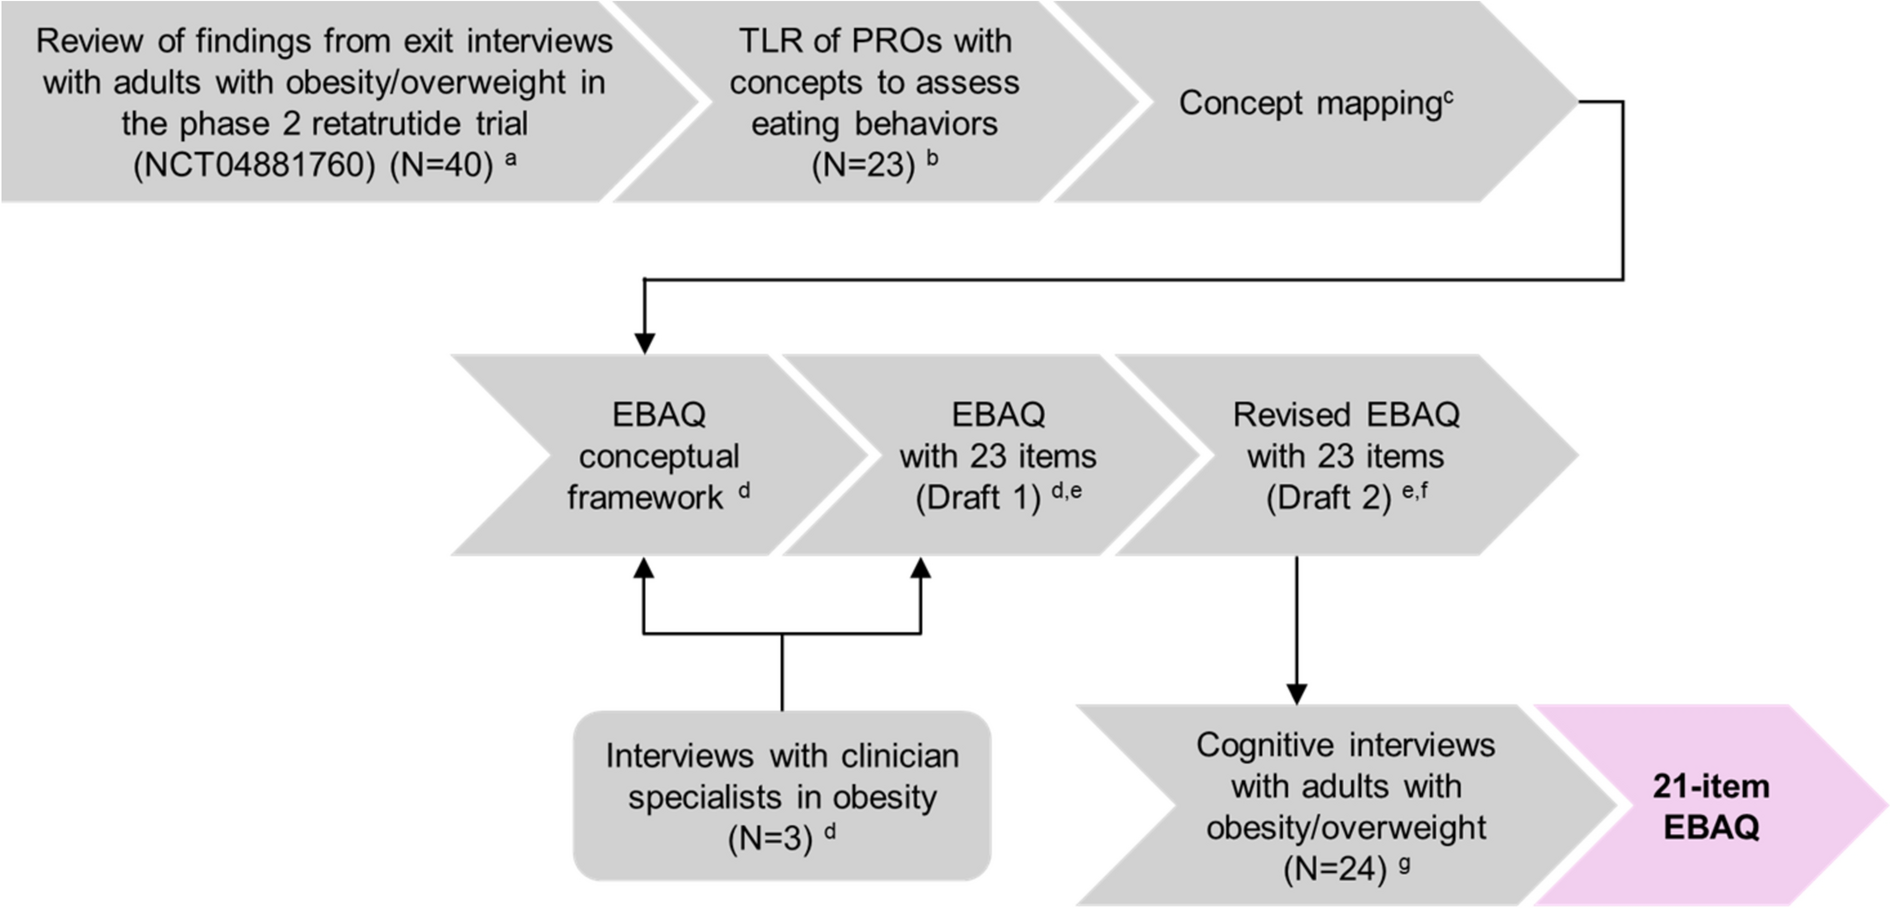
Fig. 1
Patient flow diagram. aThe patient identification period was January 1, 2018–June 30, 2023. bThe study period was January 1, 2018–December 31, 2023. 1L first line, 2L second line, 3L third line, 4L fourth line, CTFI chemotherapy-free interval, ECOG PS Eastern Cooperative Oncology Group performance status, ES-SCLC extensive-stage small cell lung cancer, PBC platinum-based chemotherapy, PD-(L)1, programmed death (ligand) 1
In the 1L cohort, median age at the index date was 68.0 years (range 30.0–85.0) (Table 1). The proportion of female (n = 1300; 50.5%) and male (n = 1273; 49.5%) patients was approximately equal, a majority were white (n = 1826; 71.0%), and almost all had a history of smoking (n = 2526; 98.2%). ECOG PS was 0 or 1 in 1451 patients (56.4%), while brain metastases were recorded on or before the 1L index date for 306 patients (11.9%).
Table 1 Baseline demographics and clinical characteristicsDemographic and clinical characteristics were generally similar across the 1L, 2L, 3L, and 4L cohorts. However, the proportion of patients with brain metastases increased with each successive treatment line, at 11.9%, 23.2%, 29.9%, and 35.1%, respectively. In addition, the percentage of patients with ECOG PS 0–1 was higher in the 2L, 3L, and 4L cohorts than in the 1L cohort. Furthermore, patients with CTFI ≥ 180 days accounted for a greater proportion of patients in the 4L cohort compared with the 2L and 3L cohorts.
Treatment PatternsIn the 1L cohort, PBC was administered with a topoisomerase inhibitor in combination with an anti-PD-(L)1 agent in approximately two-thirds of patients (n = 1711; 66.5%), and without an anti-PD-(L)1 agent in approximately one-third of patients (n = 837; 32.5%) (Fig. 2; Table 2). Thereafter, there was no clear standard of care in the 2L, 3L, or 4L cohorts. In the 2L cohort, lurbinectedin-containing regimens (monotherapy or combinations) were the most common treatment (n = 263; 26.5%). A total of 176 patients (17.7%) in the 2L cohort received PBC in combination with both anti-PD-(L)1 therapy and a topoisomerase inhibitor, 96 patients (9.7%) received PBC in combination with a topoisomerase inhibitor alone, and 19 patients (1.9%) received “other” PBC regimens. Thus, across these three treatment categories, 291 patients (29.3%) received further PBC in 2L.
Fig. 2
Treatment patterns and sequencing across 1L–4L (A) and from 3L to 4L (B). 1L first line, 2L second line, 3L third line, 4L fourth line, PBC platinum-based chemotherapy, PD-(L)1 programmed death (ligand) 1
Table 2 Treatment patterns across lines of therapyIn the 3L cohort, the most common treatments were lurbinectedin-containing regimens and topoisomerase inhibitors (administered as monotherapy or in combination only with another topoisomerase inhibitor), each received by 75 patients (21.8%). Other regimens administered in the 3L cohort included other chemotherapy (n = 54; 15.7%), anti-PD-(L)1 monotherapy (n = 45; 13.1%), and PBC + topoisomerase inhibitor (n = 35; 10.2%). In the 4L cohort, the most common treatments were topoisomerase inhibitor(s) only (n = 34, 29.8%), other chemotherapy (n = 27, 23.7%), and lurbinectedin-containing regimens (n = 21, 18.4%). In both 2L and 3L, nivolumab + ipilimumab was the most common regimen in the category of anti-PD-(L)1 “other” (2L, n = 68 [6.9%]; 3L, n = 13 [3.8%]).
In subgroup analyses, 3L and 4L treatment patterns in patients with 1L anti-PD-(L)1 therapy (3L, n = 191; 4L, n = 59), ECOG PS 0–1 (3L, n = 225; 4L, n = 72), or PBC rechallenge (3L, n = 125; 4L, n = 50) generally reflected those seen in the overall cohorts (Table S2). The use of anti-PD-(L)1 monotherapy in 3L or 4L was less common in patients who had received 1L anti-PD-(L)1 therapy than in other subgroups. Compared with patients in other subgroups, patients who were rechallenged with PBC were more likely to receive 3L lurbinectedin-containing regimens or 4L topoisomerase inhibitor(s) only and less likely to receive other chemotherapy in 3L.
Clinical Outcomes in the 3L CohortMedian rwOS from the 3L index date was 4.53 months (95% CI, 3.71–5.39) (Fig. 3A). rwOS rates from the 3L index date decreased from 40.9% (95% CI, 35.6–46.1) at 6 months to 20.6% (95% CI, 16.2–25.3) at 1 year, 3.6% (95% CI, 1.5–7.0) at 2 years, and 1.8% (95% CI, 0.4–5.2) at 3 years. Median rwTTD/D from the 3L index date was 2.56 months (95% CI, 2.27–2.79) (Fig. 3B). rwTTD/D rates from the 3L index date were 14.6% (95% CI, 11.0–18.7) at 6 months, 5.0% (95% CI, 2.9–7.9) at 1 year, and were not estimable at 2 or 3 years. Median rwTTNT/D from the 3L index date was 2.92 months (95% CI, 2.69–3.12), with TTNT/D rates at 6 months and 1 year of 21.1% (95% CI, 16.9–25.7) and 6.5% (95% CI, 4.1–9.6), respectively, while 2- and 3-year rwTTNT/D rates were not estimable (Fig. 3C). Among 77 patients in the 3L cohort who were evaluable for response, confirmed rwRR was 11.7% (95% CI, 5.5–21.0).
Fig. 3
rwOS (A), rwTTD/D (B), and rwTTNT/D (C) in the 3L cohort (n = 344). 3L third line, 4L fourth line, CI confidence interval, rwOS real-world overall survival, rwTTD/D real-world time to treatment discontinuation or death, rwTTNT/D real-world time to next treatment or death
In subgroup analyses of the 3L cohort, patients with ECOG PS 0–1 at 3L index had a median rwOS of 5.85 months (95% CI, 4.90–6.37), median rwTTD/D of 2.79 months (95% CI, 2.40–3.09), and median rwTTNT/D of 3.22 months (95% CI, 2.89–3.84), indicating broadly comparable clinical outcomes relative to the overall 3L cohort, with a numeric trend for longer rwOS (Table 3). In contrast, patients with ECOG PS 2 had numerically worse clinical outcomes, especially regarding rwOS, although the subgroup size was limited (n = 68; Table S3). Clinical outcomes in patients with 1L anti-PD-(L)1 therapy or PBC rechallenge were mostly similar to those observed in the overall 3L cohort (Table 3). In patients with PBC rechallenge, there was a trend for numerically longer median rwOS (6.80 months; 95% CI, 4.53–8.02) relative to the overall 3L cohort, whereas median rwTTD/D (2.79 months; 95% CI, 2.33–3.35) and median rwTTNT/D (3.52 months; 95% CI, 2.83–3.98) were similar. In patients with 1L anti-PD-(L)1 therapy, median rwOS was 4.90 (95% CI, 3.22–5.85), median rwTTD/D was 2.63 (95% CI, 2.30–3.02), and median rwTTNT/D was 3.02 months (95% CI, 2.69–3.71).
Table 3 Real-world clinical outcomes in 3L cohort subgroupsIn subgroup analyses that dichotomized the 3L cohort into those with CTFI < 90 days (n = 149) and ≥ 90 days (n = 195), median rwOS was 3.84 months (95% CI, 2.99–4.83) and 5.59 months (95% CI, 3.81–6.64), median rwTTD/D was 2.56 months (95% CI 2.20–2.89) and 2.56 months (95% CI, 2.14–2.99), and median TTNT/D was 2.89 months (95% CI, 2.43–3.12) and 3.02 months (95% CI, 2.69–3.65), respectively (Table S3). The trend for prolonged rwOS in patients with longer CTFI was even more pronounced among patients with CTFI ≥ 180 days (n = 80); however, other efficacy outcomes in this group and among those with CTFI < 180 days (n = 264) were similar to those observed when using a 90-day cutoff.
Comments (0)