
Remember me


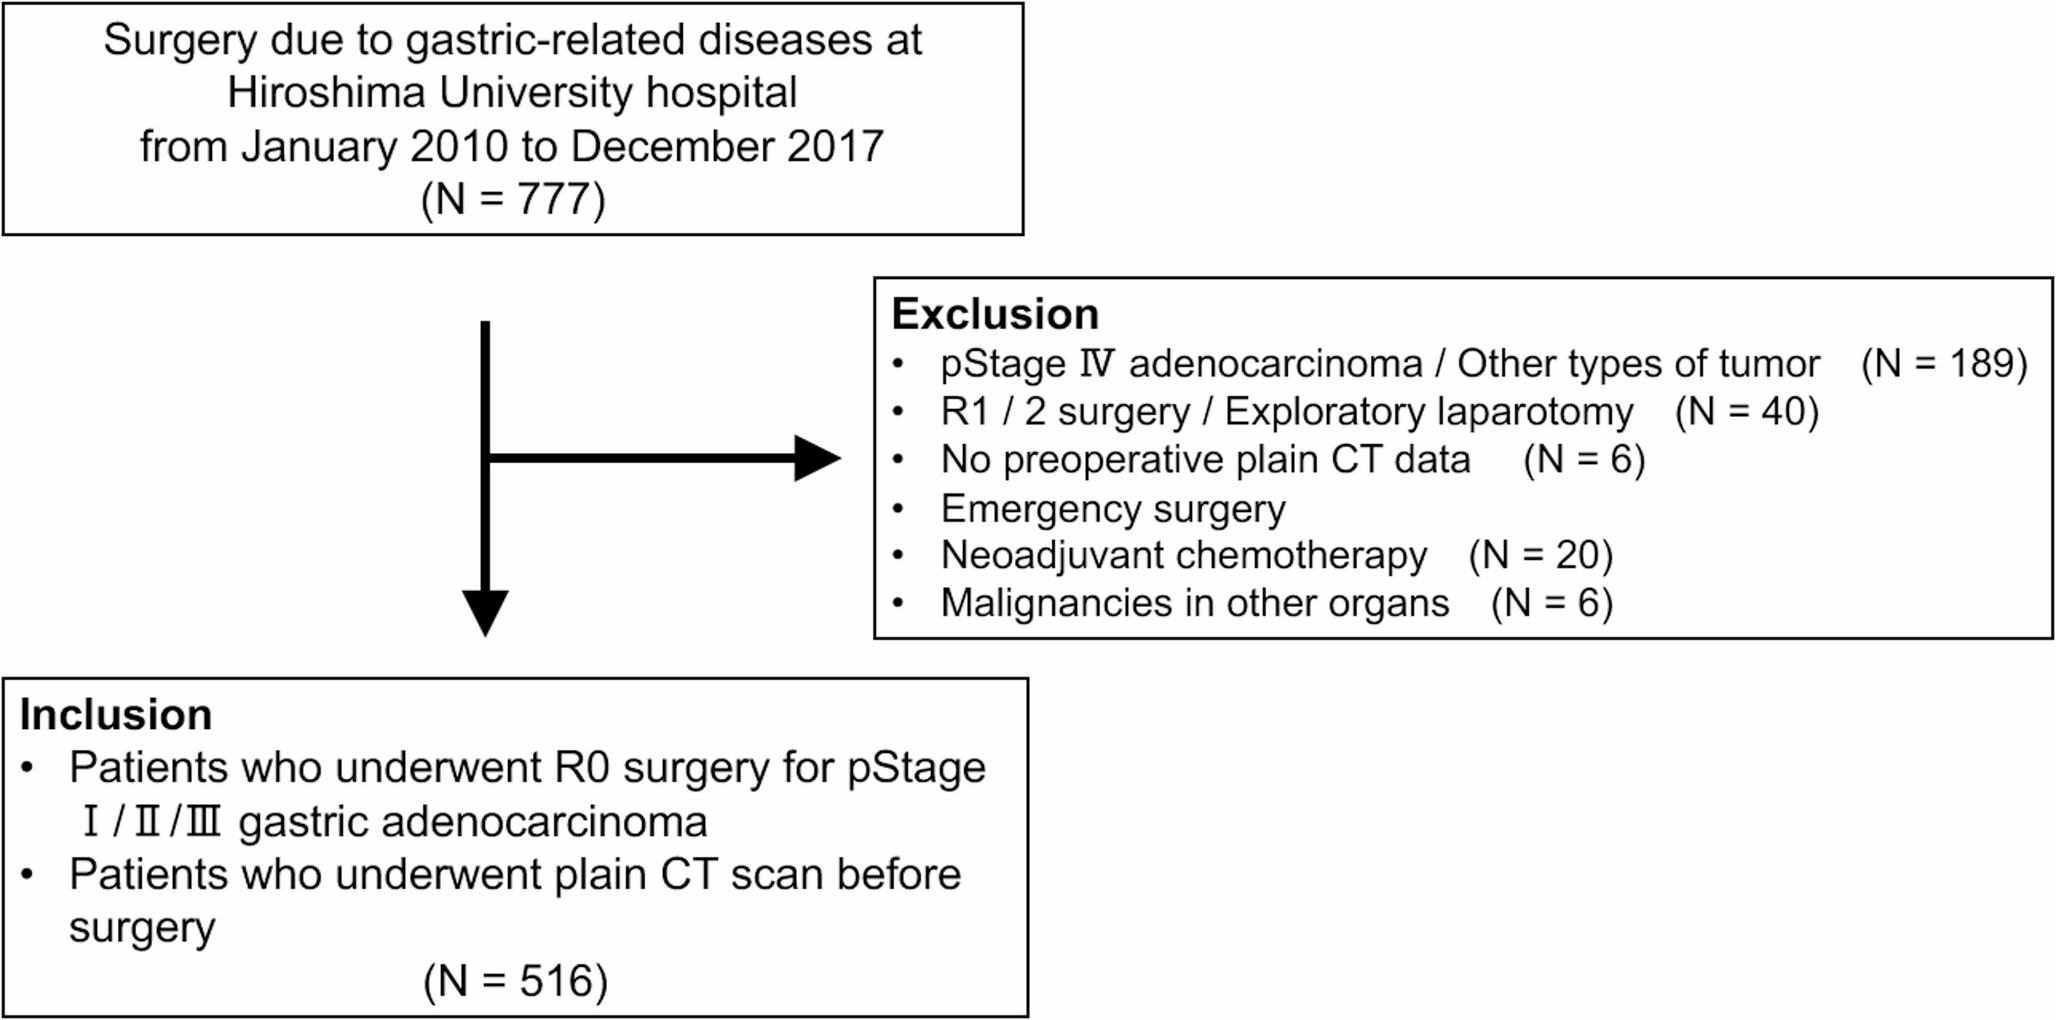

After applying the exclusion criteria, a total of 516 patients were included in this study. Using the ROC curve for 5-year survival rate as the outcome, the Agatston score cutoff value of 100 yielded an AUC of 0.6656 (95% CI: 0.5984–0.7267), with a sensitivity of 65.0% and specificity of 62.8%. Based on this, the patients were divided into two groups: a high AAC group with scores > 100 and a low AAC group with Agatston scores < 100. The high AAC group comprised 214 patients (41.5%), and the low AAC group included 302 patients (58.5%).
Compared with patients in the low AAC group, patients in the high AAC group were older and more likely to be men; frequently presented with DM, HT, or HL; had lower ASA-PS scores and PNI values but higher CAR; underwent open surgery more often; exhibited greater intraoperative blood loss; had more postoperative pneumonia; and more commonly exhibited the intestinal type according to the histological classification of the tumor. The clinical characteristics of both groups are summarized in Table 1.
Table 1 Patient characteristics in the low and high AAC groupsKaplan–Meier Survival Curve Analysis after Propensity Score Matching between the High and Low AAC GroupsKaplan–Meier survival curve analysis was performed in a propensity score-matched cohort to evaluate the prognostic impact of AAC. Propensity score matching was applied to minimize potential confounding factors and achieve comparability between the high and low AAC groups in terms of baseline clinical and pathological characteristics that may influence long-term oncological outcomes. As a result, 143 patients were matched in each group, yielding a well-balanced cohort for subsequent survival analysis (Table 2).
Table 2 Patient characteristics after propensity score matchingIn the matched population, Kaplan–Meier analysis demonstrated that patients in the high AAC group had significantly poorer OS (P = 0.020), DSS (P = 0.013), and RFS (P = 0.017) compared to those in the low AAC group (Fig. 2a–c). These findings suggest that the degree of AAC, as quantified by the Agatston score, may serve as an independent risk factor associated with adverse postoperative outcomes in patients undergoing curative resection for gastric cancer.
Fig. 2
Kaplan-Meier survival curves. (a) Overall survival (OS), (b) disease-free survival (DSS), (c) recurrence-free survival (RFS) between the two groups after matching
Factors Related To OS, DSS, and RFSThe prognostic factors were analyzed using univariate analysis to evaluate patient background as well as oncological and surgical variables in relation to survival outcomes.
Univariate analysis identified high AAC, older age, male sex, high ASA-PS, low PNI, high CAR, pStage 3, proximal tumor, total gastrectomy, D2 dissection, and postoperative complications as predictors of the 5-year OS (Supplemental Table 1). Multivariate analysis confirmed older age (hazard ratio [HR], 2.01; 95% confidence interval [CI], 1.21–3.36; P = 0.007), pStage3 (HR, 2.62; 95% CI, 1.58–4.36; P < 0.001), total gastrectomy (HR, 2.65; 95% CI, 1.59–4.41; P < 0.001), and high AAC (HR, 2.57, 95% CI, 1.56–4.22, P < 0.001) as independent predictors of 5-year OS (Table 3).
Table 3 Risk factors for 5-year OSUnivariate analysis identified the following predictors of poor DSS: high AAC, high ASA-PS, low PNI, high CAR, pStage 3, proximal tumor, total gastrectomy, D2 dissection, postoperative complications, and adjuvant chemotherapy (Supplemental Table 2). Multivariate analysis further identified the following factors as independent predictors of poor DSS: pStage 3 (HR, 6.26; 95% CI, 2.94–13.36; P < 0.001), total gastrectomy (HR, 5.38; 95% CI 2.20–13.14; P < 0.001), and high AAC (HR, 4.32; 95% CI, 1.84–10.12; P < 0.001) (Table 4).
Table 4 Risk factors for 5-year DSSUnivariate analysis identified high AAC, older age, male sex, high ASA-PS, low PNI, high CAR, pStage 3, proximal tumor, total gastrectomy, D2 dissection, postoperative complications, and adjuvant chemotherapy as predictors of poor RFS (Supplemental Table 3). Multivariate analysis revealed that older age (HR, 1.71; 95% CI, 1.02–2.84; P = 0.041), pStage 3 (HR, 2.84; 95% CI, 1.70–4.76; P < 0.001), total gastrectomy (HR, 2.76; 95% CI, 1.67–4.55; P < 0.001), and high AAC (HR, 2.63; 95% CI, 1.60–4.33; P < 0.001) were independent predictors of poor RFS (Table 5).
Table 5 Risk factors for 5-year RFSImpact of AAC on the Site of Recurrence after Curative Resection of Gastric CancerThe association between AAC and the initial site of gastric cancer recurrence was evaluated. Among the 34 patients who experienced recurrence out of a total of 516 cases, peritoneal dissemination was the most frequent pattern (n = 13), followed by lymph node recurrence, liver metastasis, lung metastasis, and other sites (Table 6). No statistically significant difference was observed in the distribution of the initial recurrence sites between the low and high AAC groups (data not shown). Furthermore, stratified analysis based on the Agatston score revealed that patients with peritoneal dissemination had significantly higher Agatston scores than those without recurrence (P = 0.032, Fig. 3).
Table 6 Analysis of first recurrence siteFig. 3
Distribution of Agatston scores according to initial site of recurrence
Comments (0)