
Remember me
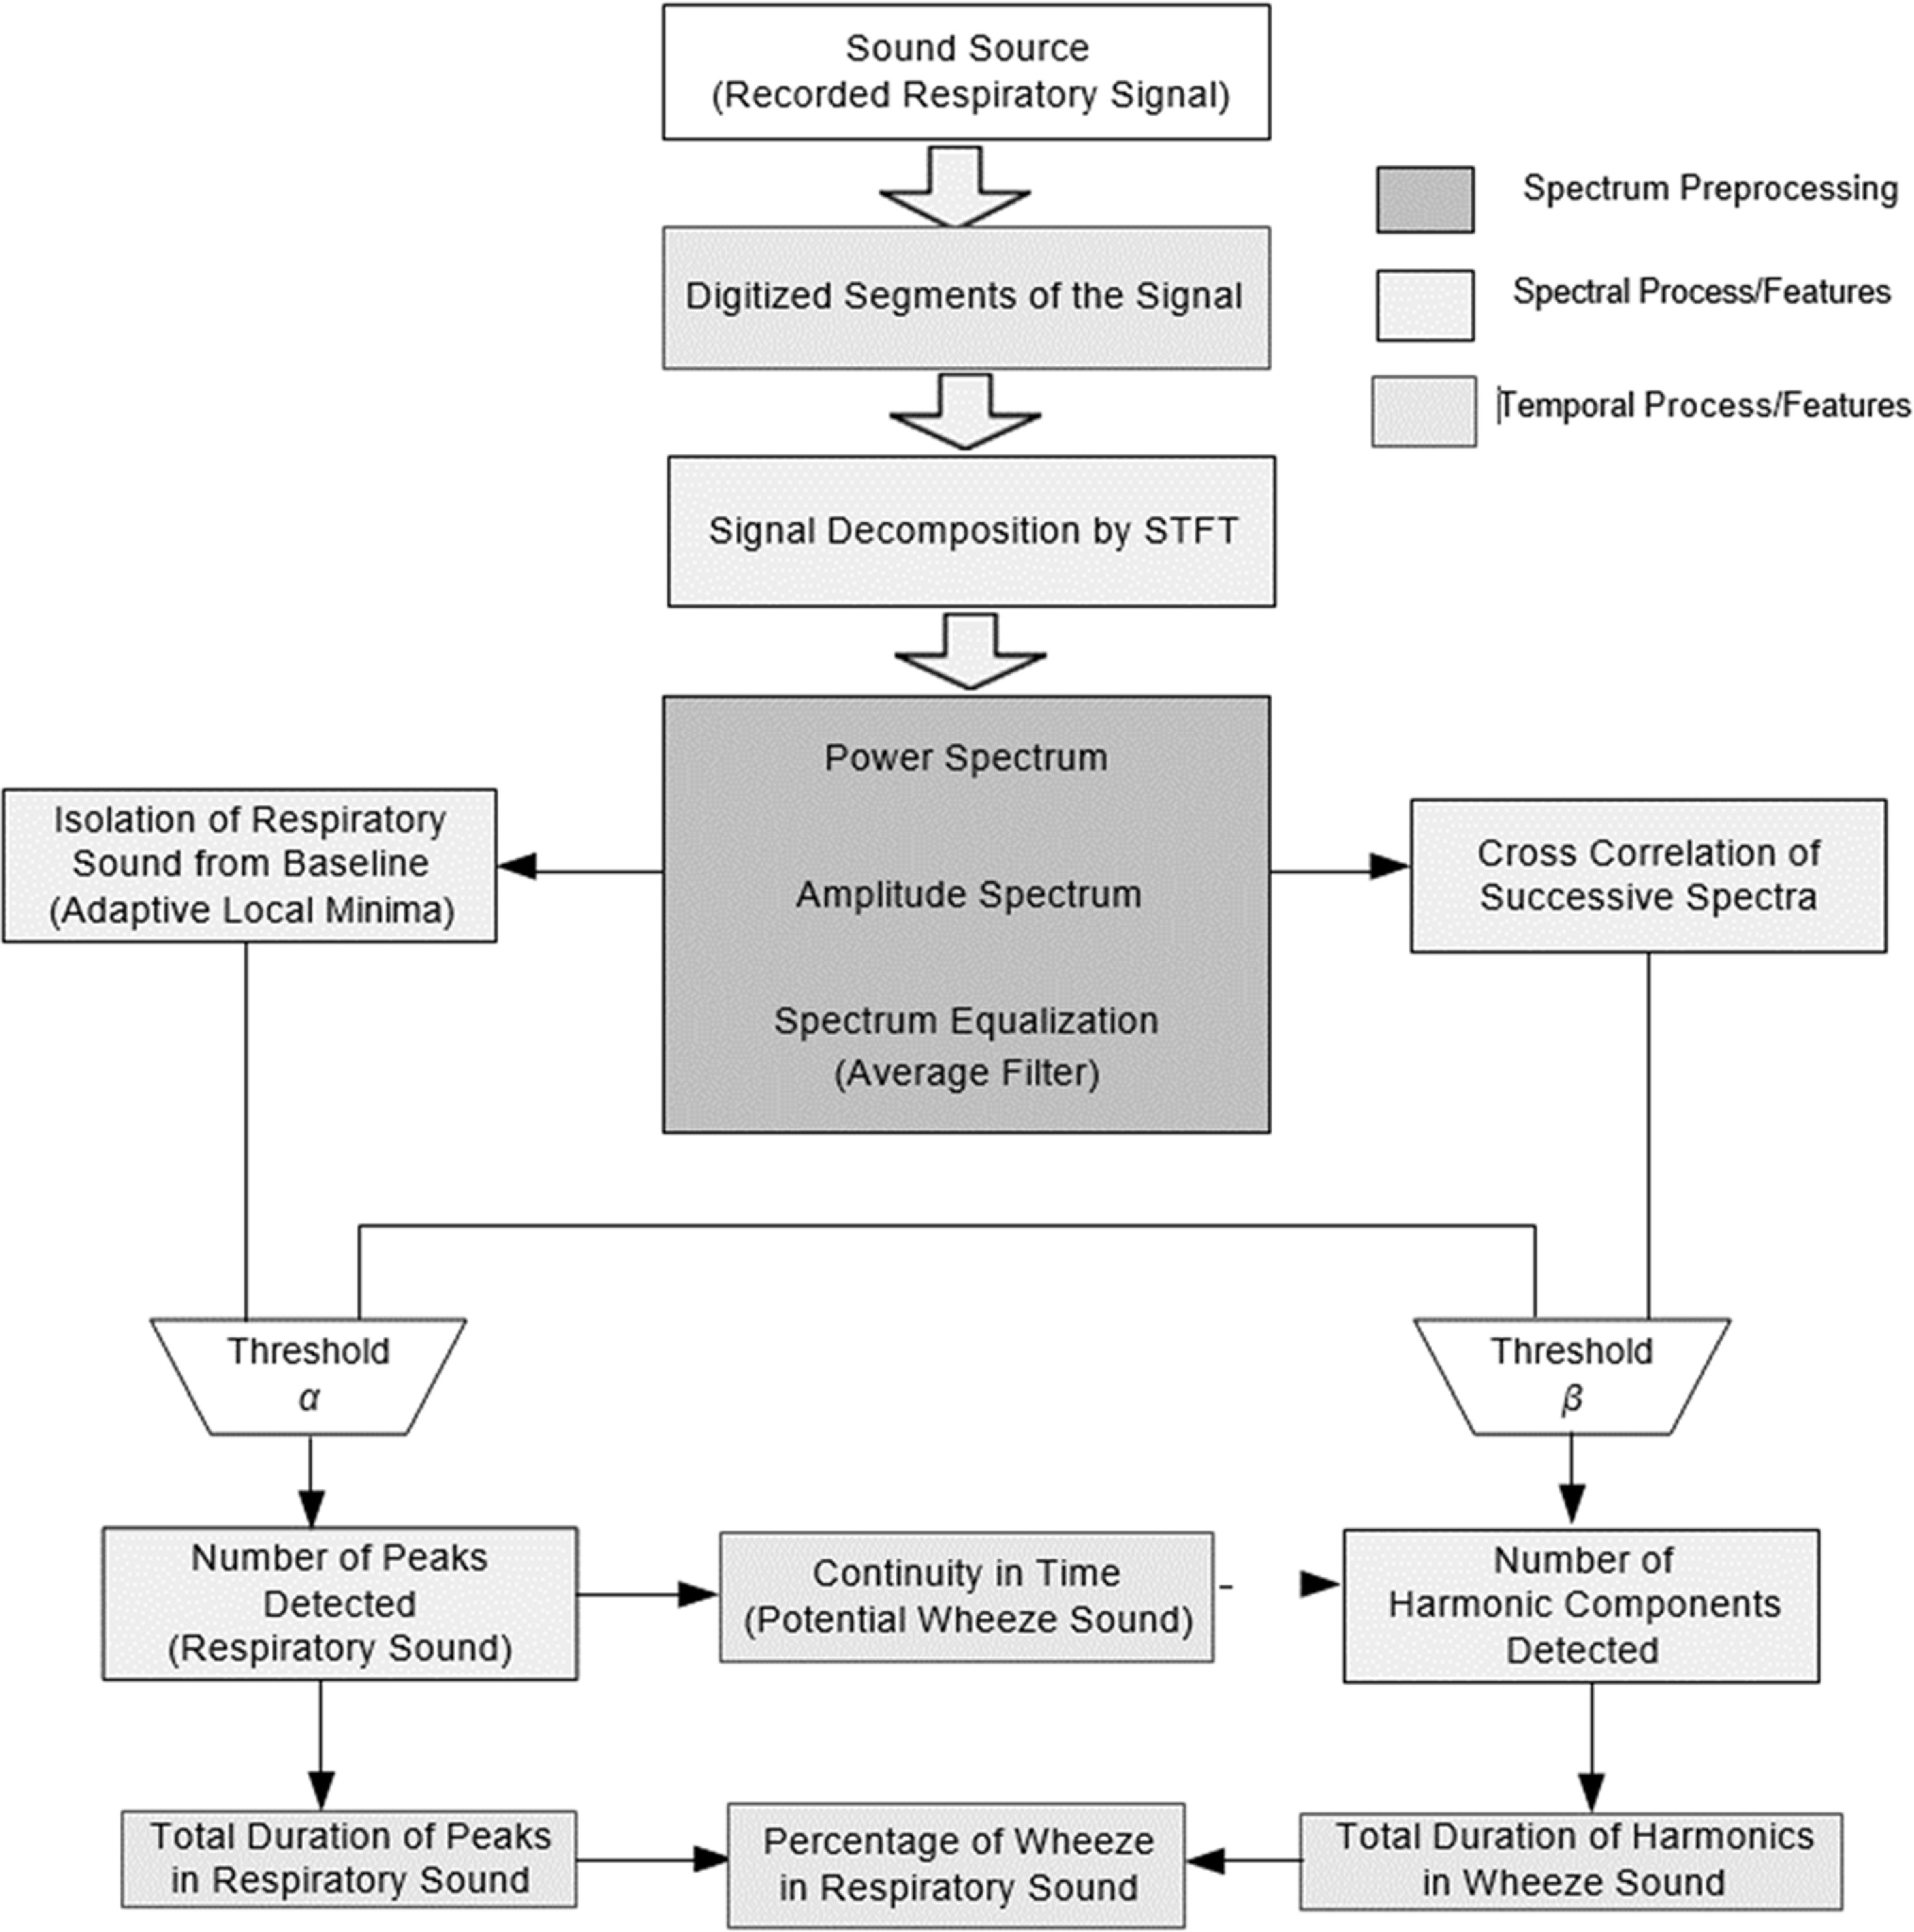
Processing of lung auscultations for identification of lung conditions require design of multiple signal processing and classification models. These models initially pre-process auscultations for multiple noise removal, which helps in extracting true auscultation signals from the input data. The denoised signals are segmented to extract lung-sound locations, which assist in signal reduction, thereby enhancing classification speed and performance. These segments are transformed into distinct multispectral domains via feature extraction, which helps in identifying pattern variation in different auscultation signals [1]. To reduce feature redundancy, variance-based selection models are deployed, which assist in identifying the most relevant feature sets from the extracted features. These selected feature sets are classified by machine learning based models, thus identifying current lung conditions. A typical auscultation processing model is depicted in figure 1, wherein various peak processing layers are observed, and classification layers can be observed.
Figure 1. A typical auscultation processing model.
Download figure:
Standard image High-resolution imageIt can be observed that auscultation signals are represented in frequency domain, and spatial domains for final classification, due to which percentage of peaks, harmonics, and wheeze probability can be determined. However, the efficiency of these models is heavily dependent on auscultation quality, denoising quality, feature extraction and selection quality, and performance of classification engine [2]. Due to this, these models provide a highly varied performance under clinical conditions. To improve this performance, researchers identify clinical information with lung auscultations, which facilitates reducing performance variability. A review of these models that discusses their nuances, advantages, limitations, and future research scopes is carried out in the next section. Based on this review, it was observed that existing models lack scalability and classification efficiency due to limited database correlation performance. To overcome this limitation, section 3 discusses the design of a transfer learning model for correlative analysis of auscultation and clinical parameters through detailed AI-based recommendations. The proposed model initially classifies both auscultation and clinical features through machine learning and combines them via an elaborate AI approach. The performance of the proposed model was evaluated in section 4 and compared to various state-of-the-art approaches in terms of delay, accuracy, precision, recall, and AUC. Finally, this text concludes with some interesting observations about the proposed model and recommends various approaches to improve its performance.
A few system models are available for correlational analysis between lung sounds and clinical features. This is a significant research gap in this area of biomedical signal processing and analysis. However, a few models have been proposed to perform similar tasks, which can be used by researchers for designing their application-specific correlation models. For instance, work in [3, 4] examines correlation models for systemic sclerosis patients and patients with acute pulmonary pathologies. Based on this research, work in [5, 6] proposes auscultation denoising and processing models in clinical environments. These models must be employed by researchers to obtain real-time auscultatory signals for better classification performance. An application of such signals can be observed from [7], where automatic cardiac auscultations for paediatric patients are extracted and classified via machine learning models. The performance of this model is extended in [8] through blind recovery of auscultatory sounds through nonnegative matrix factorization (NMF) framework.
Models proposed in [9, 10] demonstrate the use of correlation analysis between auscultation and clinical parameters through convolutional recurrent Neural Networks (RCNN), and Wasserstein Generative Adversarial Networks (WGANs). These network models provide a correlation of different clinical features with auscultatory signals, thereby enhancing lung status evaluation performance. This performance can be improved by integrating denoising and signal acquisition models as discussed in [11, 12], wherein diaphragm design and wavelet filters are proposed for better signal to noise ratio (SNR) for real-time clinical signals. This process can be automated through the work in [13], where Bayesian Optimization (BO) formulation is used for error checking and redundancy reduction during sound capture and control operations. These actions can be employed to detect Acute chest syndrome (ACS) as proposed in [14], wherein random under-sampling boosted tree (RUSBT) is used for correlative analysis. This model’s performance can be further enhanced by using wheezes [15], and fast Fourier Transform (FFT) for lung-based disease classification. In [16–18], wherein periodic-coded deep autoencoder, and bios-level breath sound classification are discussed and evaluated for different applications. In [19, 20], researchers have combined average and variance calculations (AVC) with a hidden Markov Model for better correlation analysis between auscultation and clinical features. However, a few of these models are useful for real-time applications, thus, their scalability performance is limited. To improve this performance, the next section proposes the design of a transfer learning model for correlative analysis of auscultation and clinical parameters through comprehensive AI-based recommendations. This model was tested in a wide range of real-time scenarios concerning different reviewed models in terms of precision, delay, accuracy, recall, and AUC measures, which enabled it to validate its performance under different clinical applications.
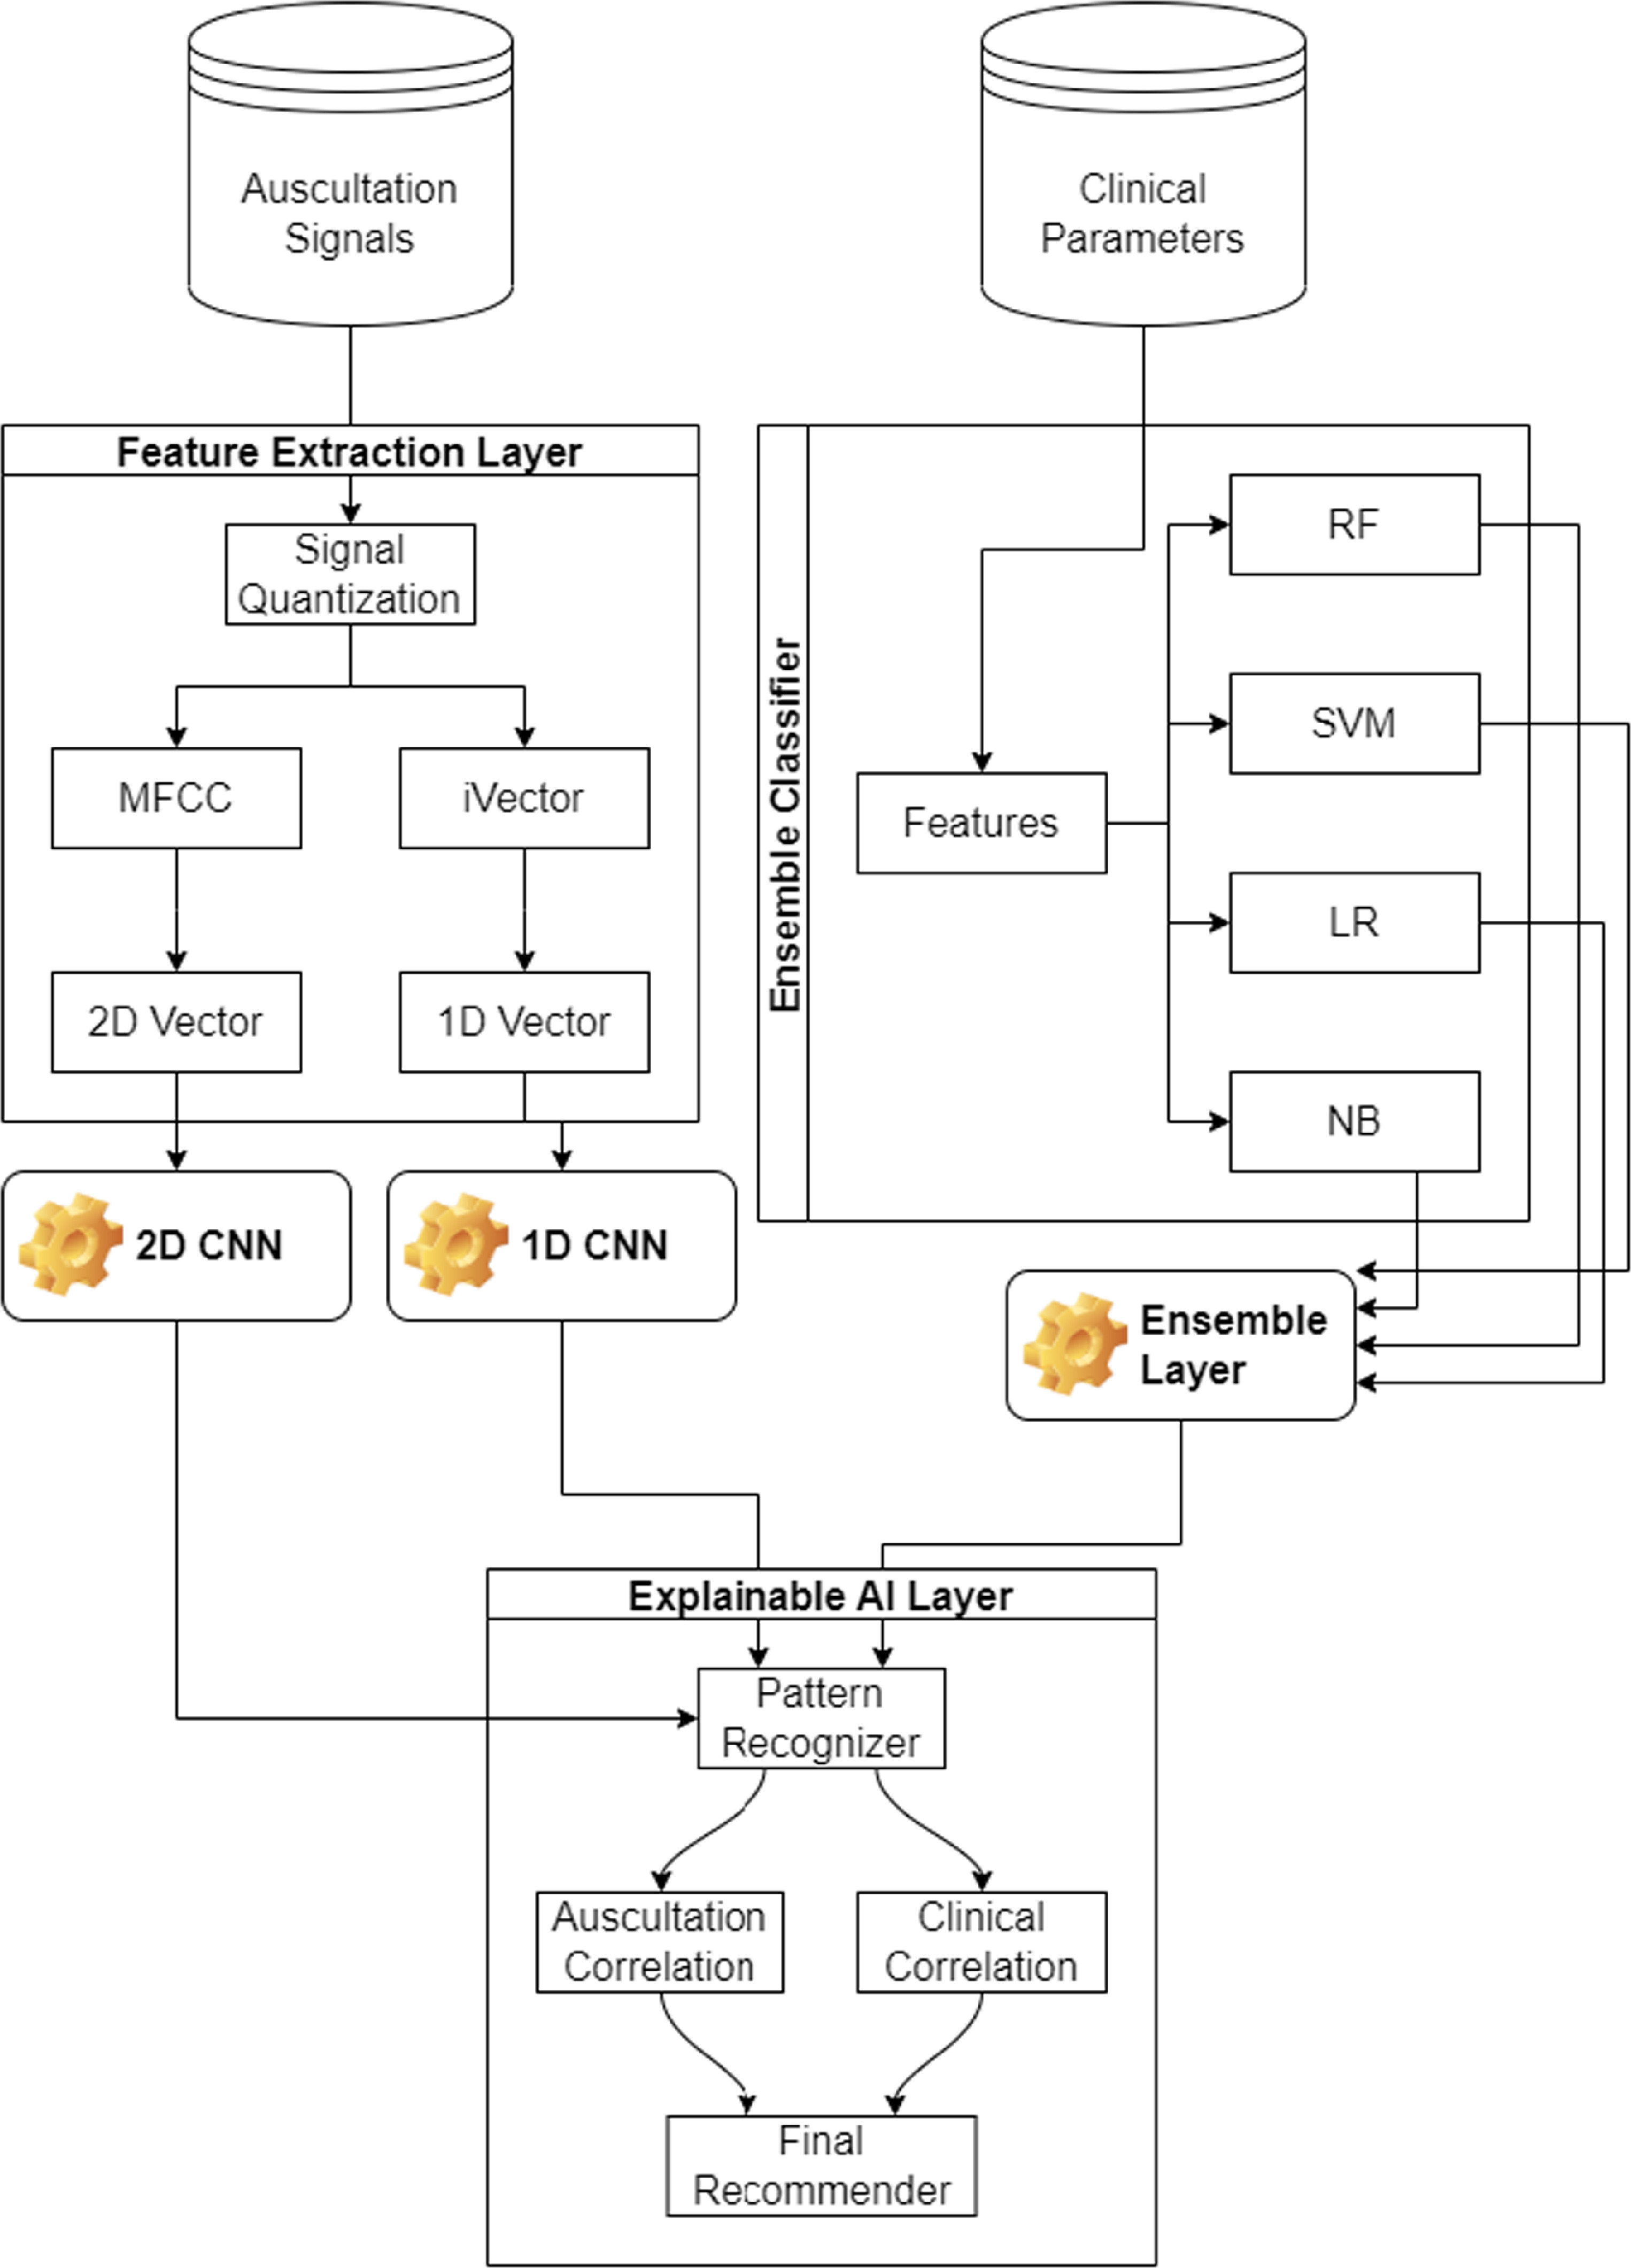
Based on the literature review, it was observed that existing correlation models utilize auscultation datasets, and combine them with clinical data via approximations, due to the exact reasons for prevalent lung conditions. To overcome these limitations, the design of a composite transfer learning model for correlative analysis of auscultation and clinical parameters through an AI-based recommender is discussed in this section. The proposed model initially converts auscultations into 2D vectors using feature extraction and quantization operations. These 2D vectors are used to evaluate lung conditions through a transfer-learning based CNN model. The same auscultation data is converted into 1D iVectors and categorized using a custom 1D CNN model, which assists in determining current lung conditions. This classification status is correlated with clinical parameters which include Forced Expiratory Volume (FEV1), Forced Vital Capacity (FVC), ratio of FEV1 to FVC, patient’s height, weight, age and gender, patient’s smoking condition, any ongoing cough conditions, current phlegm levels, shortness of breath conditions, wheezing conditions, and fatigue status. Clinical parameters are classified by a combination of random forest (RF), support vector machine (SVM), linear regression (LR), and Naive Bayes (NB) models. The overall flow of the correlation process can be observed from figure 2, wherein auscultations and clinical parameters are correlated via an elaborate AI model, which assists in obtaining disease-specific recommendations.
Figure 2. Overall flow of the proposed model.
Download figure:
Standard image High-resolution imageThe Feature Extraction layer includes Signal quantization. Signal quantization is a fundamental process in digital signal processing that involves converting a continuous range of amplitude values into a finite set of discrete levels. This step is essential for representing analog signals in digital form, enabling storage, processing, and transmission using digital systems. From the flow, it can be observed that the results of all 3 classifiers are combined using an elaborate AI layer. This layer is created using a pattern recognizer, which assists in identifying similarities with auscultation and clinical features.
These correlation values are used for final recommendation, which consists of causes that have led to current lung conditions. Clinical experts can advise patients to modify a set of dietary or medicinal schedules, which can assist in improving lung health. To simplify the development process, the entire design of the proposed model is divided into 4 distinct parts, and each of these parts are discussed in separate sub-sections of this work. Researchers can implement the proposed model in part(s) or as a whole, depending on their clinical needs.
3.1. Design of feature extraction layerTo process auscultations for feature extraction, they are analysed in the range of (0,1), which provides a range-limited representation. These auscultations are recorded at a sampling frequency of  , and each of these samples are quantized via equation (1),

Where  represents quantized auscultations, and normally captured auscultations respectively. These quantized components are represented in Mel frequency domain via equation (2),

Where  represents the Mel frequency component for the quantized signal. Based on this, the cepstrum of the Mel frequency component is evaluated via equation (3),

This signal is filtered via DC-offset normalization via equation (4),
This normalized signal is passed through a triangular filter, which is represented via equation (5) as follows,

Where  represents Mel Frequency filter bank matrix and is used for post-processing the normalized signal. This filter bank is represented via equation (6) as follows,

Where  represents the frequency component of the input signal. The triangular waveform is passed through a discrete cosine transform (DCT) filter bank to obtain MFCC components via equation (7),
Where  represents component number of MFCC being analyzed. These MFCC values are converted to 2D vector via the following process,
Initialize an input 2D vector  of size 150 × 150 with unity values.
Initialize 
For each element in the MFCC vector,
Increment


If  increment,


Continue this process for all elements in the MFCC vector along with these MFCC components, iVector components are also extracted, which assists in simplification of feature representation for input lung sounds. This iVector is estimated using equation (8) as follows,

Where  represents number of inputs, and value of that input, while
  indicates variance between sample numbers
  , which is estimated via equation (9) as follows,
Where  represents value of variance for the given input
  , which assists in evaluation of feature consistency, and is evaluated via equation (10),
Using these entities, various feature vectors are evaluated, and classification is carried out through transfer learning-based CNN model, which is depicted in the next sub-section.
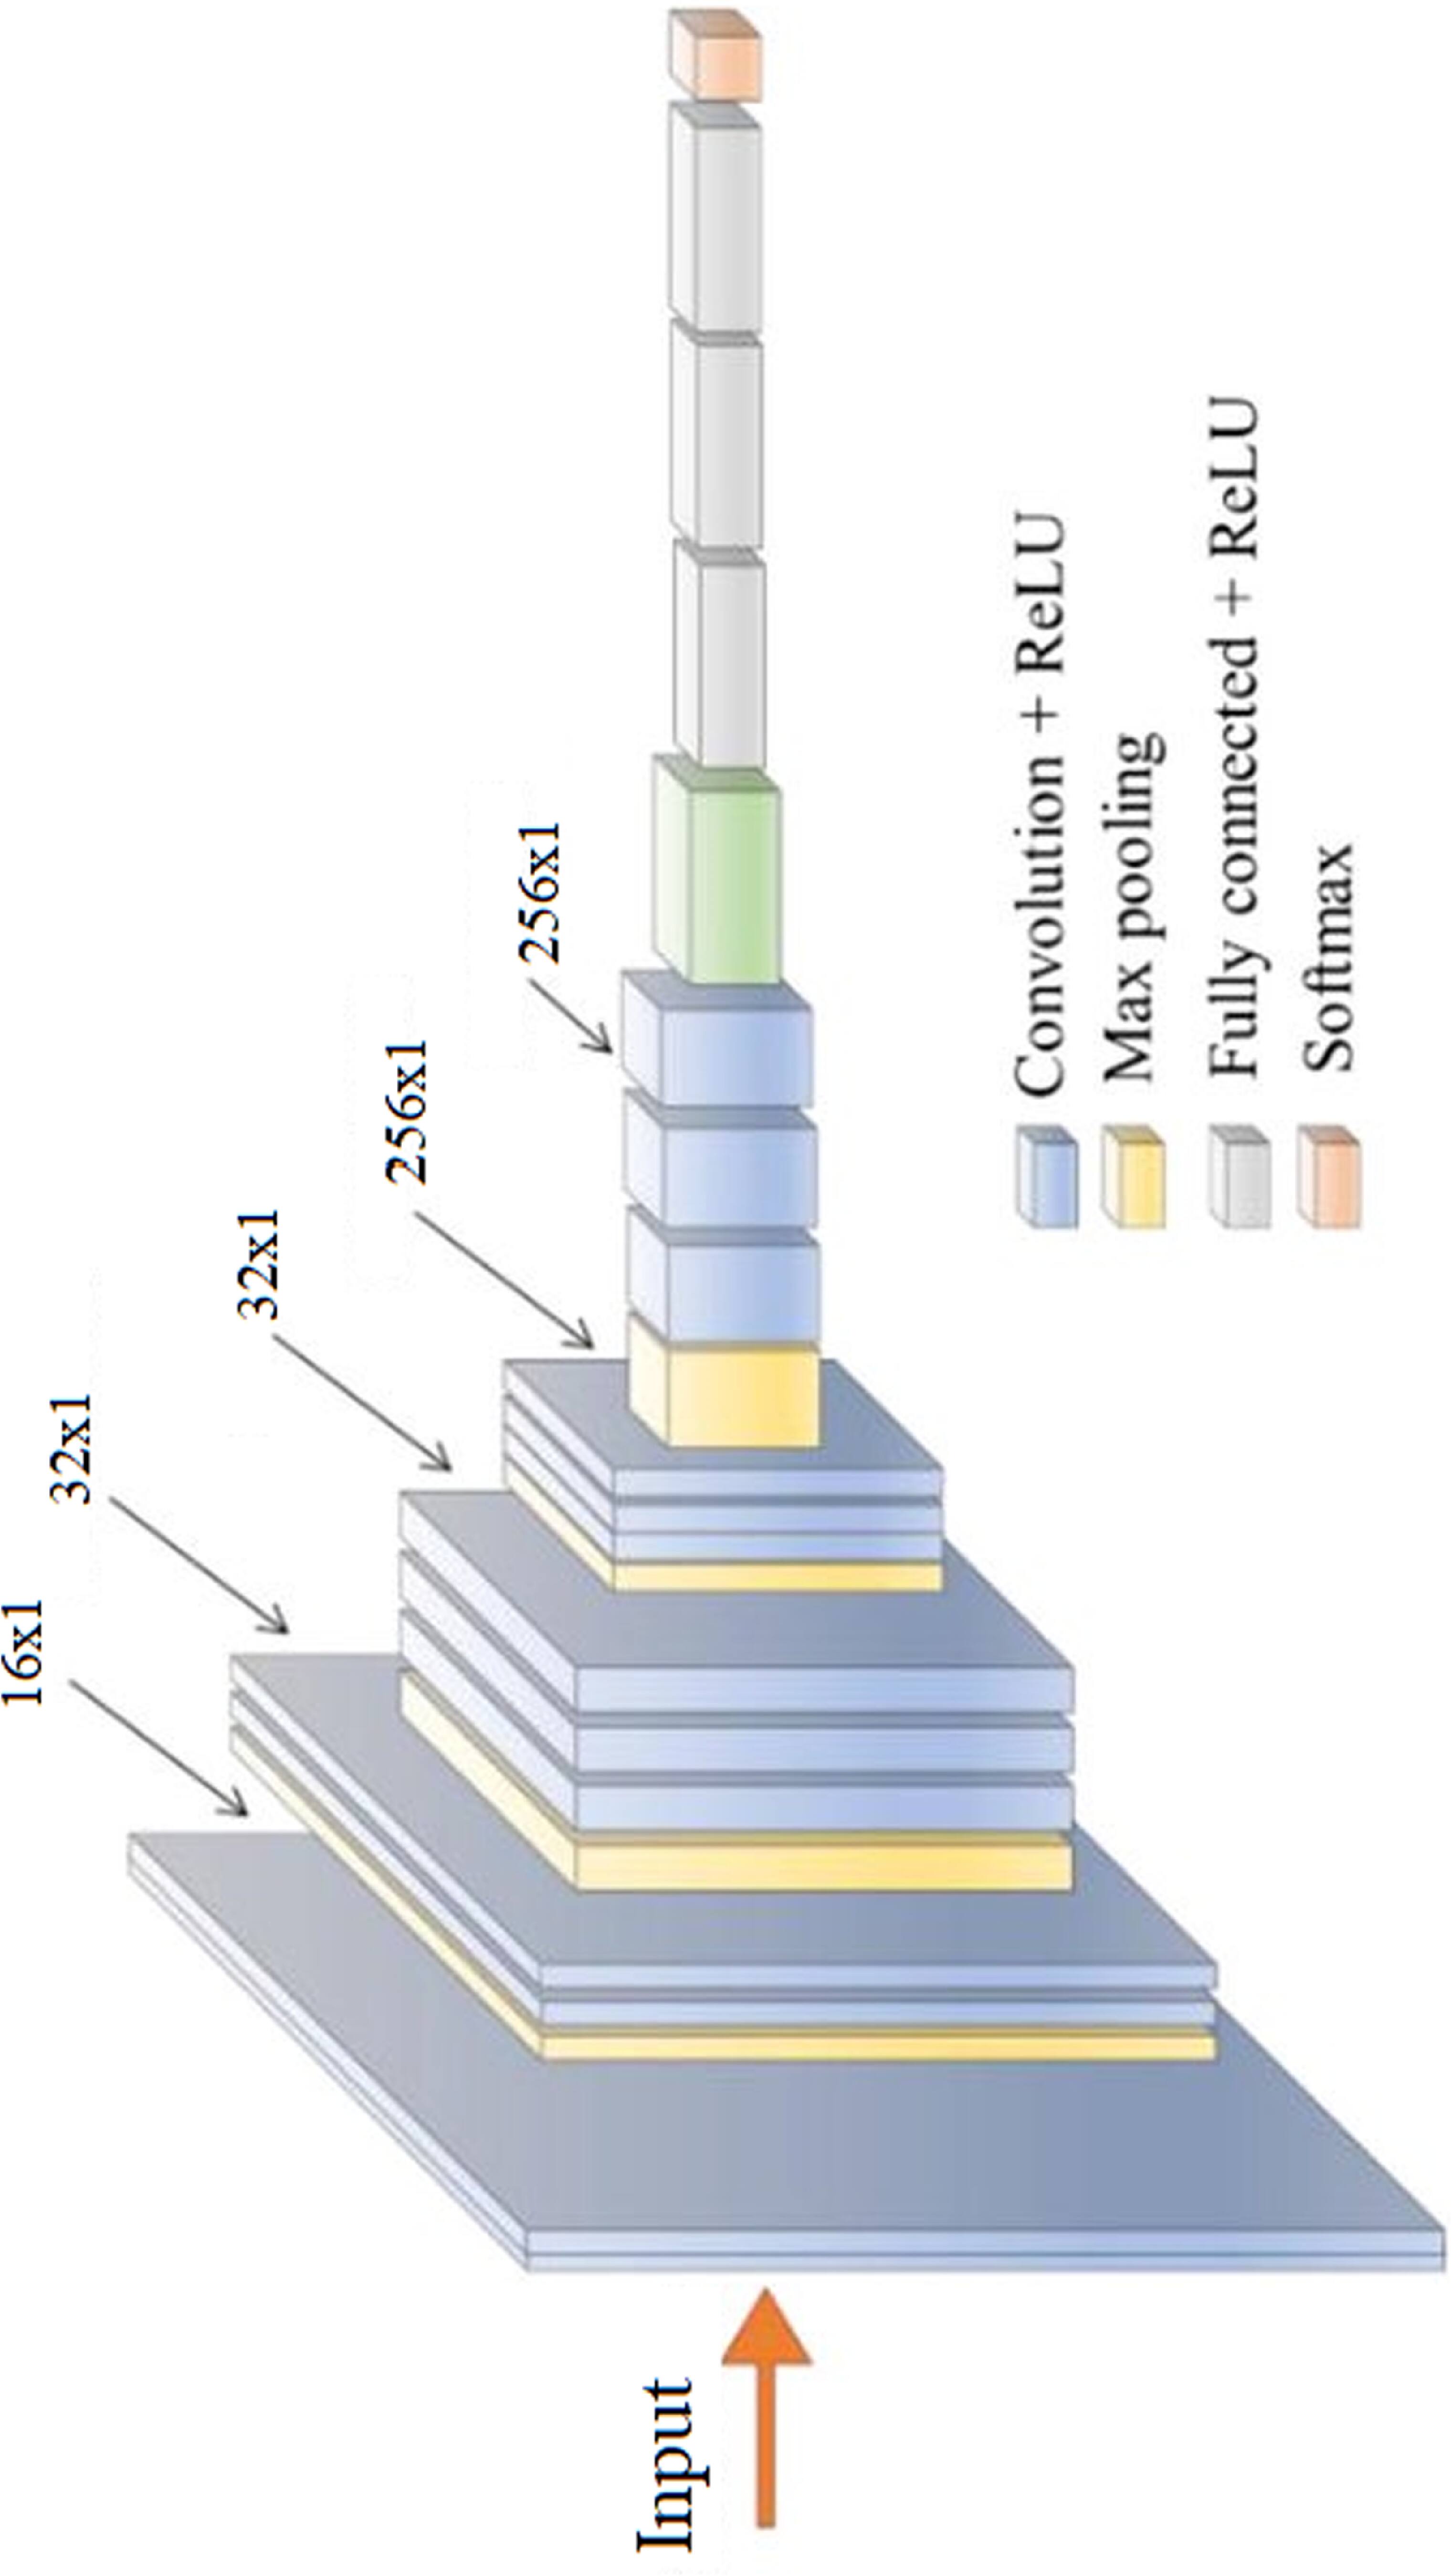
3.2. Design of auscultation classification layerBoth MFCC and iVector features are classified using 2D CNN and 1D CNN Models. Model for iVector features is depicted in figure 3, wherein entire layer connections can be observed. A similar model is employed for MFCC based 2D feature classification and utilizes VGGNet-19 method. Both these models utilize various convolutional layers, each of which has different filter and padding sizes. These sizes vary between 16 × 16, with a rectangular window size of 3 × 3, and 256 × 256 with a rectangular window size of 3 × 3, due to the convolutional features being extracted in large quantities. The features extracted from the convolutional layer are characterized by equation (11), and each of them depend on an activation kernel, which is responsible for variance maximization-based feature analysis. The Rectilinear Unit (ReLU) is recommended for linear feature activation and is therefore utilized in this application.
Where MFCC is derived from MFCC values, m,n is represented rows and columns, while a,b is represented current window row, and current window column for the given convolutional layer.
Figure 3. The 1D CNN model for iVector classification.
Download figure:
Standard image High-resolution imageTotal number of features extracted via the convolutional layer are evaluated via equation (12),

Where fin is the total number of input features, fout is the total output features, p is the size of padding, s is the size of stride, and k is the size of kernel used for convolutions. Due to extraction of numerous features, redundancies are introduced into the convolutional model; to reduce these redundancies a feature variance-based Maximum Feature Pooling (Max Pool) layer is integrated with each convolutional layer. The Max Pool layer evaluates variance between extracted convolutional features and eliminates the ones with lower variance. To perform this task, a variance threshold is evaluated via equation (13) as follows,

Where Xk represents size of 2D input vector, pk represents a probability factor, which is used for feature optimization via hyper parameter tuning and control. All features that have a variance more than fth are selected, and given to the next convolutional layer, while other features are discarded. This process is evaluated for different layer sizes of 32 × 32, 64 × 64, 128 × 128, and 256 × 256 to obtain a large set of highly varying features. The extracted features are derived from a fully connected neural network (FCNN) that classifies them into 1 of N different lung condition classes. To perform this classification, a SoftMax activation function is employed due to its backpropagation-based training capabilities. Output of this activation function is evaluated via equation (14) as follows,

Where cf represents value of input feature vector, wf represents feature weight value, b represents feature bias value, and Nf represents number of features extracted by the convolutional layer. The same procedure is repeated for iVector features, and 2 different lung condition classes are evaluated. These classes are utilized by the explainable A decision fusion layer implemented via weighted majority voting mechanism for final analysis.
3.3. Design of ensemble classification layer for clinical parametersThe ensemble classification layer comprises random forest (RF), support vector machine (SVM), linear regression (LR), and Nave Bayes (NB) models, which work in tandem to classify clinical parameters into 1 of N lung states. Before categorizing inputs into these states, all clinical parameters are evaluated in terms of variance via an inter-class variance maximization layer. This layer estimates a variance threshold through equation (15), which considers inter-class variance for feature selection and control.
Where cf, m and n are clinical features, total number of features present in current class, and the total number of features present in other classes. Features with variance more than Vth are used for classification, while others are discarded. The selected features guarantee high variance, thus enabling classifiers to identify separation criterion between different lung states. Depending on these features, different classifiers are trained, and their accuracy values are combined to achieve the final classification. These classifiers are incorporated into equation (15), wherein test accuracy of each classifier is used to obtain a final lung state.
Where NBc, LRc, RFc and SVc represent output class for the respective classifiers, while NBw, LRw, RFw and SVw represent classifier weights, which are evaluated via equation (16),

Where Cw represents classifier weight, Ciand GTi represent output class and ground truth class, while Ntest represents total number of samples used for testing each classifier. Based on this evaluation, clinical lung state is evaluated and passed to the appropriate A decision fusion layer implemented via weighted majority voting mechanism for final recommendations.
3.4. Design of explainable a decision fusion layer implemented via weighted majority voting mechanism for final recommendationThe initial evaluation of lung state is carried out through clinical and auscultation features, then an elaborate A decision fusion layer implemented via weighted majority voting mechanism is activated for final evaluation of patient’s health status. To perform this task, ‘m’ readings for the same patient are considered, and correlation between each MFCC, iVector and clinical feature vector is evaluated via equation (17),

Where Cj,l represents correlation between the two feature sets ( ),
),  represents ith feature for the jth feature set, while Nf represents number of features in the selected feature set. Based on these values, a composite distance metric is evaluated between correlation of MFCC, iVector and clinical feature correlations via equation (18) as follows,
Where  represents composite distance metric,
  represents Canberra distance between correlation values of
  and
and  feature, while CBlock, Cos, M, Euc, Hamming, Kul, RR, SS, and BaC represents city block, cosine, Minkowski, Euclidean, Hamming, Kulsinski, Russel Rao, Sokal Sneath, and Bray Curtis feature Metrics. These metrics are chosen based on their distance measurement efficiency for given correlation values. Different Novel Metrics are evaluated for each pair of correlations, and a correlation threshold is evaluated via equation (19),

Where Nc represents number of correlations available for the given set of inputs, and include MFCC, iVector and clinical features, while τ is a tuning factor, and is evaluated via equation (20) as follows,

Where Ncommon represents number of common values in the set
(MFCCclass, iVectorclass,CFclass) where each value represents output class from the given feature vector, Ntotal represents total number of classes output by the classifier, and Ctest represents correlation between test input and the dataset. This correlation is evaluated for each feature vector and then averaged for improved control. To evaluate this test correlation, equation (21) is used, which estimates maximum value of correlation between individual feature sets,
Where N, Nf is the number of entries fetched by the classifier, and the number of features for each entry. If this correlation is more than 0.9999, then this test sample is fed back into the system, and the model is retrained after sufficient retraining samples are selected. Based on this evaluation, the correlation between clinical and auscultation features is examined. If the correlation of any reading pair is more than Cth then that reading pair is selected for recommendation, and the difference between the maximum and minimum parametric value is evaluated for final explanation. This difference is calculated in terms of percentage change via equation (22) as follows,

Where R indicates the value of the clinical reading, while Rval represents the recommendation output value which will be explained by the AI model to the patient. For each clinical reading, a change of Rval is recommended by the model, which can be employed by clinical experts. Based on this process, numerous clinical evaluations were conducted, and their results were evaluated.
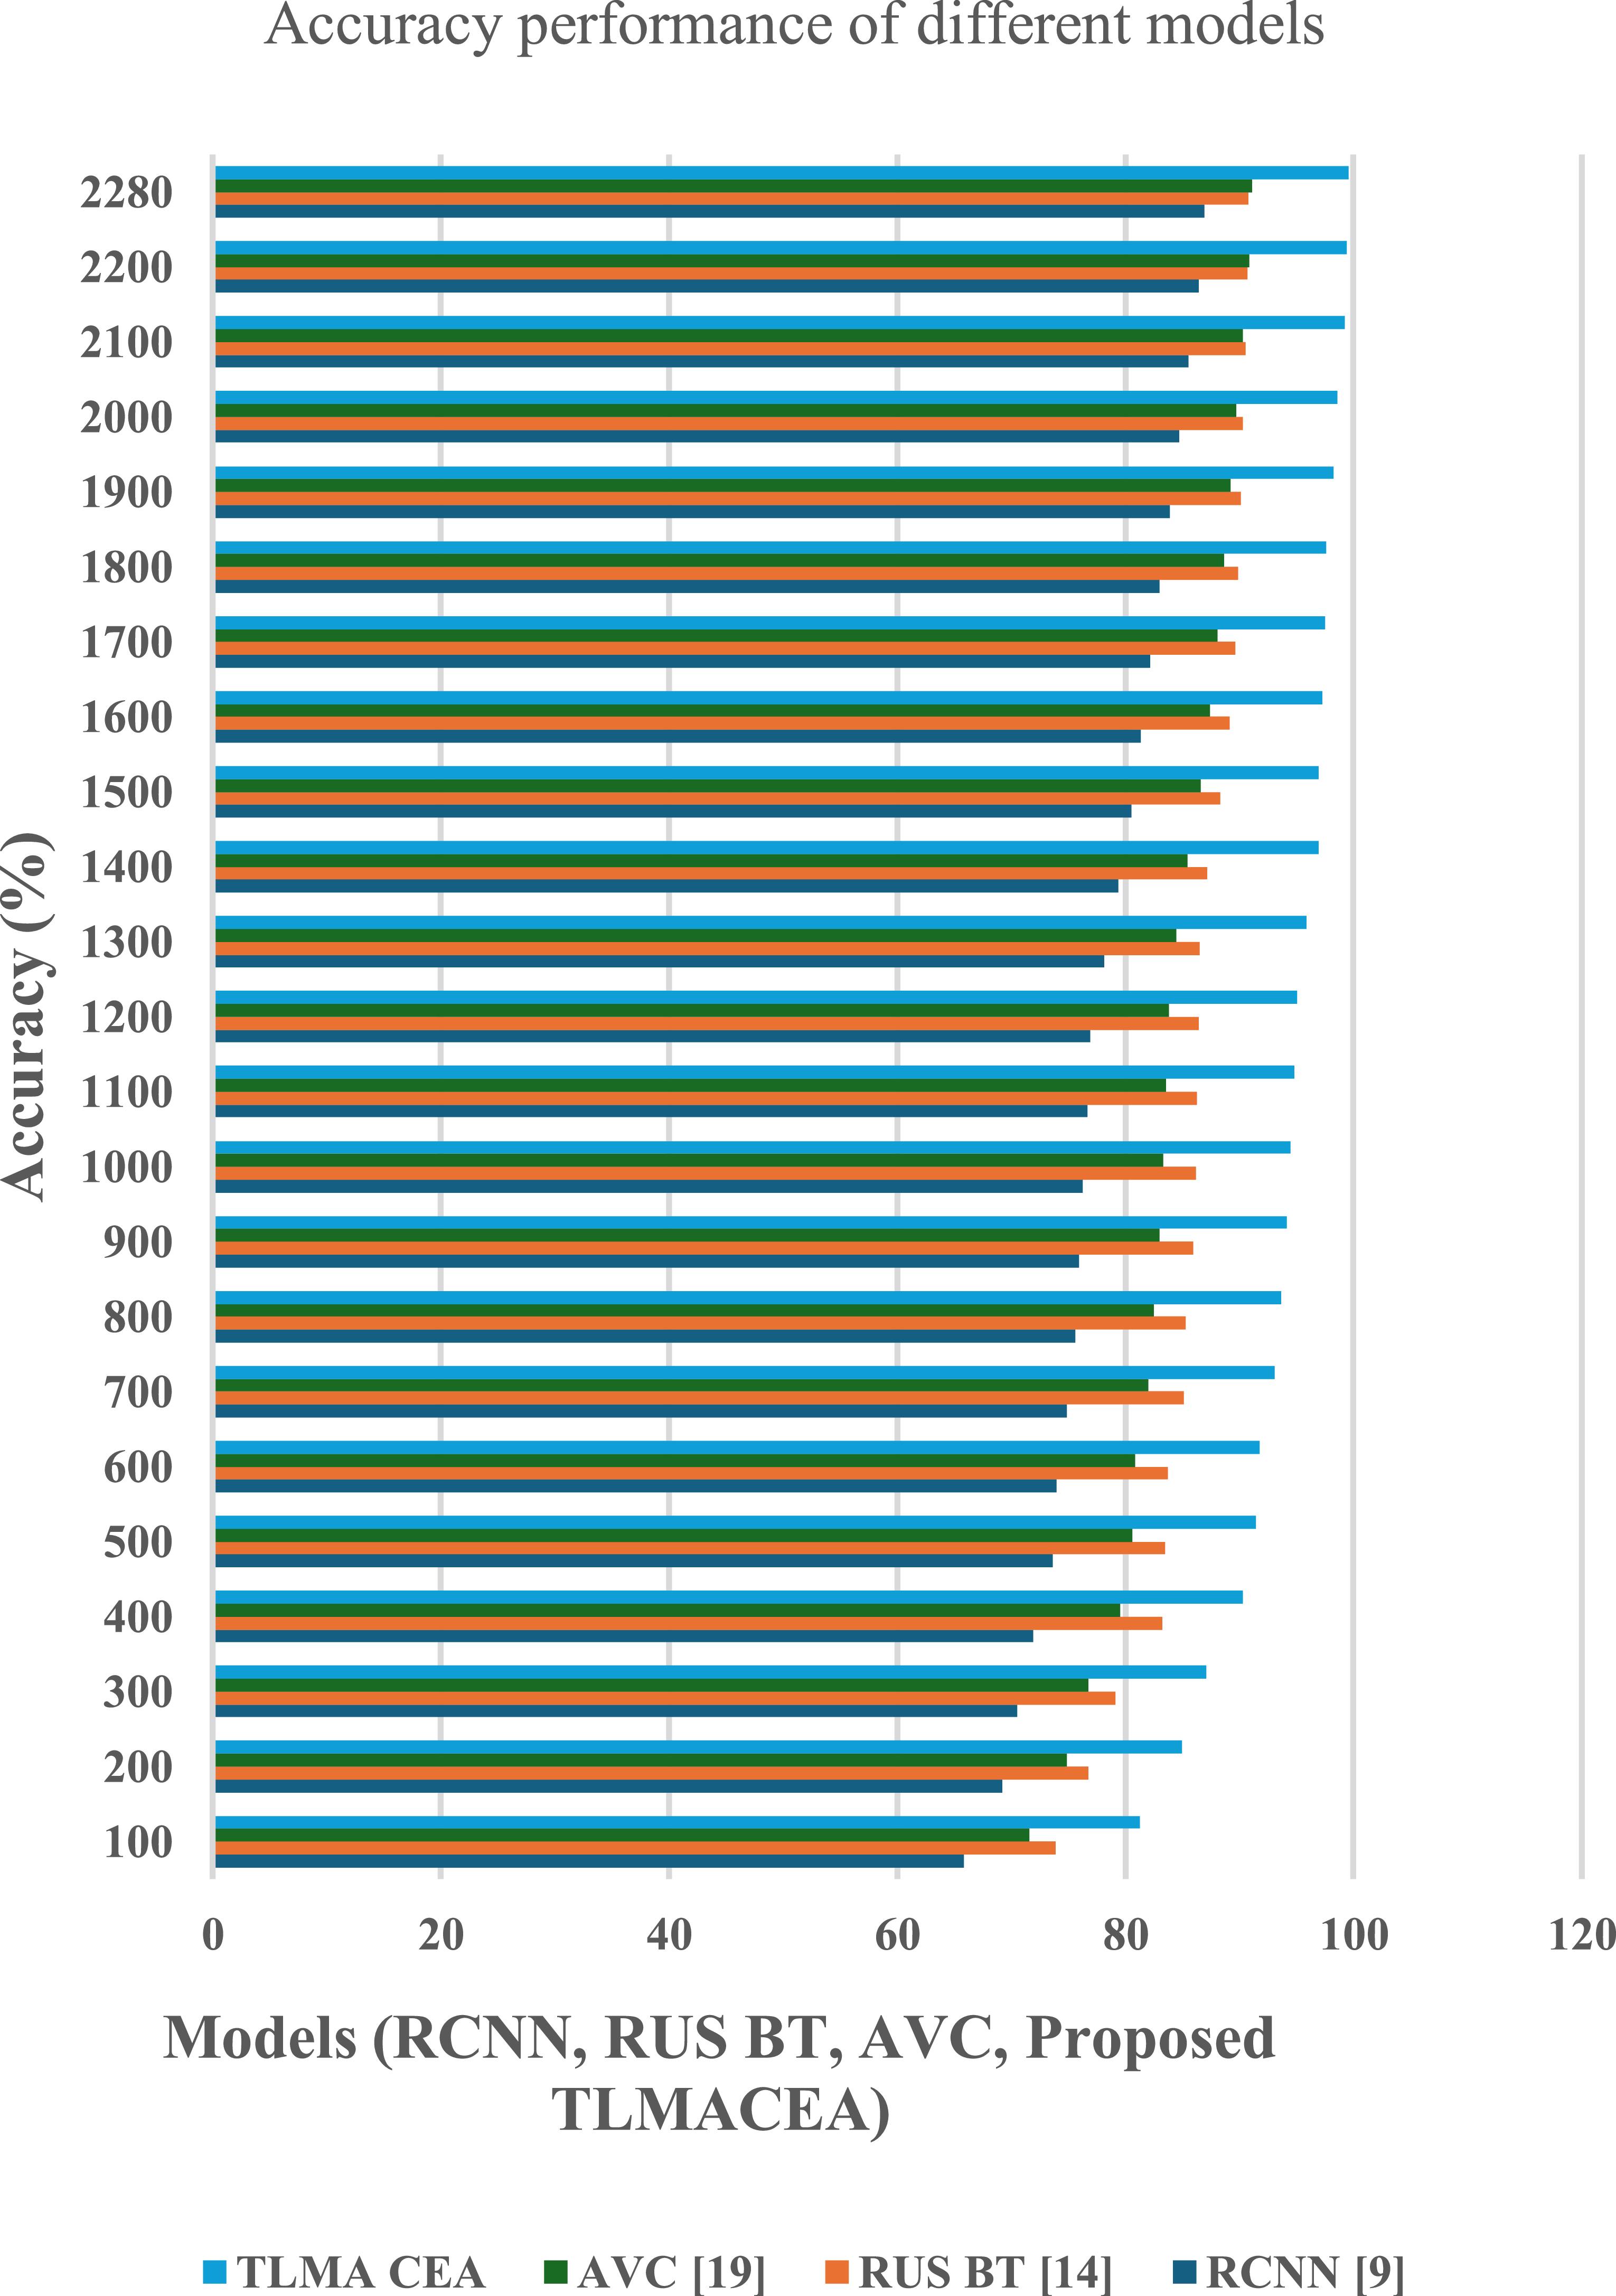
The proposed TLMACEA model utilizes a combination of auscultation and clinical data classifications to estimate current lung conditions and recommend parametric changes to improve lung health. To estimate the performance of this model, its accuracy, precision, recall, AUC, and delay metrics were evaluated and compared with RCNN [9], RUS BT [14], and AVC [19]. A real-time analysis of 190 patients with prevailing lung conditions was conducted, and their auscultations and clinical parameters were tagged with asthma, Chronic obstructive pulmonary disease (COPD), and control group classes. These tags were evaluated by clinical experts and then presented to the model for training and validation. Each patient’s auscultations and clinical parameters were evaluated monthly over the period of 1 year to obtain 2280 total readings. Based on these readings, accuracy values were evaluated in figure 4.
Figure 4. Accuracy performance comparison of different models (RCNN, RUS BT, AVC, and the proposed TLMACEA). X-axis: Models; Y-axis: Accuracy (%).
Download figure:
Standard image High-resolution imageBased on this evaluation and figure 4, it can be observed that the proposed model is 12.5% accurate than RCNN [9], 8.9% accurate than RUS BT [14], and 8.4% accurate than AVC [19], which makes it highly effective for a variety of clinical applications.
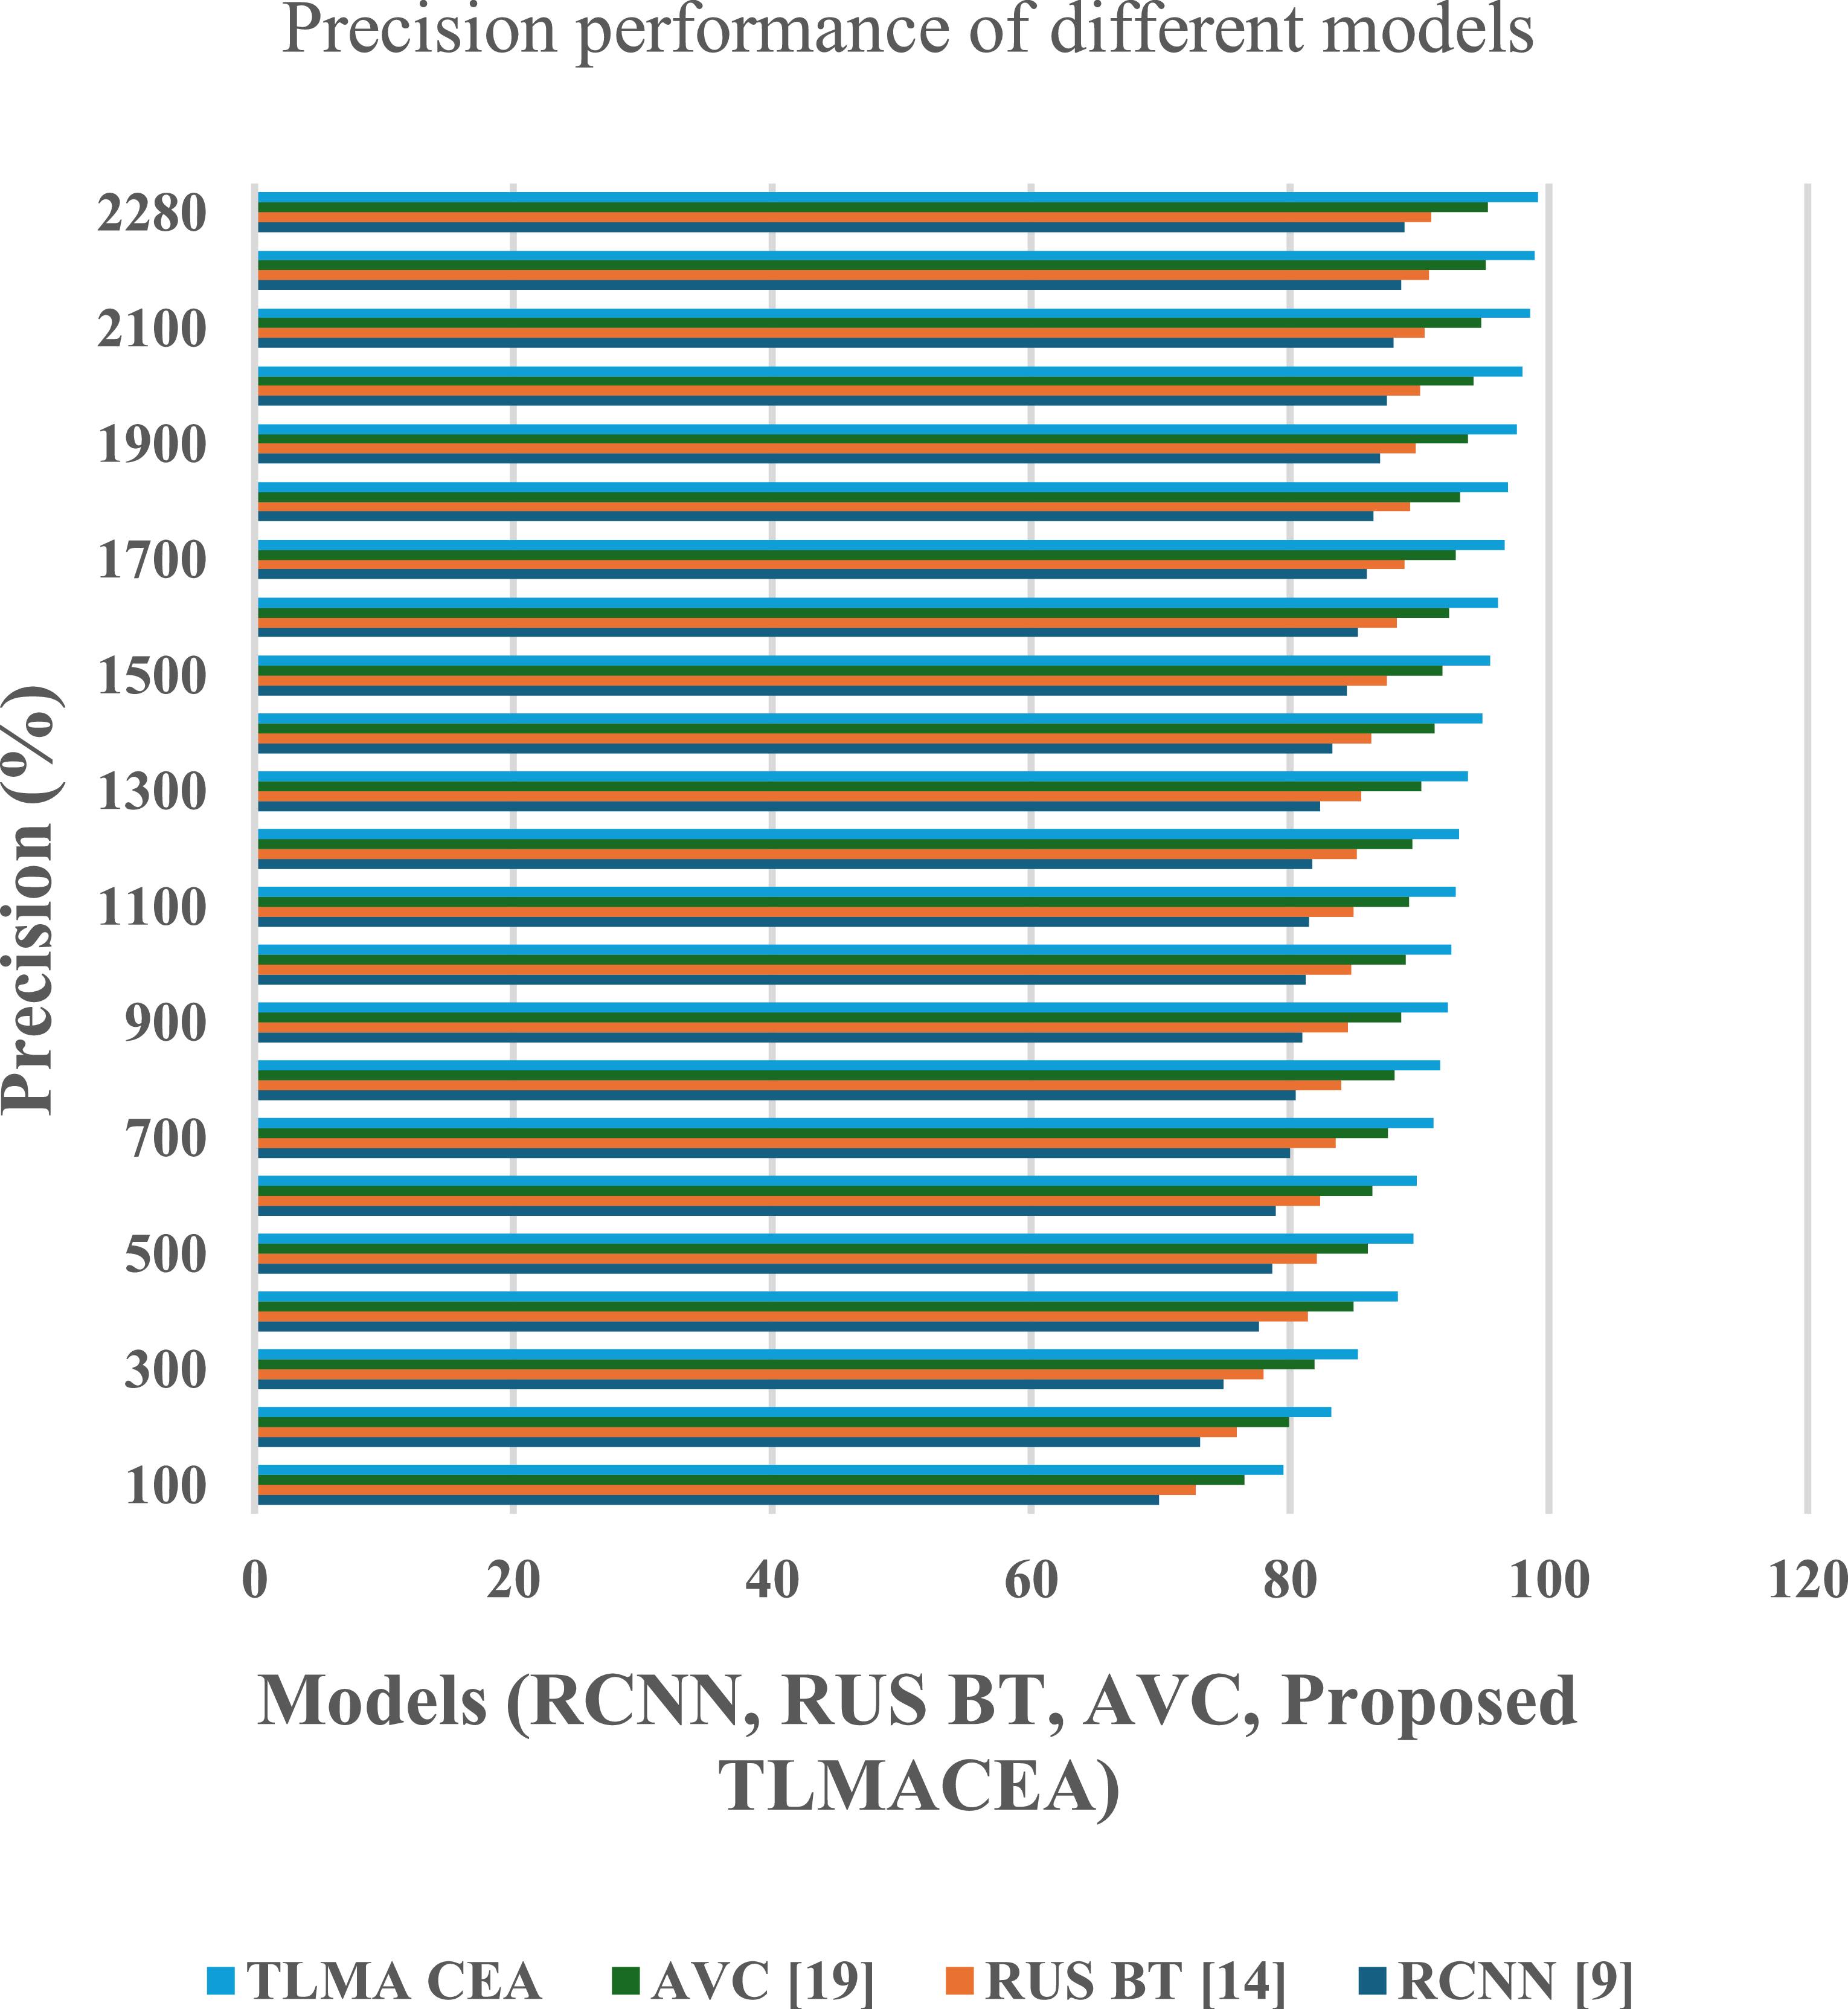
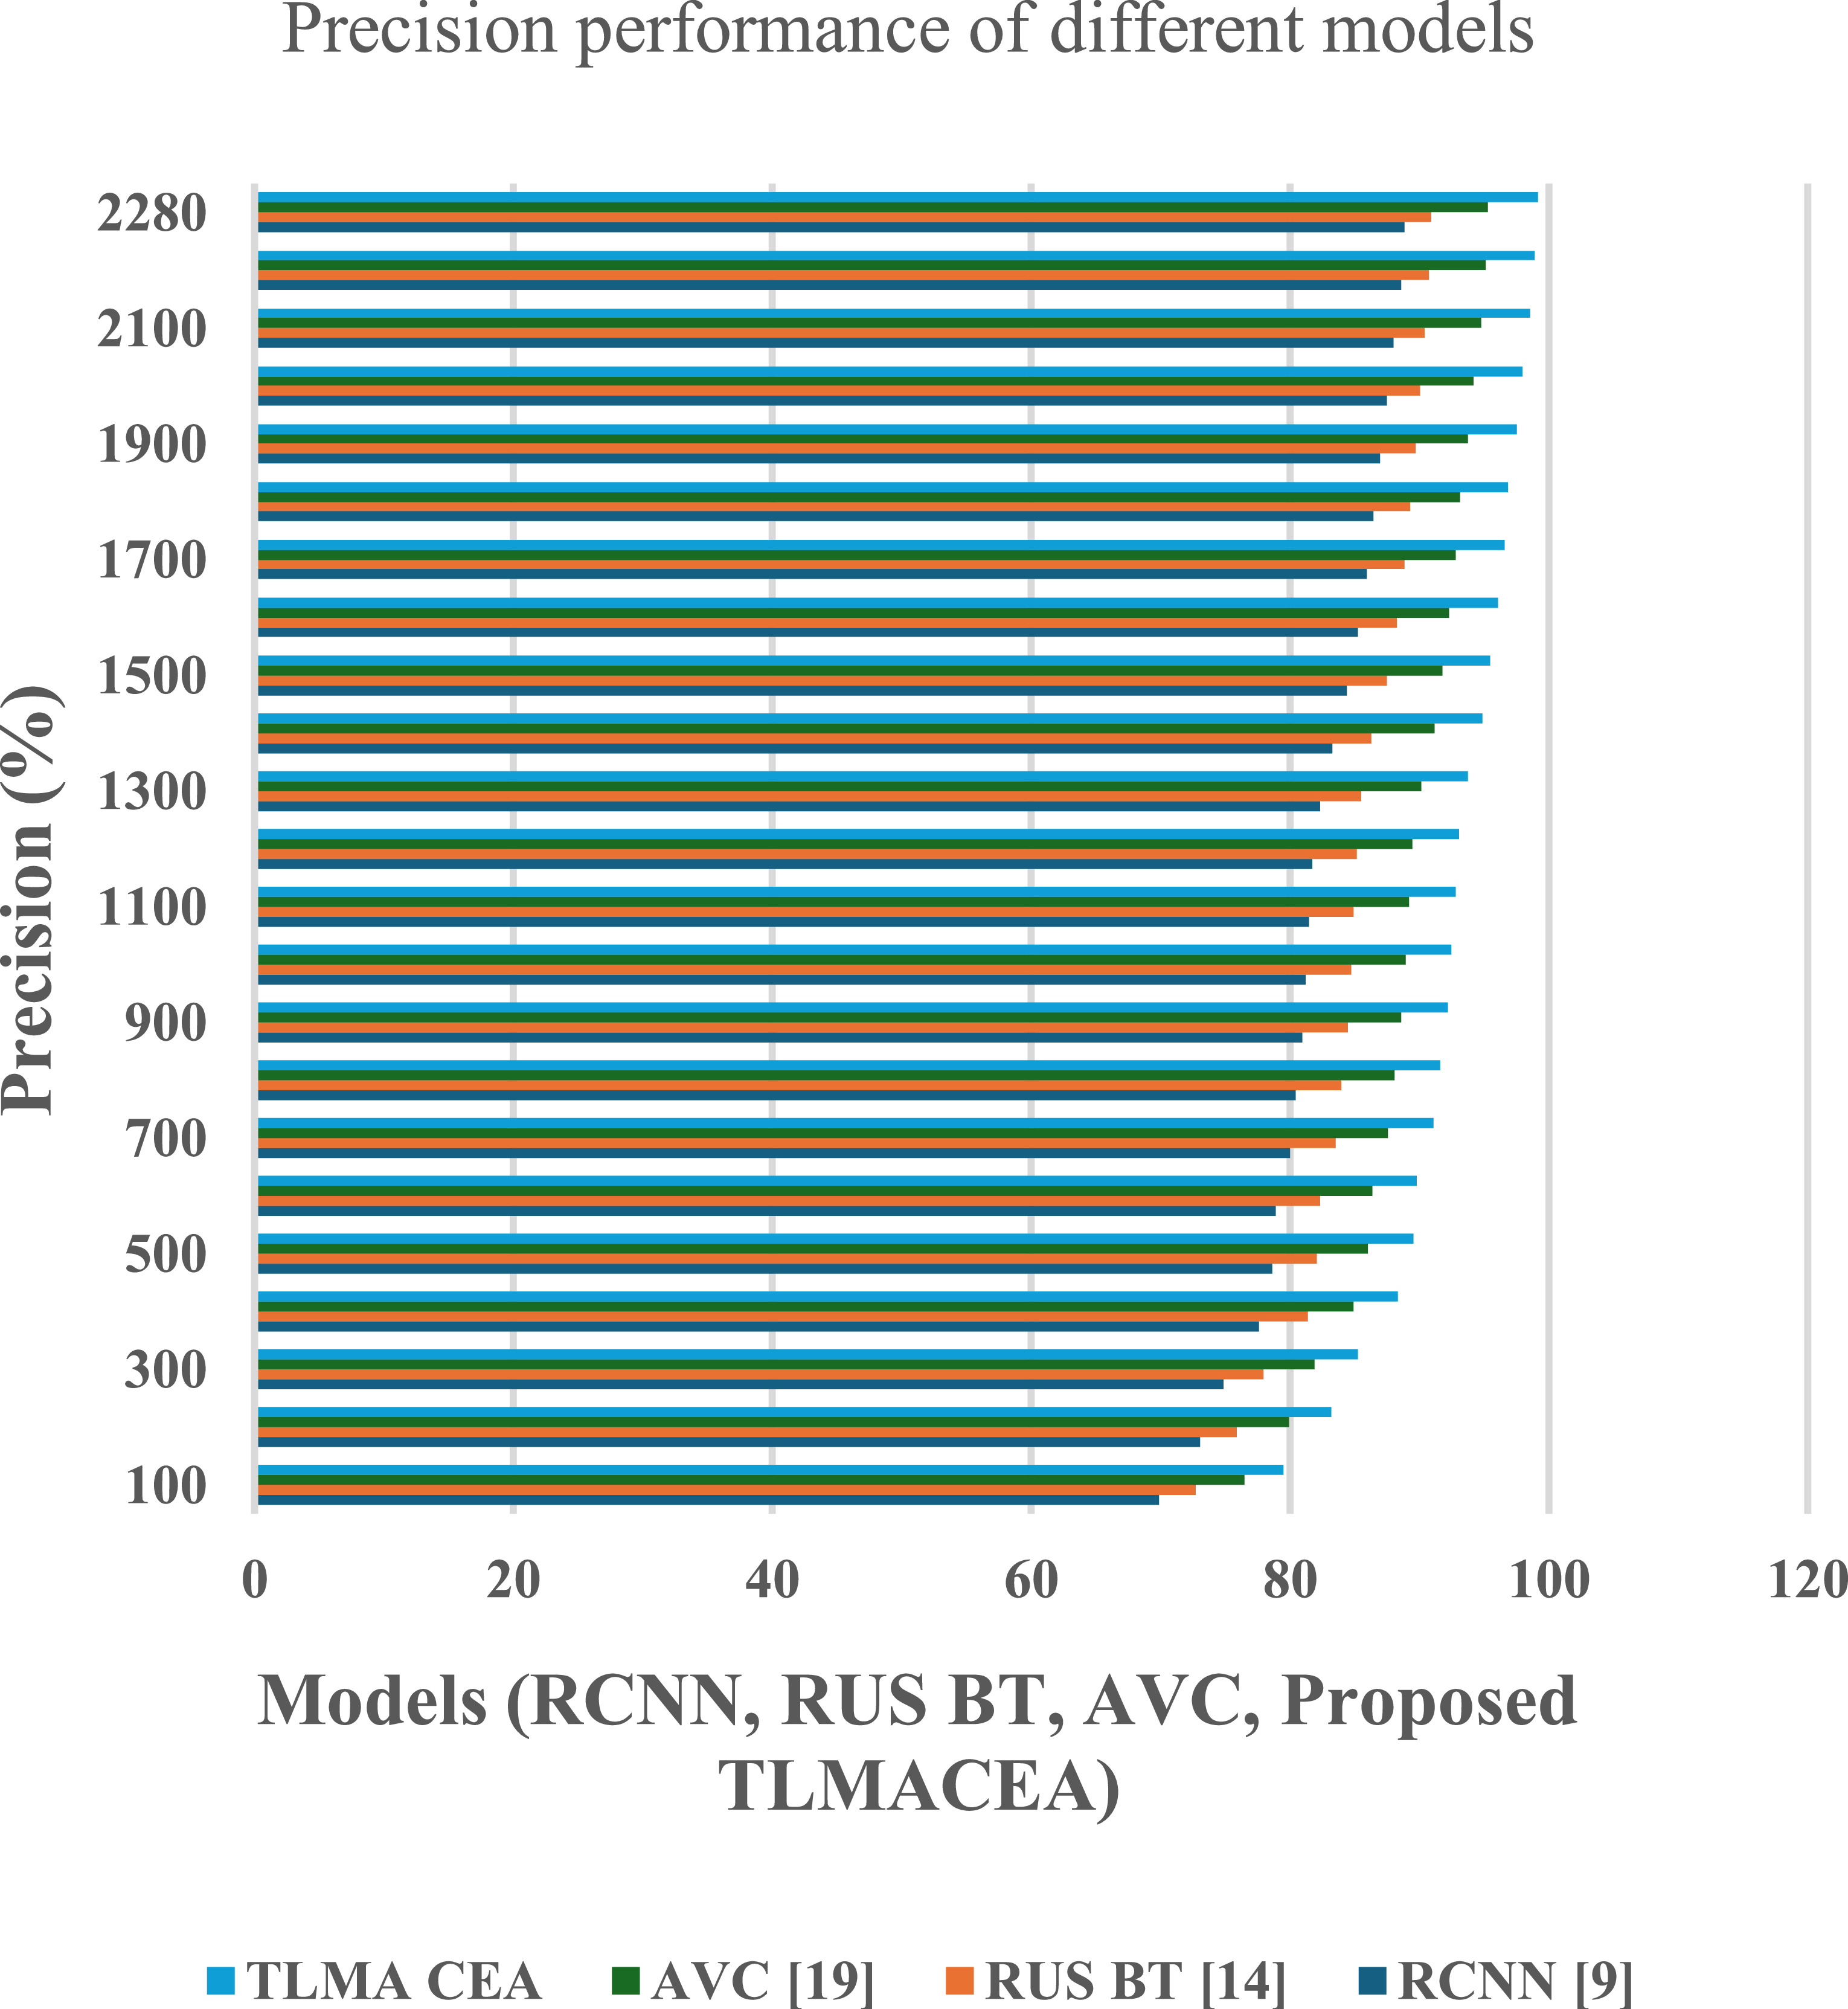
The reason for this improvement in accuracy is the combination of ensemble classifier with CNN models, which facilitates efficient feature representation, that increases classification performance. Similarly, precision performance of the proposed model is tabulated in figure 5
Figure 5. Precision performance comparison of different models (RCNN, RUS BT, AVC, and the proposed TLMACEA). X-axis: Models; Y-axis: Precision (%).
Download figure:
Standard image High-resolution imageBased on this evaluation and figure 5, it can be observed that the proposed model is 10.2% precise than RCNN [9], 8.3% precise than RUS BT [14], and 3.5% precise than AVC [19], which makes it highly useful for a wide variety of clinical applications.
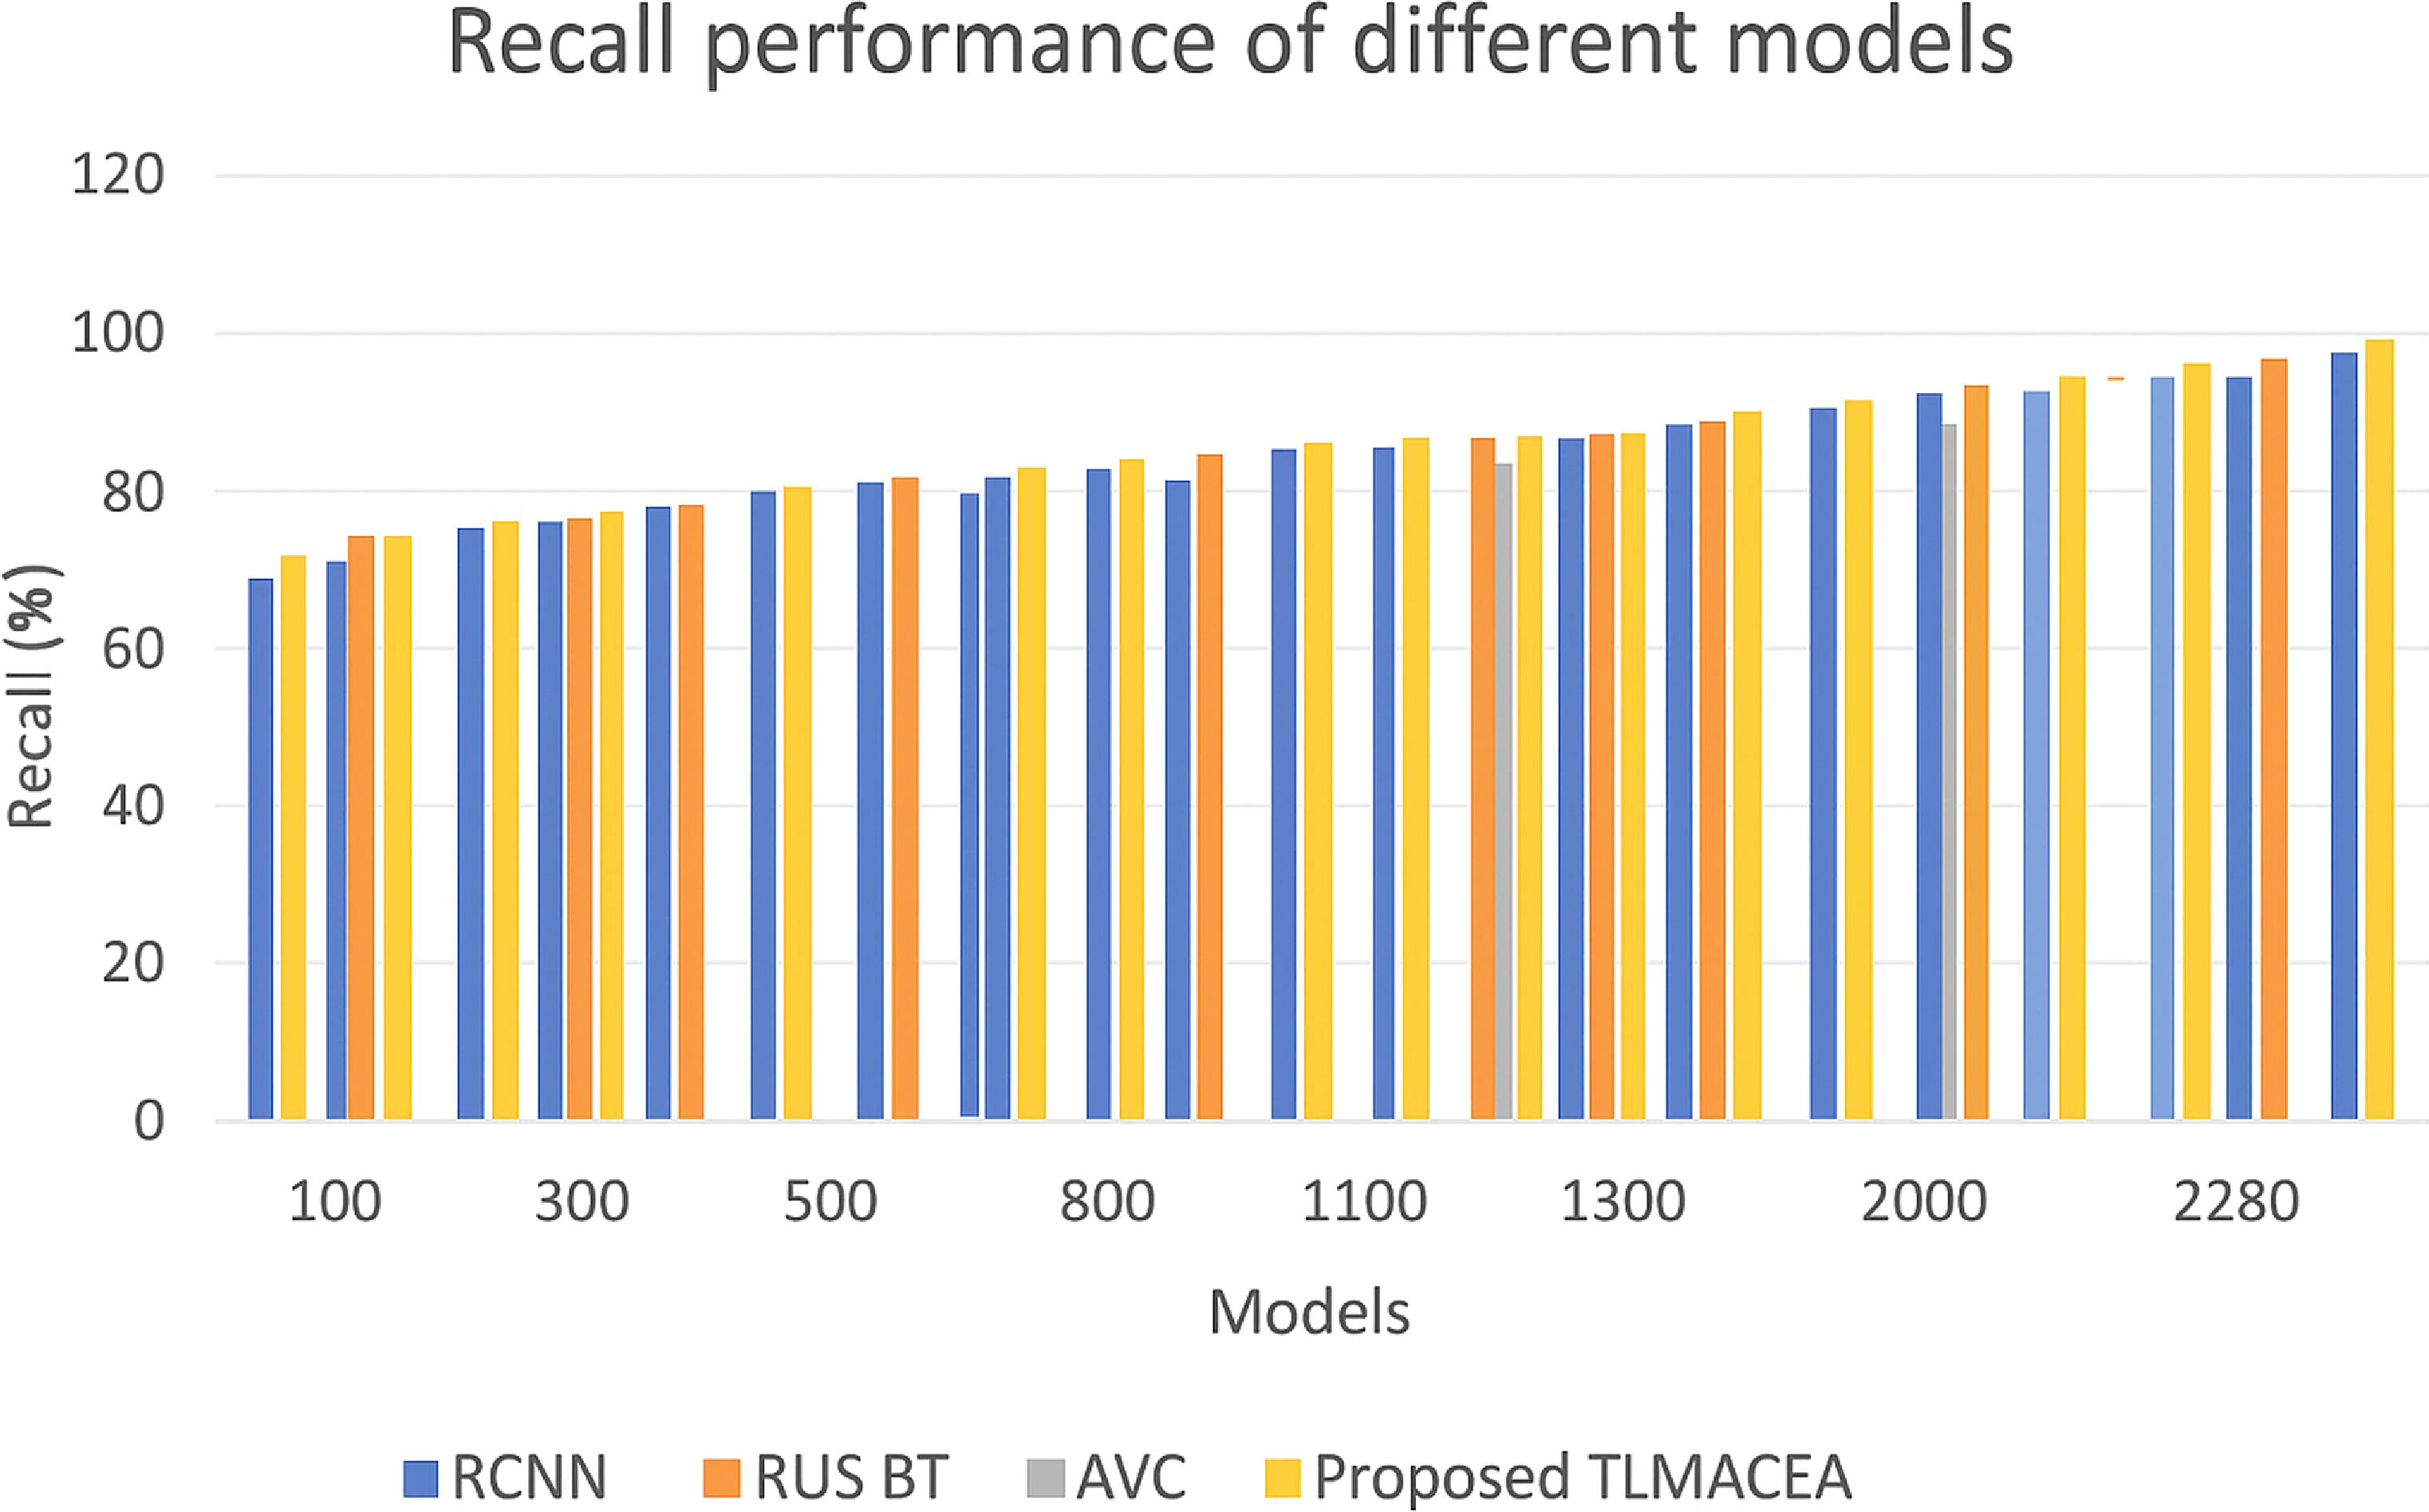
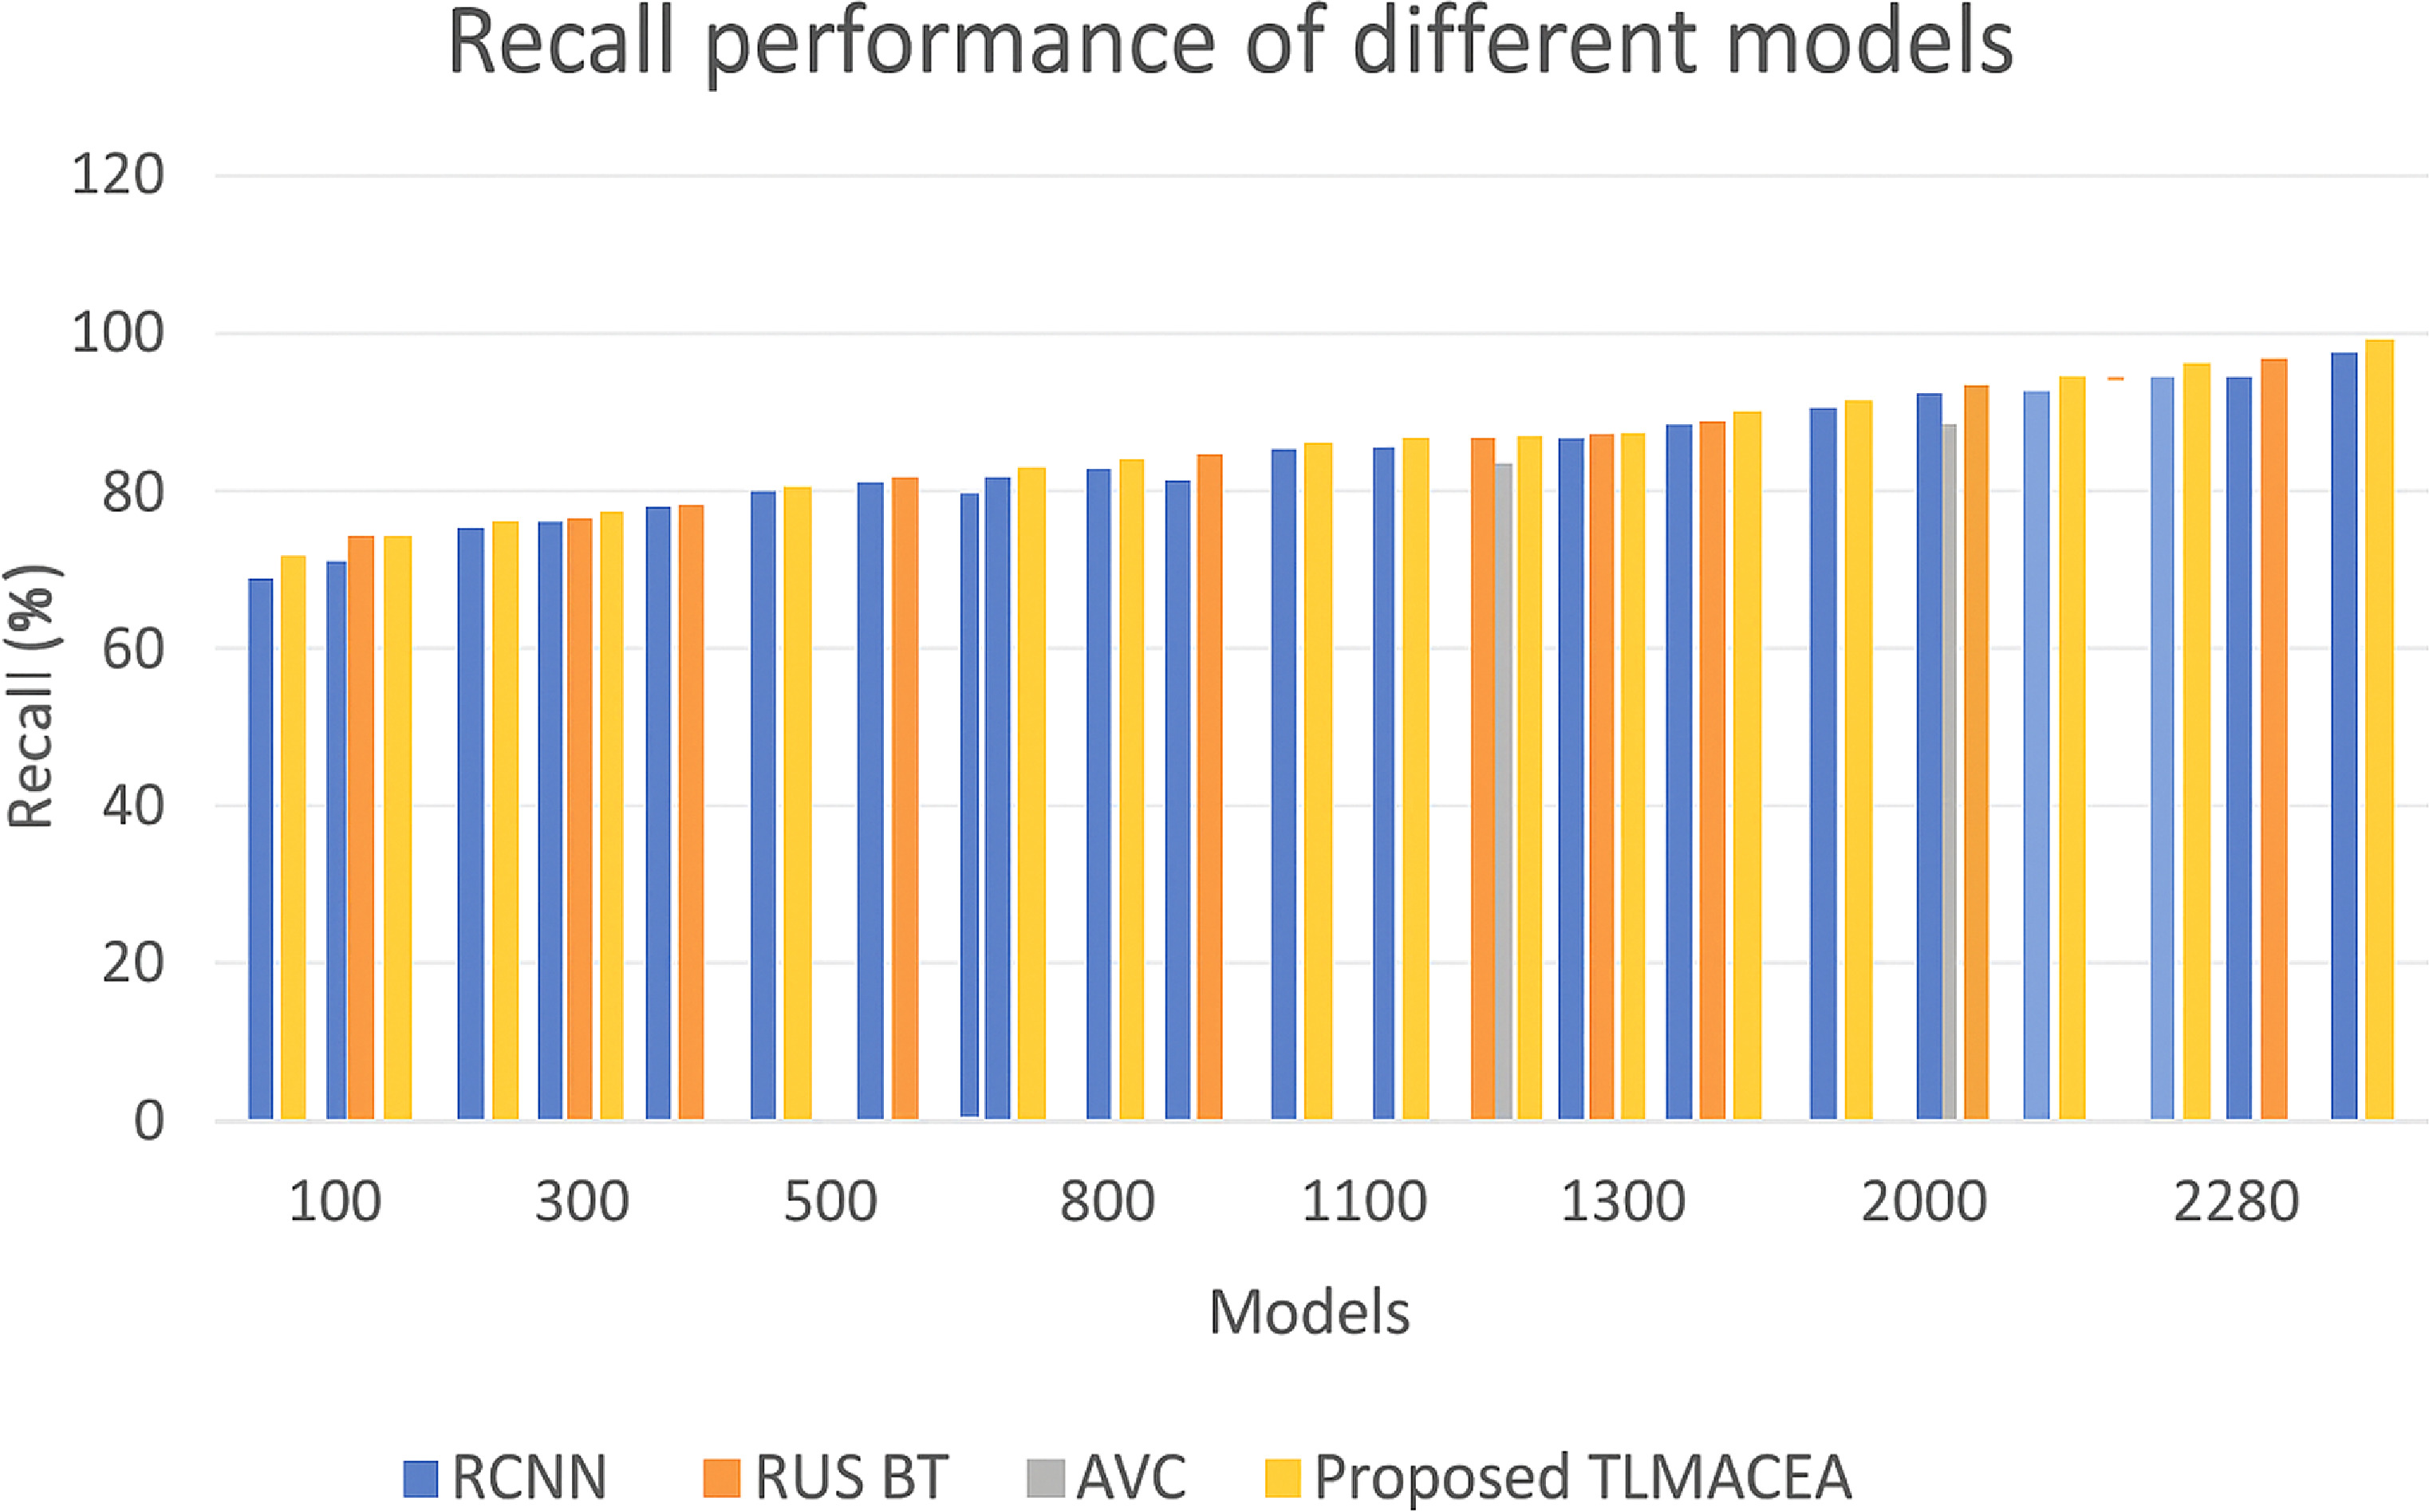
The reason for this improvement in precision is the use of a variance-based feature selection model, which assists in enhancing the classifier’s ability to differentiate between different lung states, thus increasing classification performance. Similarly, the recall performance of the proposed model is tabulated in figure 6 as follows,
Figure 6. Recall performance comparison of different models (RCNN, RUS BT, AVC, and the proposed TLMACEA). X-axis: Models; Y-axis: Recall (%).
Download figure:
Standard image High-resolution imageFigure 6 Recall performance for different models. Based on this evaluation and figure 6, it can be observed that the proposed model has 6.2% more recall than RCNN [9], 4.6% more recall than RUS BT [14], and 0.4% more recall than AVC [19], which is highly beneficial for a variety of clinical applications.
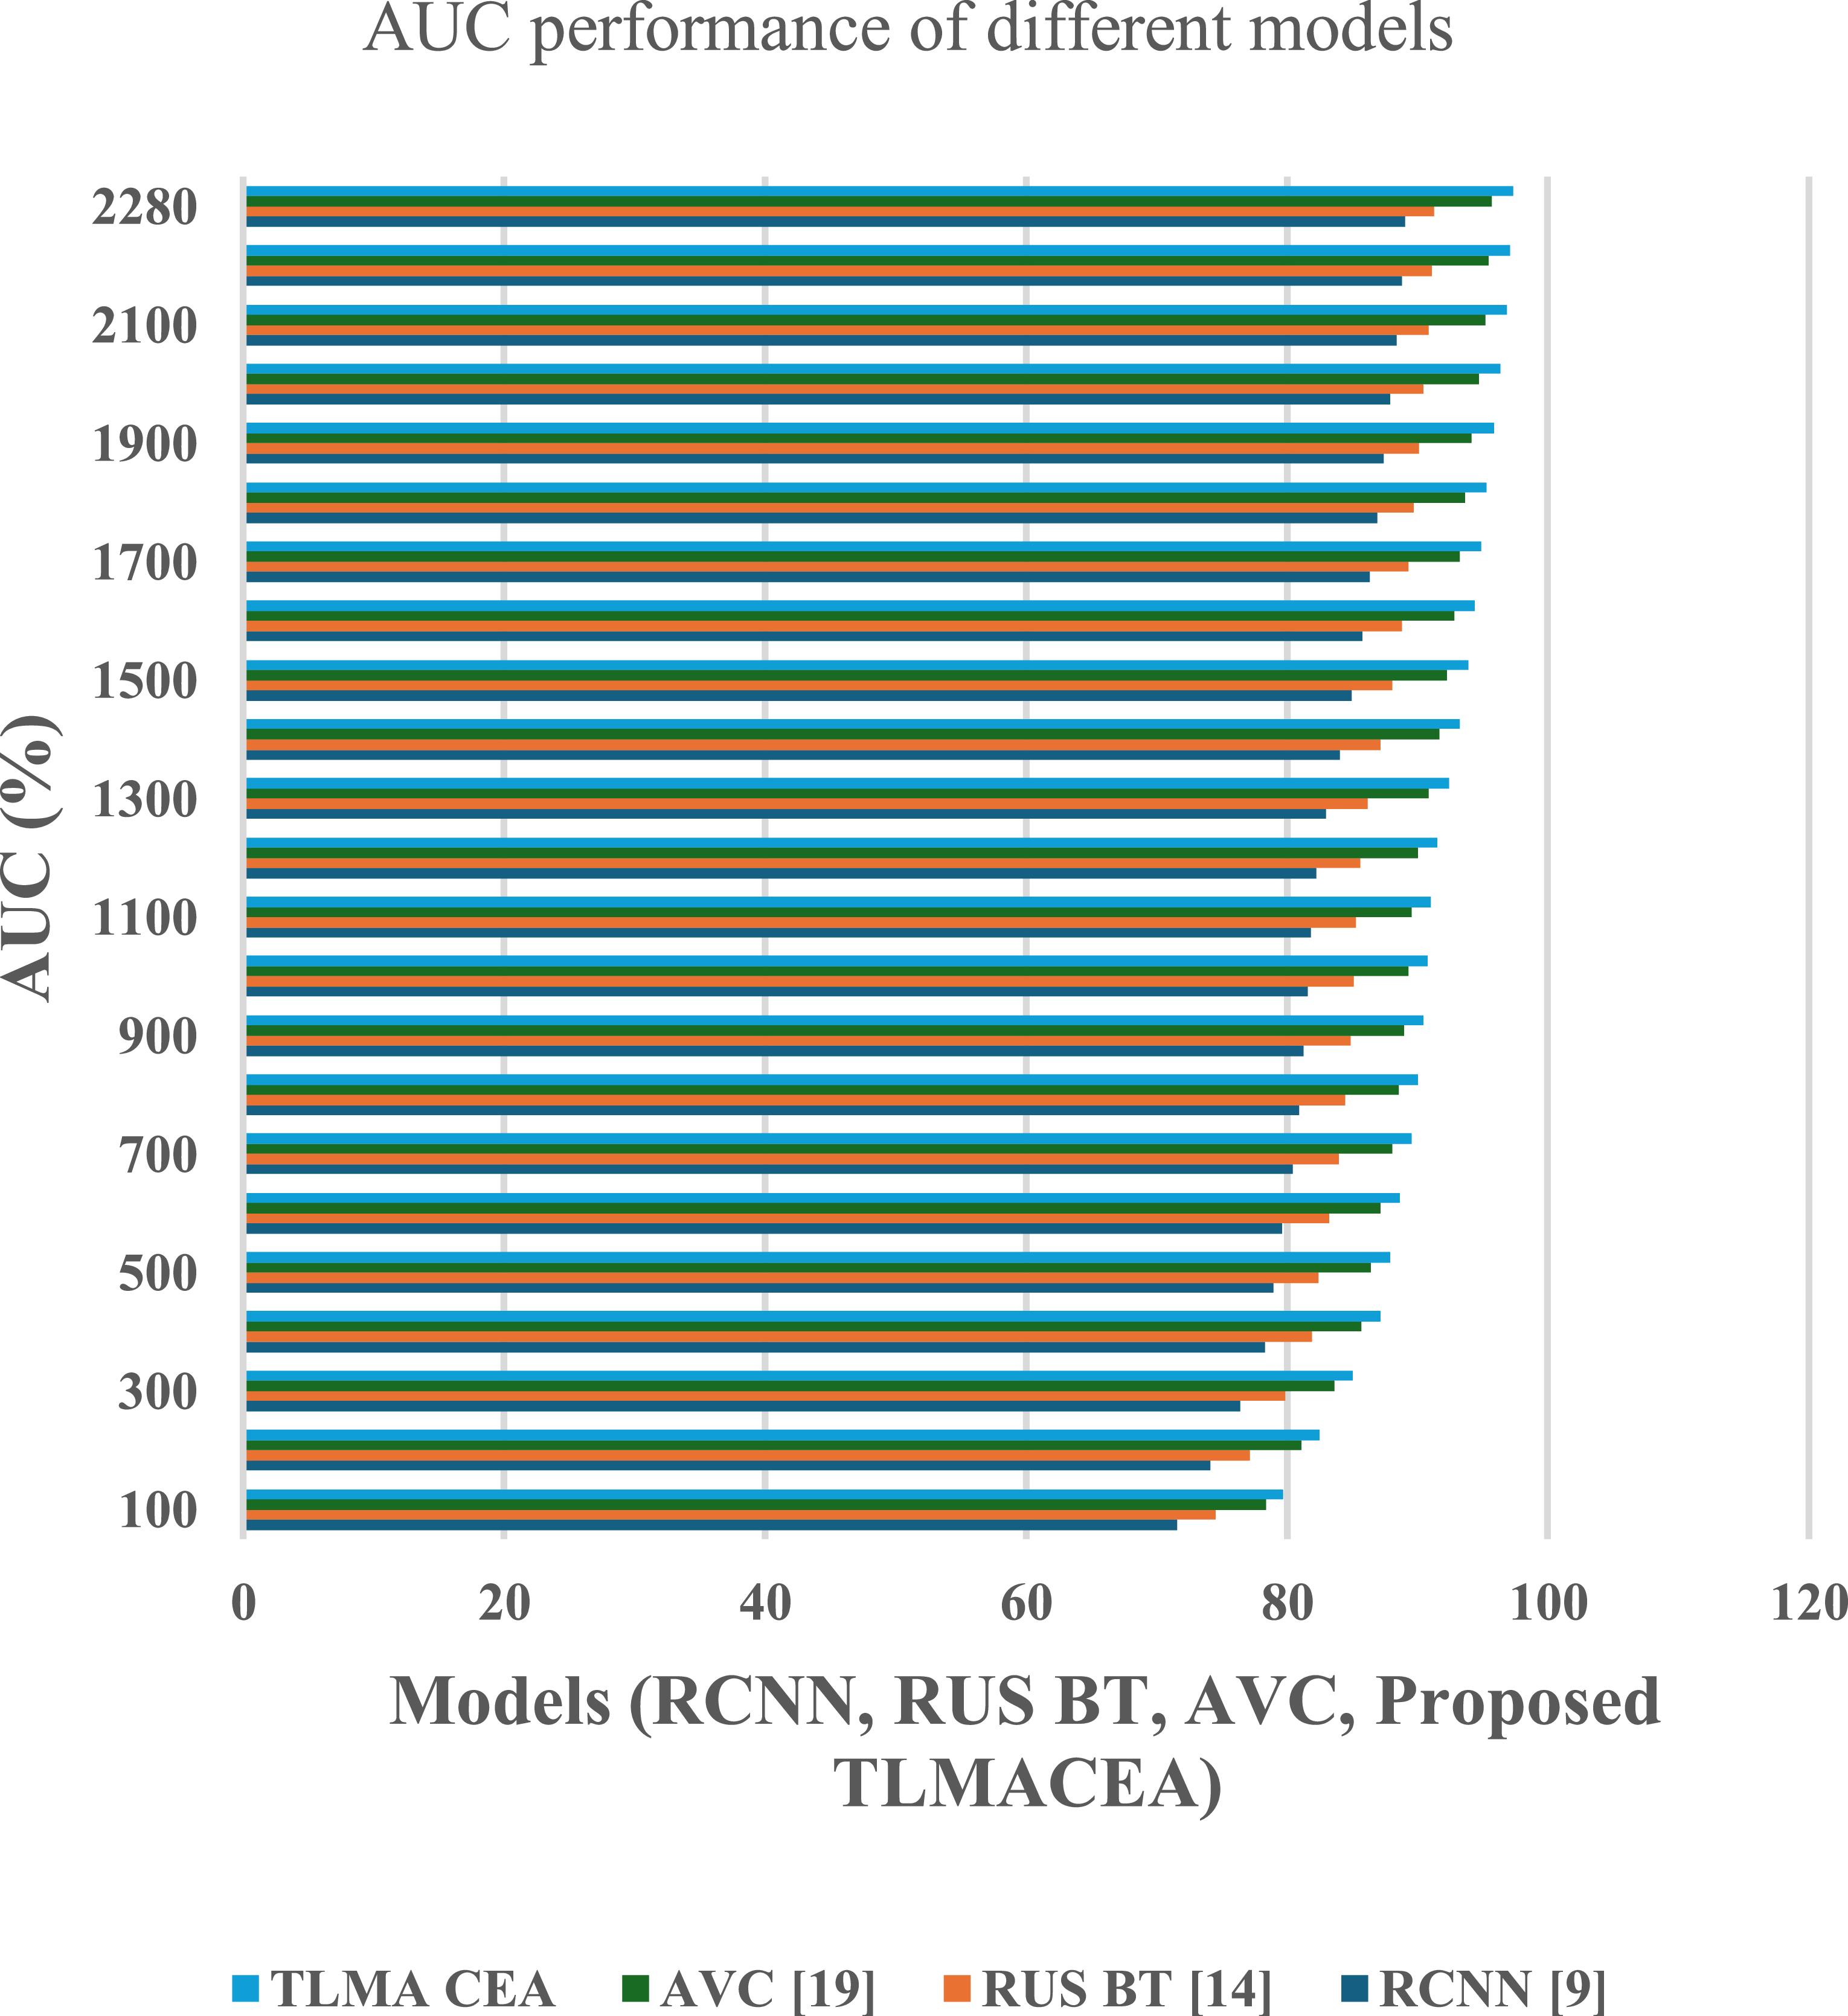
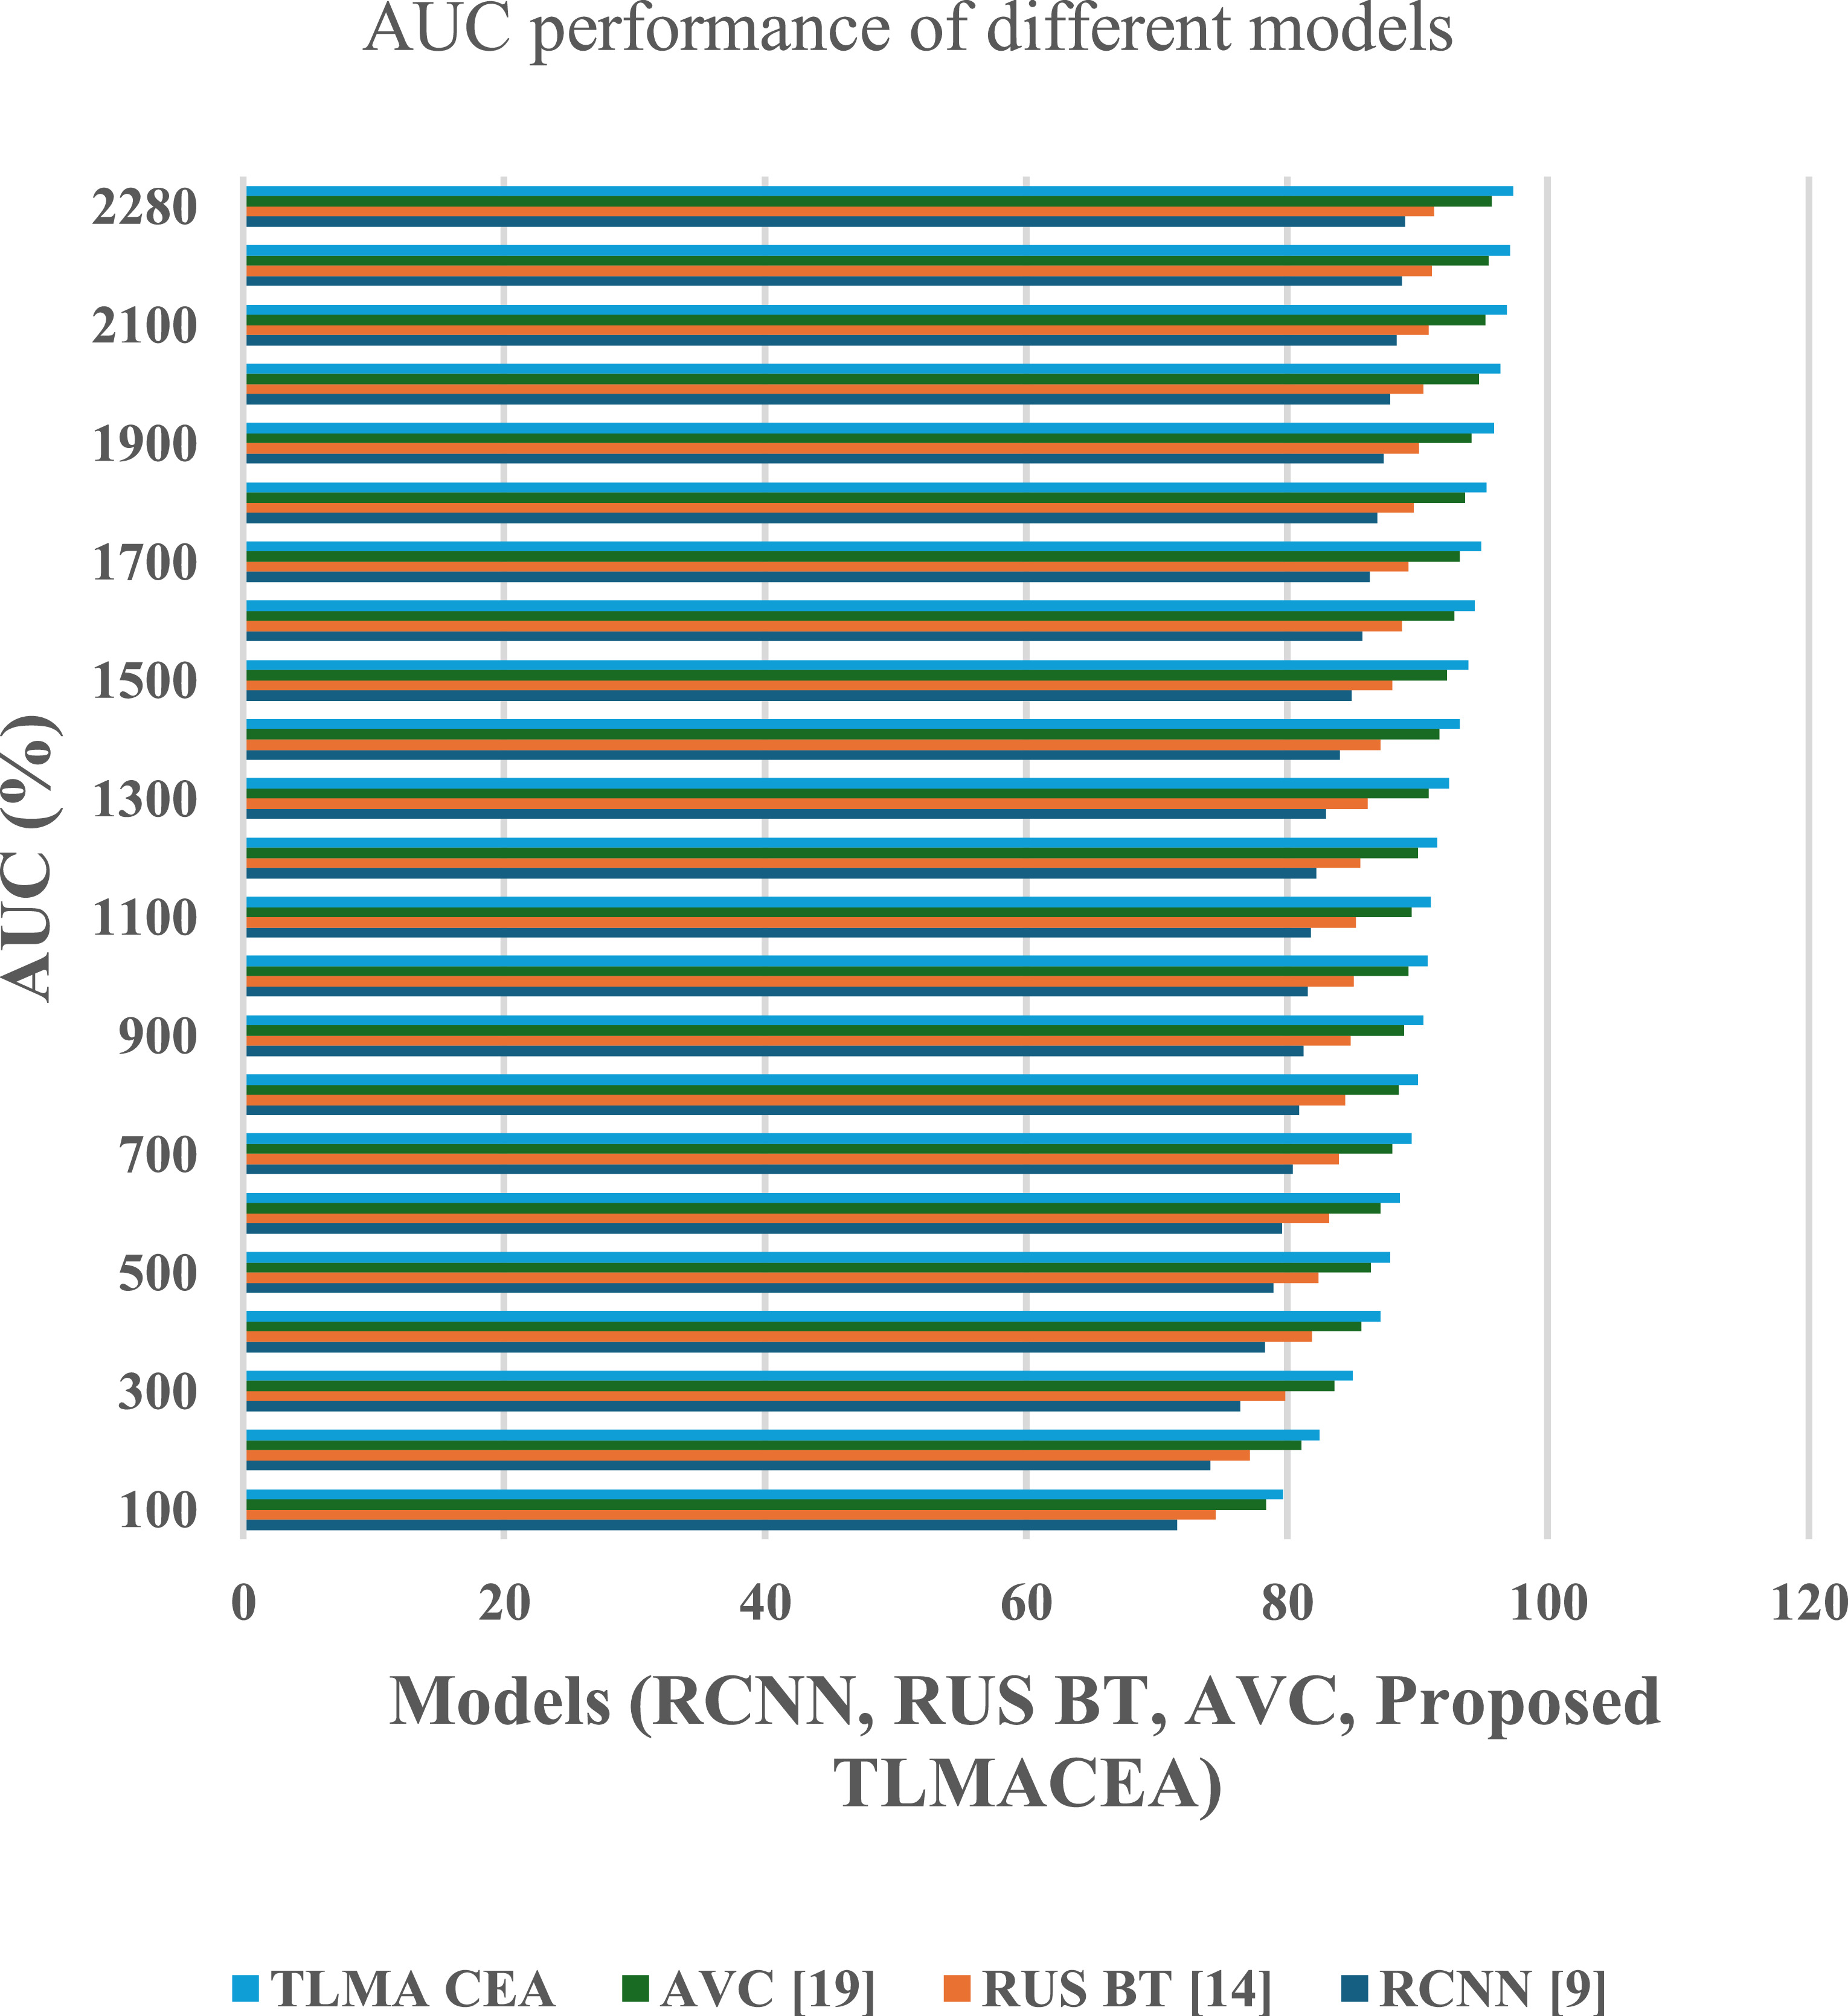
The reason for this improvement in recall is the combination of high efficiency classification models with feature variance maximization, which facilitates efficient feature representation, that increases classification performance. Similarly, AUC performance of the proposed model is tabulated in figure 7 as follows,
Figure 7. AUC (Area Under Curve) performance comparison of different models (RCNN, RUS BT, AVC, and the proposed TLMACEA). X-axis: Models; Y-axis: AUC (%).
Download figure:
Standard image High-resolution imageBased on this evaluation and figure 7, it can be observed that the proposed model has 8.3% more AUC than RCNN [9], 6.1% more AUC than RUS BT [14], and 1.9% more AUC than AVC [19], which is highly beneficial for a variety of clinical applications.
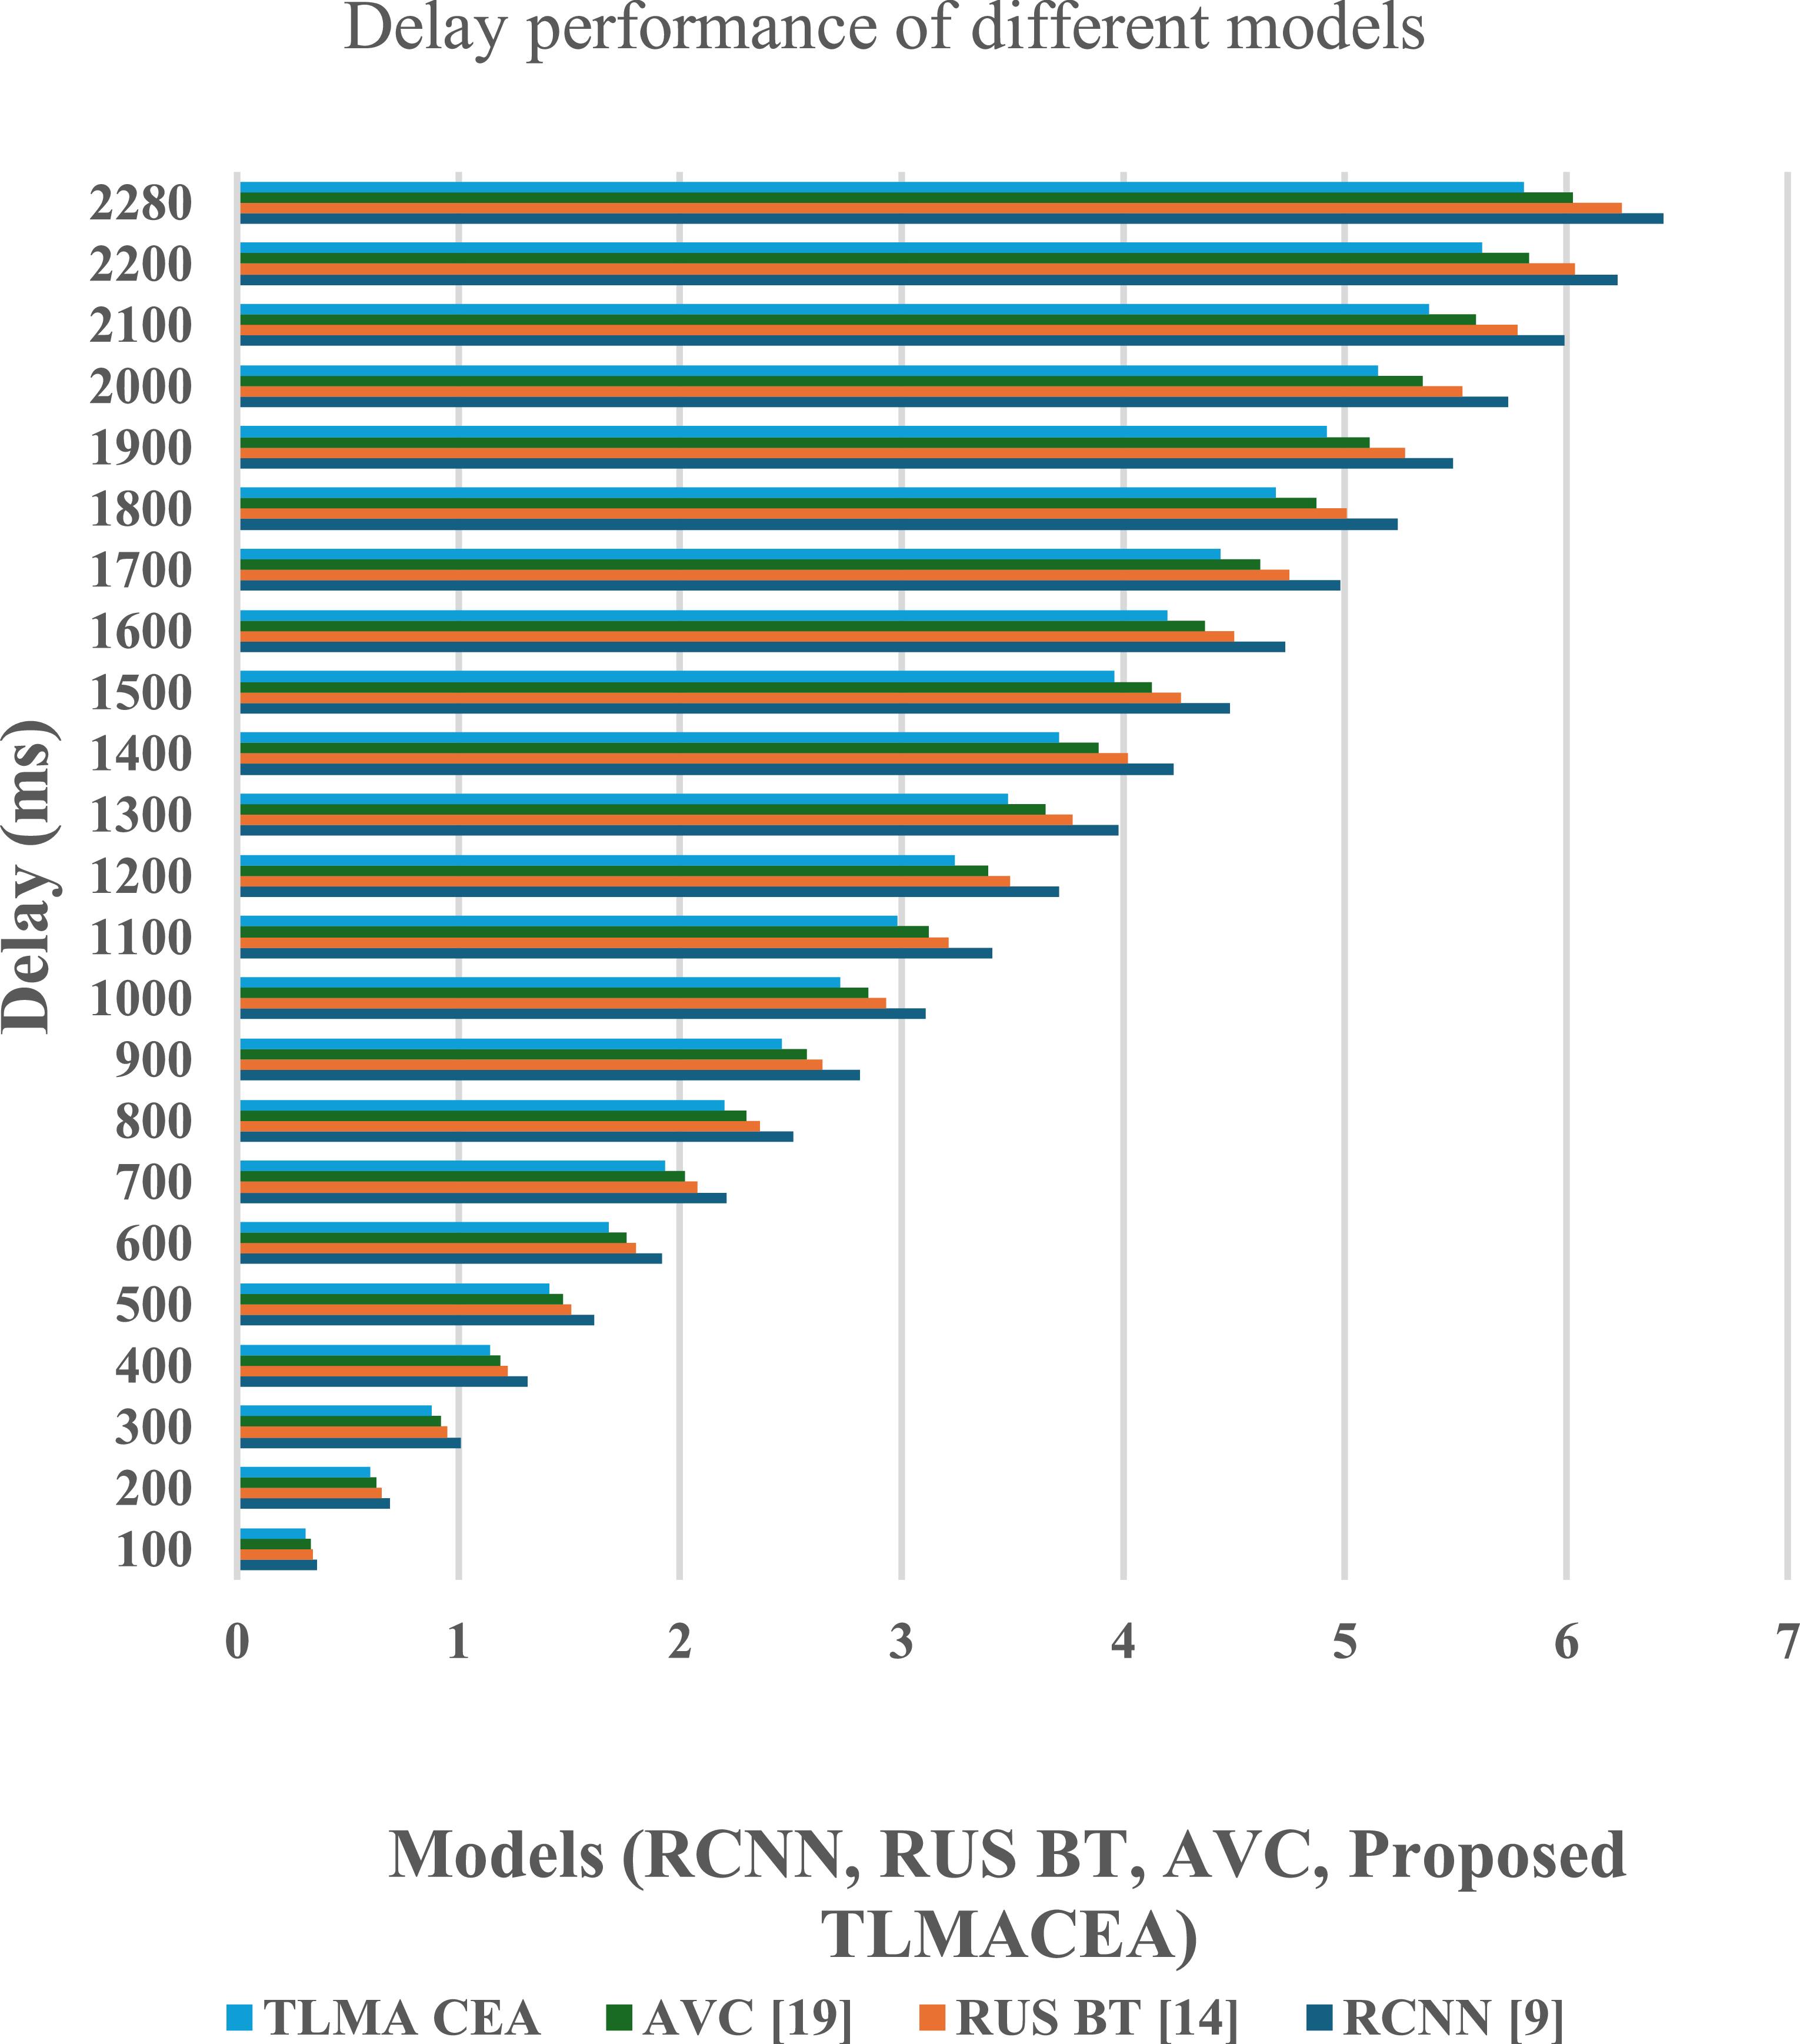
The reason for this improvement in AUC is the combination of ensemble classifier with CNN models, which facilitates efficient feature representation, that increases classification performance. Similarly, classification delay performance of the proposed model is tabulated figure 8 as follows,
Figure 8. Classification delay performance comparison of different models (RCNN, RUS BT, AVC, and the proposed TLMACEA). X-axis: Models; Y-axis: Delay (ms).
Download figure:
Standard image High-resolution image
Comments (0)