Coefficient of Variation-Based Measurement Uncertainty: Is it Normally Distributed?
Purpose
This study aimed to empirically evaluate the normality of internal quality control (IQC) data used for coefficient of variation (CV%)-based measurement uncertainty (MU) estimation in clinical laboratories.
Methods
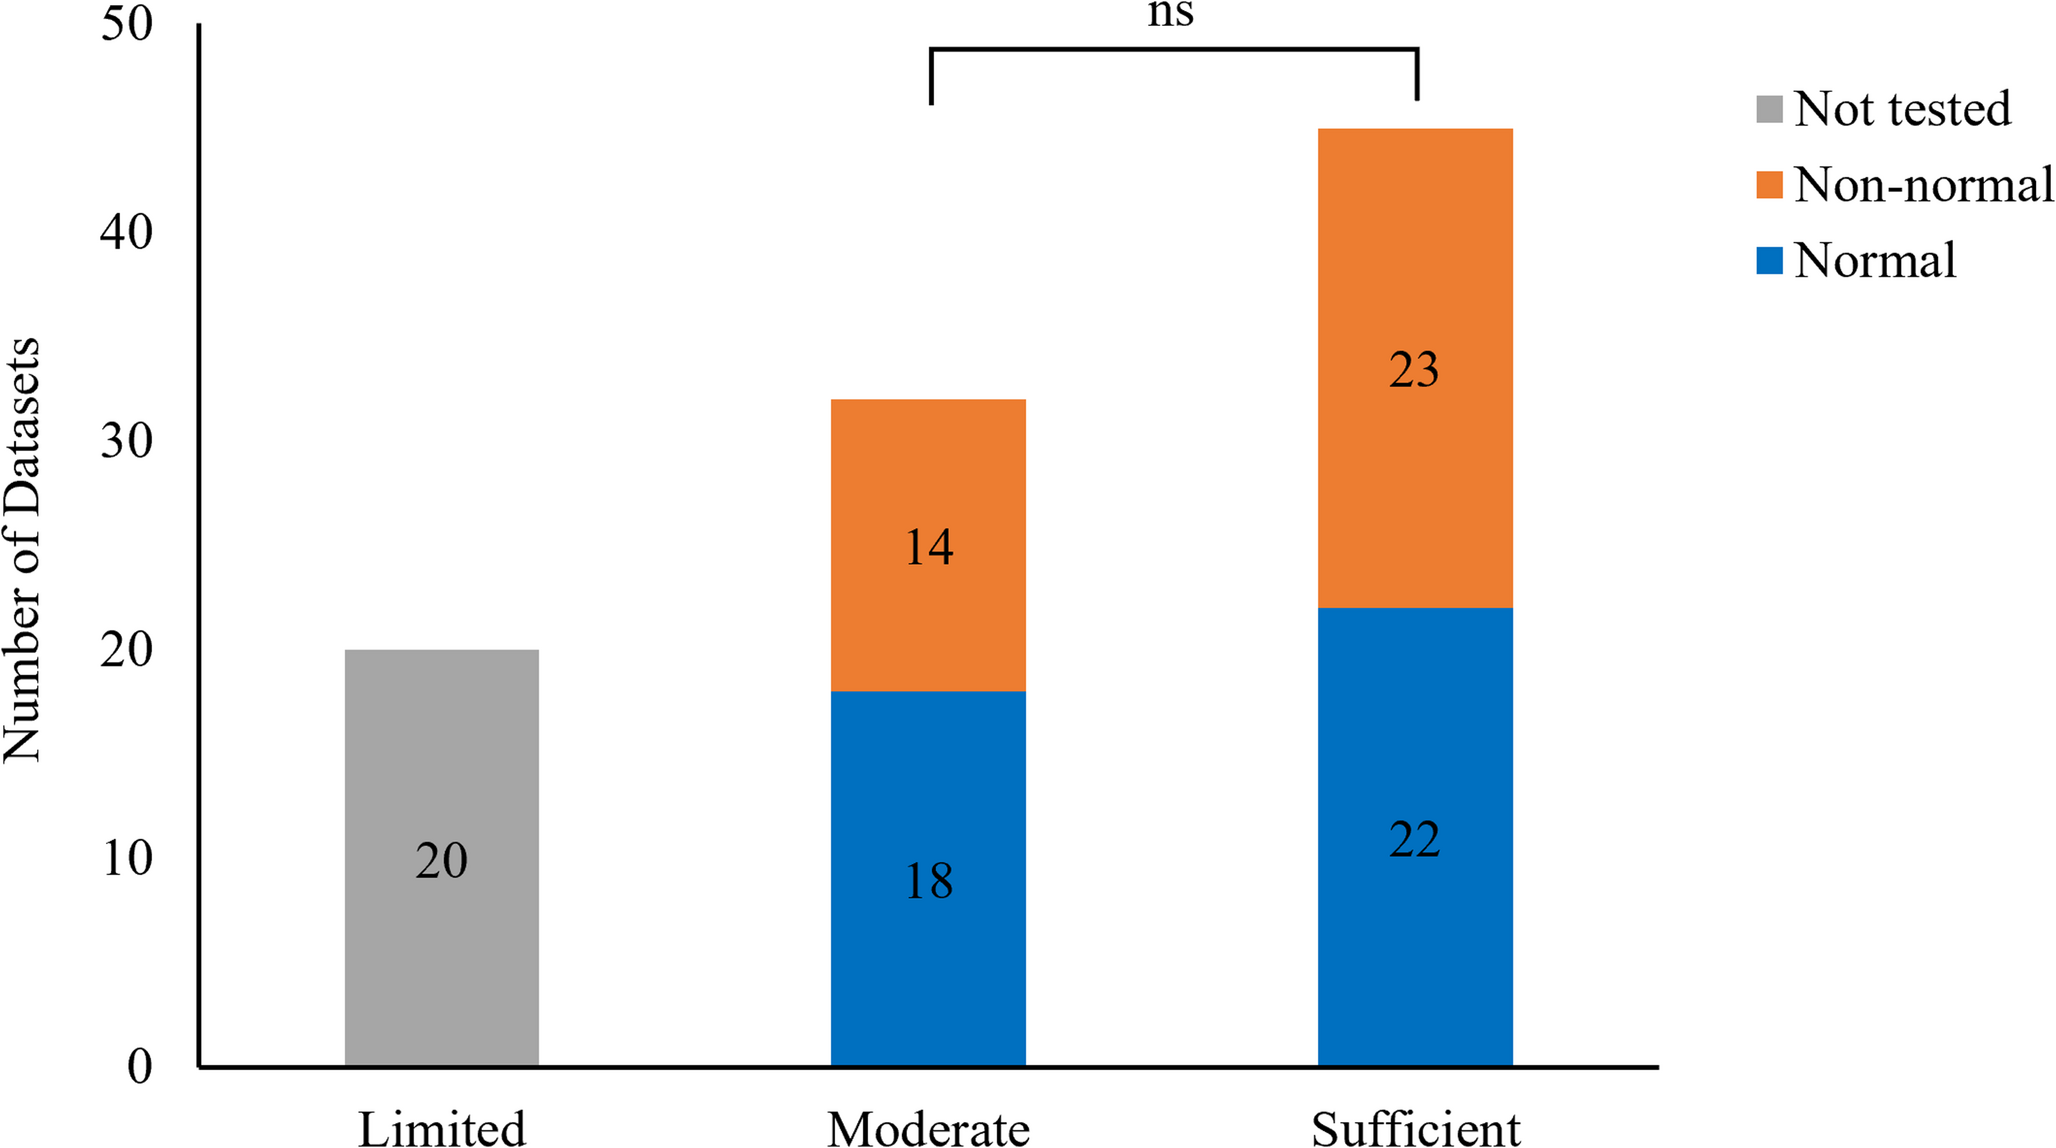
IQC data from 44 nuclear medicine assays were retrospectively analyzed. Ninety-seven analyte–control datasets were classified by replicate count as limited (< 15), moderate (15–29), or sufficient (≥ 30). Normality was assessed using the Shapiro–Wilk test (α = 0.05) for datasets with at least 15 replicates, supported by Q–Q plots and histograms. Subgroup comparisons between moderate and sufficient groups were conducted using Fisher’s exact and Pearson’s chi-square tests. The relationship between precision and normality was evaluated by comparing CV% between Shapiro–Wilk pass and fail groups using the Mann–Whitney U test.
Results
Of 97 datasets, 20 were limited, 32 moderate, and 45 sufficient. Normality testing was performed on 77 datasets with ≥ 15 replicates; 51.9% passed the Shapiro–Wilk test, while 48.1% failed. Pass rates did not differ between the moderate and sufficient groups (p = 0.64), and CV% showed no significant difference between normal and non-normal datasets (p = 0.219).
Conclusion
Nearly half of IQC datasets failed to meet normality even with sufficient replicates, and CV% was not associated with distributional behavior. Therefore, CV% alone should not justify Type A MU without verifying normality. When normality is not established, a rectangular distribution may provide a conservative alternative, thereby improving the reliability of MU estimates and support safer, more accurate clinical decision-making.


Comments (0)