General considerations and detection rates
The MA pathway is an important detoxification mechanism in the body that results in the excretion of the corresponding VOC metabolites in urine [13]. In general, the correlation between the different MAs was moderate to weak with high significance (p < 0.001). This suggests different exposure sources such as diet, tobacco smoke, or ambient air. Comprehensive biomonitoring data related to VOC exposure in larger European cohorts are scarce. PhMA and 2CaEMA/2CaHEMA are the only MAs for which HBM data in a population-representative sample in Germany have been assessed so far in children within GerES V [23]. PhMA averaged 0.097 µg/L (GM) with 95th percentile (P95) of 0.41 µg/L which is slightly below the mean PhMA concentration in our study of 0.124 µg/L with a comparable P95 of 0.42 µg/L, despite the far lower proportion of smokers in GerES V (2%) compared to the current HBM assessment in ESB samples (21%). This indicates the importance of other sources than smoking, like oil heating and air traffic pollution which were positively correlated with PhMA [23]. An HBM study conducted in Italy in 2013–2014 (adults aged 35–69; N = 1076) reported similar PhMA concentrations of 0.139 µg/g creatinine (GM of 0.167 µg/g creatinine in our study) [24]. Acrylamide exposure was around 2.5-times higher in GerES V with 72.6 µg/L 2CaEMA and 15.0 µg/L 2CaHEMA. Consumption of fried food was identified as the major contributor to elevated 2CaEMA concentrations besides smoking. In contrast, comparable levels were found in 20-40 year old adults in Poland (median 2CaEMA: 20.9 µg/L vs 28.5 µg/L; median 2CaHEMA: 8.6 µg/L vs 5.95 µg/L) at a similar proportion of smokers of 16% compared to our study [25].
Given the data gap in Germany and Europe in general related to VOC exposure in adults, the following discussion will refer to data from the NHANES study of the adult (20+ years) U.S. population covering the years 2005 to 2018 [14].
In total, 14 out of 18 MAs were found at very high detection rates of 95% and more, proving their applicability in the HBM of VOCs and providing the first baseline concentration levels for a large number of MAs in non-occupationally exposed young adults in Germany. For BzMA, 3HPMA and 34HBMA, the median concentrations are comparable with NHANES data for the respective time span (Table 4). In contrast, 2CyEMA, 3HMPMA, 2CaEMA, MCaMA, and 2HPMA, appear to be less concentrated in the ESB samples. We confirmed this observation using creatinine-normalized values (data not shown) to rule out dilution effects as a cause for these differences. However, the comparability may be limited owing the difference in the study populations, where NHANES is population-representative in contrast to the 24-h urine samples from 20- to 29-year-old students in the ESB. Some MAs (2HEMA, PhMA, 2CaHEMA) were not detectable in NHANES, which reported LODs above the median concentrations found in the ESB samples. Obviously, a higher sensitivity is required for an HBM in the general population, which may be compromised in the analysis applied by the CDC in favor of a broader range of analytes. For comparison, our analysis comprises 18 MAs measured by two separate methods, while the HBM program for VOCs in NHANES determines 28 urinary VOC metabolites in one run [21].
Table 4 Comparison of the median concentrations in our study versus NHANES (µg/L).Focusing on behavioral aspects, smokers had higher levels of 5 MAs compared to non-smokers deriving from acrylonitrile (2CyEMA), ethylating agents (EMA), benzene (PhMA), and acrylamide (2CaEMA/2CaHEMA). These differences have been reported previously by several groups [16, 21, 26,27,28]. In addition, the US Population Assessment of Tobacco and Health (PATH), the most comprehensive population-based longitudinal study of tobacco use worldwide, confirmed our findings for the respective MAs [21, 29]. Yet, several MAs such as 2-HPMA, 3-HPMA, or MCaMA did not show a significant difference in our study, which is in contrast to the findings of the PATH and other studies [21, 29, 30]. The low number of 77 smokers and the concise classification by self-report (yes/no) and cotinine levels without detailed stratification by cigarettes per day or smoking history for the ESB samples may result in the misclassification. This applies in particular to vapers or users of other nicotine products, who have high cotinine levels but no pronounced exposure to the precursors of the respective tobacco smoke constituents propylene oxide, acrolein, or dimethylformamide. In this context it has to be noted that the discrimination between S and NS was not the primary scope in this study.
2H1PhEMA and 2H2PhEMA, both biomarkers of styrene exposure, were rarely detected, which is consistent with NHANES study data in the U.S. population [14]. This indicates the need for alternative biomarkers to monitor styrene exposure. While both MAs are specific to styrene, they lack in sensitivity due to the low excretion rate of only 1% of the styrene dose [31]. Mandelic acid (hydroxy(phenyl)acetic acid) remains the primary choice as a more sensitive biomarker for styrene exposure, although it is less specific [32].
1,3-BD forms at least four MAs [33], with 2HBeMA and 34HBMA being most frequently applied in biomonitoring studies [34]. In contrast, 1HMPeMA is a minor metabolite not detectable in the general population as shown in the present study and in NHANES [14]. Only one study has measured 1,3-BD exposure on a population-representative scale in 5897 subjects for NHANES cycles between 2011 and 2016 and reported 34HBMA (25th to 75th percentile (P25-P75): 211–465 µg/g creatinine) in more than 96% and 2HBeMA in 9.8% of the samples, respectively [35]. Our study had somewhat higher detection rates for 34HBMA (100%) and 2HBeMA (32%) with a comparable concentration range of 380-564 µg/g creatinine for 34HBMA (P25-P75).
Sex-specific differences in MA excretion
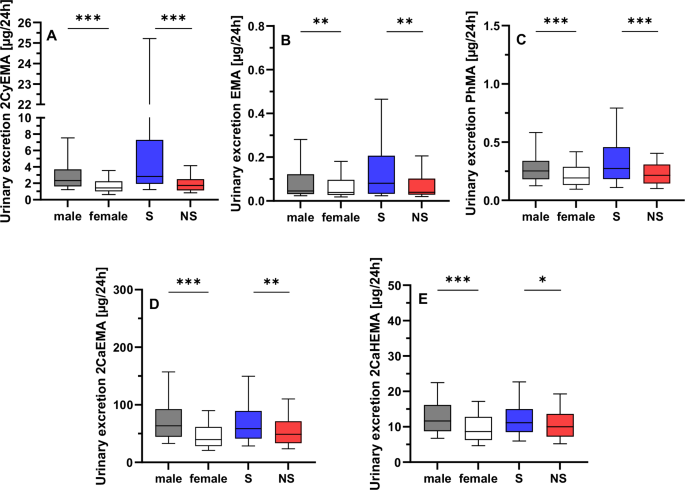
The main aim of the study was to decipher potential differences between sexes and the overall exposure over time. Males had higher urinary excretions for 10 of the 18 MAs which are related to the exposure to acrylonitrile (2CyEMA), crotonaldehyde (2CoMEMA/3HMPMA), ethylating agents (EMA), benzene (PhMA), acrylamide (2CaEMA/2CaHEMA), 1,3-BD (34HBMA), propylene oxide (2HPMA), and acrolein (3HPMA). Interestingly, MMA was the only analyte with significantly higher levels in females while EMA follows the trend found for the 9 MAs listed above. The assessment of MMA and EMA has not been reported in large scale studies so far. MMA and EMA are indicative of the exposure to toxic methylating and ethylating agents such as N-nitrosodimethylamine, N-nitrosodiethylamine, methyl chloride or ethyl chloride [36].
The comparison of urinary VOC metabolites between males and females has been previously reported in only two larger studies, both evaluating the data from the US NHANES 2011/2012 cycle, albeit in different subpopulations [37, 38]. Jain (2015) compared the adjusted GMs separated by sex and smoking status [37] while Mendy et al. (2022) used the creatinine-normalized values in a subset for which spirometry data were available [38]. Mendy et al. (2022) reported elevated levels of 3HMPMA and 2HPMA in females, which contradicts to our findings. In contrast, Jain (2015) found higher 3HPMA concentrations in female non-smokers in agreement with our results. However, the evaluation by Jain did not observe any sex-specific differences in non-smokers for 1,3-BD and crotonaldehyde. Hartmann et al. (2008) identified differences in 2CaEMA and 2CaHEMA with 1.5-fold higher urinary concentrations in men, similar to our study (1.6-fold elevation in men), while this sex difference disappeared for the creatinine-based concentrations [39]. It is important to note that women generally have lower creatinine concentrations due to differences in physiology and metabolism [40]. This would suggest that the concentration in females may be higher after normalization, even if there is no actual difference in exposure or a similar exposure, although men could be more exposed. In our study, concentrations were adjusted for the 24-h urine volume, which should not be influenced by additional factors like body weight, age, or muscle mass [41]. It is noteworthy that sex-specific differences were observed in both the complete study population as well as for the smokers and non-smokers individually. Variations in VOC exposures have been discussed in relation to the physiological differences between sexes in terms of absorption, deposition, and metabolism (ADME) of environmental chemicals [42]. For instance, sex hormones can influence GI tract motility, potentially leading to the accumulation of the ingested chemicals before excretion, which is especially pertinent for VOCs absorbed through dietary intake [43]. Regarding inhalation, which is the primary route of exposure for most VOCs, differences in ventilation capacity, tidal volumes, and lung size may result in varying uptakes between sexes [42]. However, it is likely that other exogenous sources, in addition to active smoking of combustible cigarettes and/or differences in the ADME of VOCs, likely contribute to the observed differences. For instance, diet significantly contributes to acrylamide exposure as reflected by higher CaEMA/CaHEMA levels after consumption of fried potatoes [44]. Moreover, various fruits contain crotonaldehyde and their consumption was linked to elevated 3HMPMA levels [45]. For most VOCs, their primary source can be attributed to the ubiquitous presence in ambient air, stemming from industrial and traffic emissions. Disparities in exposure may be linked to differences in occupational settings or residence. However, most studies have not found a causal relationship between sex and exposure levels [23, 44]. The observed sex- and smoking-specific differences illustrate the potential of HBM data to improve our understanding of the main sources of exposure to this highly toxic class of chemicals.
Influence of different covariables on MA levels
Our multiple linear regression model included three covariables: sex, smoking status and BMI. As discussed in the previous section 4.2, sex-specific differences may be attributed to differences in the ADME of VOCs as well as lifestyle and use behavior. However, the manifold environmental sources of exposure are too heterogenous to provide a simple answer for the observed variance. One significant contributor is the BMI, which correlates with dietary habits [46]. Our study suggests that BMI is positively correlated with the excreted amounts of MA coming from acrylonitrile, crotonaldehyde, ethylene oxide, toluene, benzene, acrylamide, dimethylformamide, 1,3-butadiene, propylene oxide, and alkylating agents, in agreement with previous reports [47, 48]. A more detailed investigation regarding dietary effects in a European cohort, similar to Lei et al [47], requires a comprehensive questionnaire, as available for instance in the GerES. In general, smoking contributes to a much higher extent to the exposure to several VOCs like acrylonitrile, benzene or acrylamide with an increase in MA levels of 56%, 27%, and 17% for 2CyEMA, PhMA, and 2CaEMA, respectively.
Time trends in VOC exposure from 2000 to 2021
In the present study, a notable reduction in MA concentrations was observed from 2000 to 2021, with significant decreases for 2CyEMA (50%), EMA (50%), 2HEMA (31%), PhMA (41%), 2CaEMA (24%), 2CaHEMA (29%), MCaMA (39%), and 34HBMA (18%), irrespective of sex and smoking status. We want to draw attention to the fact that while several classes of environmental chemicals, such as metals, PFAS, phthalates and PAHs have been extensively studied in terms of changes in exposure over time [15, 49,50,51,52], the assessment of MA VOC metabolites in HBM studies in this context is still limited. Poteser et al. performed a comprehensive analysis of acrylamide HBM data across ten European countries revealing an overall increase from 2001 to 2017 followed by a decline starting in 2018 in adults [53]. Notably, benchmark levels in food were adopted in 2017 which came into effect early 2018 in Europe may have influenced this trend [53]. In contrast, our data for 2CaEMA/2CaHEMA show a different time trend with the lowest value and most significant drop in 2015 and no significant increase in the years before.
In the population-representative Canadian study (CHMS) within 6 years from 2009-2015 [54], a significant decline in PhMA (18%) was observed, similar to our findings. Moreover, a substantial decline in acrylonitrile (2CyEMA) and N,N-dimethylformamide (MCaMA) exposure was observed in an extensive evaluation of NHANES data from 2012 onwards (Table 4), which falls within the time frame of the most pronounced decline in our study [55]. With regard to the major sources and given the fact that the decrease is independent of the smoking status, a reduction in secondhand smoke exposure seems a probable cause for the observed trends. Secondhand smoke exposure has steadily decreased in Germany since 2002 as a result of smoking bans and regulations limiting secondhand smoke exposure [20]. Moreover, the exposure to polycyclic aromatic hydrocarbons showed a similar time trend, which was attributed to reduced secondhand smoke exposure and legislation that has been implemented in the EU over the past 20 years to minimize chemical emissions into the air and improve air quality [20]. Hence, besides secondhand smoke exposure, environmental air and diet may contribute to the reduced exposure to these VOCs. Yet, closing data gaps and establishing a causal relationship requires comprehensive and regular monitoring of VOCs. This emphasizes the importance of national representative surveys such as GerES to facilitate the correlation of MA levels with the participants’ habits, diet, and socioeconomic status.
Exposure assessment
Since many of the analyzed VOC metabolites have parent compounds which are carcinogens, mutagens or toxic for reproduction (see Table 1) deriving a safe level of exposure is difficult and only few health-based guidance values are available.
All urine samples in this study showed MCaMA concentrations below the HBM guidance value (HBM-GV) of 1000 µg/g creatinine [56], indicating a low health-risk from N,N-dimethylformamide exposure. For non-cancer toxicity, Hays and Aylward derived a Biomonitoring Equivalent (BE) value consistent with a health protective guidance value for the general population for 2CaEMA of 13 μg/L urine [57]. For cancer risk, they calculated a BE value for urinary 2CaEMA concentrations of 1 μg/L (for a risk of 1 × 10⁻⁴) and of 0.01 μg/L (for a risk of 1 × 10⁻⁶). Most urinary 2CaEMA concentrations found in this study (with an LLOQ of 10 µg/L for 2CaEMA; 95% > LLOQ) were higher than the BE values. Therefore, individual avoidance as well as further regulation are necessary to reduce hazardous exposure, which holds true for all VOCs.


Comments (0)