
Remember me

All patients underwent an MRI including a 3D FSE MRCP acquisition on either a 1.5-T (Avanto, Siemens) or 3-T (Vida, Siemens; or Prisma, Siemens) MRI scanner at (masked). None of the patients had received oral preparations for the MRI examination. Coronal 3D FSE MRCP thin-section source images, along with scanner-generated 3D maximum-intensity-projection (MIP) thick-slab images, were archived on the PACS system. The 3D FSE MRCP sequence details are presented in Table 1.
Table 1 Parameters for 3D fast Spin-Echo MRCP acquisitionRespiratory movement reduces MRCP image quality by increasing noise, producing “ghost” artifacts, and by decreasing edge sharpness in moving structures. Multiple techniques exist within the MRCP protocols to mitigate these effects including breath-hold and respiratory triggering techniques [7].
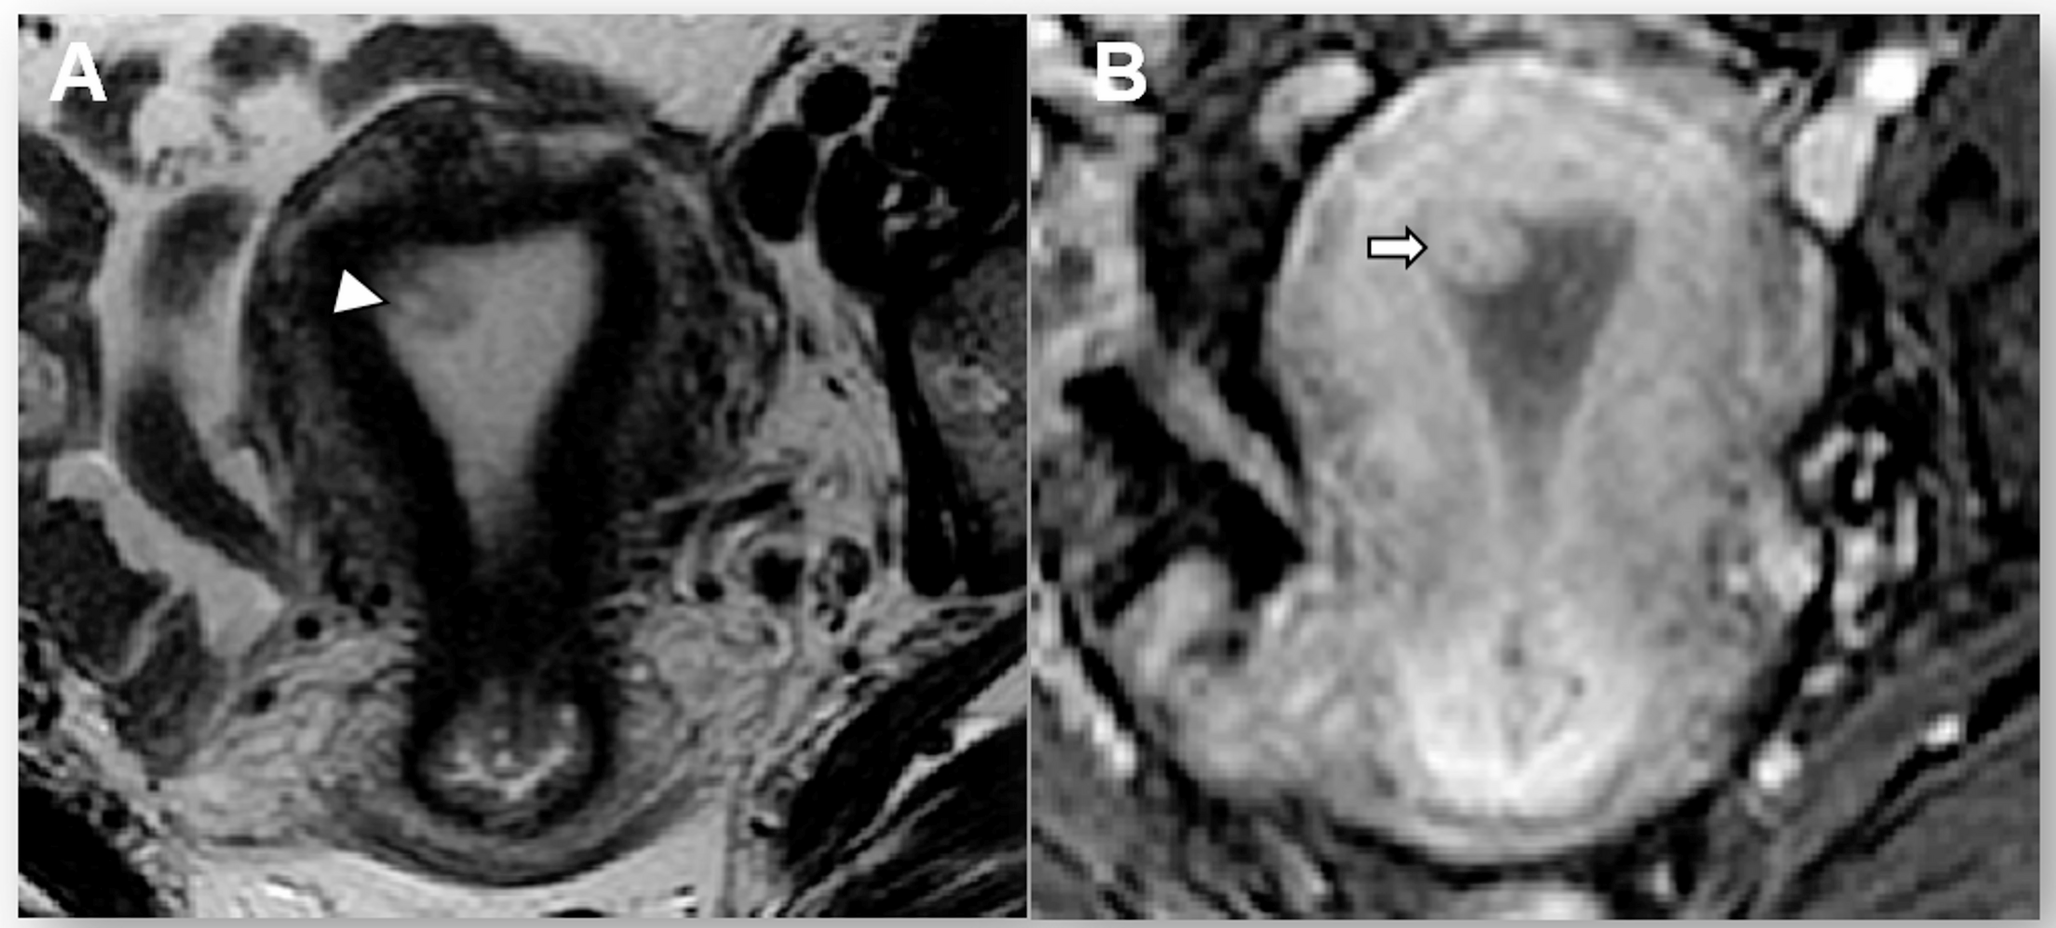
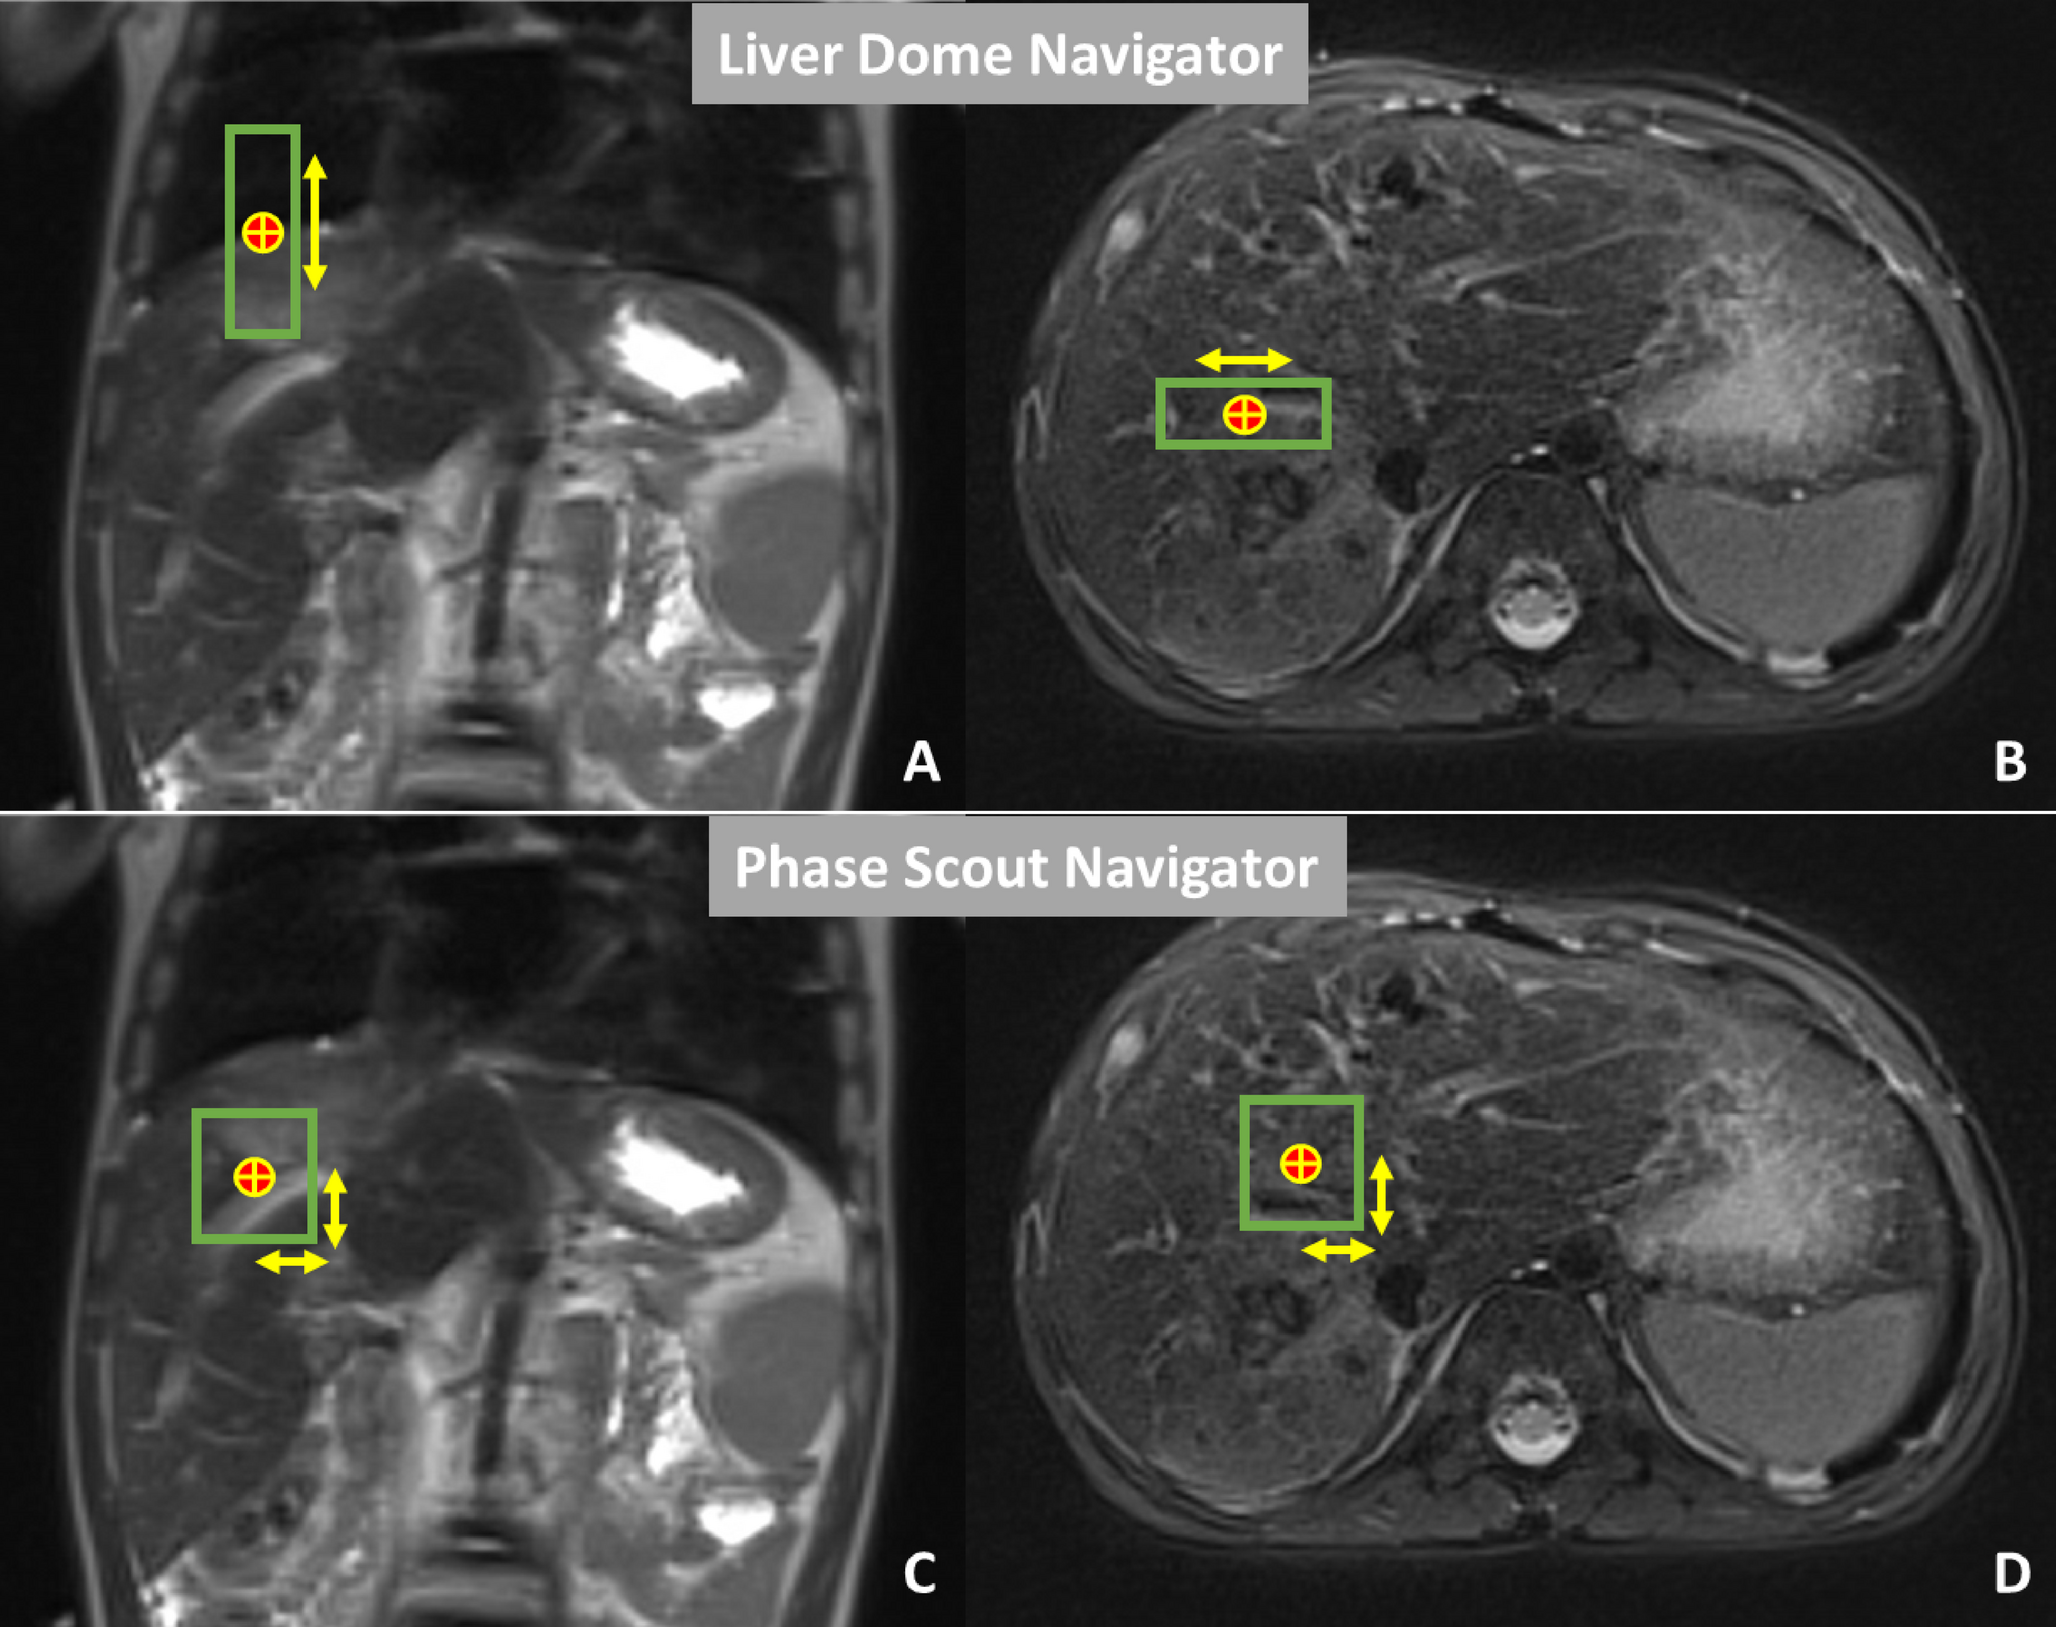
“Respiratory Triggering” initiates MR image acquisition at a fixed point in the respiratory cycle, improving edge sharpness and reducing ghost artifacts [8]. The “Motion Navigator” technique integrates a navigator pulse sequence into the imaging sequence to monitor a region of interest (ROI) in a relatively stable area, such as the diaphragm or liver. When motion is detected, the system adjusts imaging in real time. This technique utilizes 2 different types of navigators. The “Liver Dome” navigator places the ROI over the liver dome, spanning both the liver and chest, to monitor breathing motion, triggering imaging only within a defined motion range. The “Phase Scout” navigator captures a low-resolution image to determine the patient’s respiratory phase to align the image sequences to a consistent point in the respiratory cycle, ensuring imaging occurs during the most stable respiratory phase [9] (Fig. 1).
Fig. 1
Motion Navigator techniques. The red and yellow circle reflects the region of interest within the liver indicating the navigator pulse sequence. The green borders represent the areas of motion. “A” & “B” reflect “Liver Dome” navigator technique settings and “C” & “D” represent phase scout navigator technique settings
Ethical considerationsThis work was performed as quality improvement and therefore was not subject to oversight from the institutional review board. Patient consent was not required; the project adhered to all applicable regulations and ethical considerations, ensuring the protection of patient confidentiality and privacy. HIPAA-compliant methods were used for data management. The Standards for Quality Improvement Reporting Excellence 2.0 guidelines for reporting practice improvement work were followed [10].
Model for improvementThe RITE (Realizing Improvement Through Team Empowerment) methodology, renamed ImPower by the American College of Radiology (ACR), served as the process improvement framework. This approach promotes collaboration within multidisciplinary teams, equipped with data resources to tackle specific performance challenges. Progress is monitored through weekly meetings and bi-weekly reporting sessions. The program follows the Plan-Do-Study-Act (PDSA) cycle, an iterative, structured approach for testing and refining changes [11].
TeamThe multidisciplinary team formed for this project includes a diverse group of experts, such as board-certified pediatric body radiologists, MRI physicist, MR technologists, a Clinical Quality & Operations Improvement Specialist, an Human Factors Engineer, data scientists, and research personnel. This collaboration across disciplines enabled the integration of clinical expertise, technical innovation, and data-driven analysis to drive meaningful improvements in patient care.
Process mappingThe team conducted Gemba walks, defined as systematic onsite observations, in the MRI units where MRCP exams are acquired. During these visits, they carefully observed and documented each step of the process, from the initial placement of the MRCP order to the final completion of the scan (Fig. 2). This hands-on approach allowed the team to interview radiologists and technologists and investigate utilized scanners to gain valuable insights into the workflow and identify areas for potential improvement.
Fig. 2
Workflow process for MRCP exam from order to completion
Root cause analysisRoot cause analysis identified that the quality of MRCP images was compromised due to protocols varied across multiple scanners resulting in the inconsistent application of technical parameters [12]. The “respiratory triggering” technique was not consistently included in 3D T2-weighted sequence in the MRCP protocol, resulting in suboptimal images. Additionally, the “liver dome” or “phase scout” navigator techniques were also applied variably, with some technologists omitting them altogether. As a result, the MRCP protocols required updates to standardize practices within the department. Moreover, inconsistent communication and feedback between radiologists, trainees, and technologists further contributed to the acceptance of low-quality MRCP images (Fig. 3).
Fig. 3
Factors contributing to sub-optimal MRCP imager quality. The trend line represents the cumulative percentage of various factors affecting MRCP image quality, with technical elements, poor communication, and outdated protocols being the most significant contributors
Key driversThe key drivers for improving MRCP image quality focus on optimizing the entire imaging process. This includes enhancing communication between radiologists, technologists, and trainees, as well as ensuring consistent use of imaging techniques and keeping protocols up to date. Furthermore, establishing a regular auditing process for image quality has proven essential in maintaining consistent standards and promoting continuous improvement (Fig. 4).
Fig. 4
Key drivers and interventions to improve image quality of MRCP exams
Interventions (PDSA)MRCP protocol updates and technologist educationIn May 2023, the team updated MRCP protocols across all scanners to enhance imaging technique consistency. Technologists were instructed to incorporate respiratory triggering techniques, using either a liver dome scout or phase scout, to minimize motion artifacts from breathing (Fig. 5). By May 2024, the liver dome technique was set as the default setting on scanners, ensuring standardized practices.
Fig. 5
3D T2-weighted MRI sequences of the same patient. A represents the 3D T2-weighted MRI sequence from an MRCP exam without the use of the respiratory trigger technique. B represents the 3D T2-weighted MRI sequence from an MRCP exam with the use of the respiratory trigger technique. Notice the detailed view of biliary and pancreatic ducts on B in comparison to blurry views on A
To support these changes, the MRI physicist on the team conducted educational sessions for technologists, offering both one-on-one training and didactic presentations during technologists’ recurring meetings. These sessions covered the updated protocols, including how to implement respiratory triggering and operate the scanners using the updated techniques.
Improving communication on image qualityIn May 2023, the team focused on improving communication between radiologists, trainees, and technologists. Radiologists and trainees were encouraged to be more proactive in questioning scans of poor quality, rather than passively accepting them. This created a feedback loop, enabling technologists to quickly address and correct issues identified by radiologists and trainees, fostering a more collaborative approach toward achieving consistent, high-quality imaging.
MRCP exam quality auditingStarting in March 2024, the team established clear criteria for auditing MRCP image quality to ensure consistent scoring, replacing the previous approach that relied on undefined measures and subjective scoring based on the radiologists’ experience. Criteria for reporting image quality issues during audits were developed based on the work of He et al. [13]. These criteria involved scoring image diagnostic confidence on a 5-point Likert scale, where 1 represented the absence of diagnostic confidence and 5 indicated excellent quality or full diagnostic confidence.
The assessment focused on three major findings:
1.Artifacts: Evaluating the presence, frequency, and severity of artifacts, from severe motion and wrap artifacts to a complete absence of artifacts.
2.Background Suppression on 3D SPACE sequence: Assessing the extent of background suppression, ranging from very strong background signal that precluded image interpretation to excellent suppression with no impact on diagnostic quality.
3.Visibility of Key Ducts: Reviewing the visibility of the common bile duct, common hepatic duct, hepatic duct branches, and the pancreatic duct.
Study of the interventionsThe analytics dashboard, the visual interface that displays key data metrics, was updated to store MRCP exams information including details about the protocol followed and respiratory triggering. The primary outcome measure of the project was the percentage of MRCP exams with an acceptable image quality. To ensure consistency in image quality assessment, multiple pediatric body radiologists, with experience ranging from 1 to 30 years, reviewed each MRCP exam using the 5-point Likert scale detailed above. The average score from the reviewers was calculated to determine the overall image quality score for each exam, ensuring a more balanced and reliable evaluation. Scores were grouped into two categories: 1–2 as “sub-optimal quality” and 3 or higher as “acceptable quality” (Fig. 6).
Fig. 6
MRCP exams with different quality scores from score 1 (absence of diagnostic confidence) to score 5 (diagnostic confidence absolutely present)
Additionally, the primary process measure of the project focused on the percentage of MRCP exams that utilized the “Liver Dome Scout” for respiratory triggering.
The primary outcome and process measures were evaluated using control P-charts to assess the impact of interventions over time. These charts display proportions of noncontinuous data with centerlines representing the mean for each distinct project phase, allowing differentiation between common-cause and special-cause variation. Outcome measures were assessed only during weeks when interventions were applied consistently. Special-cause variation was identified using standard control chart rules, including: any single point outside the control limits; four out of five successive points more than 1 standard deviations (SD) from the mean on the same side; two out of three consecutive points more than 2 SD from the mean on the same side of the centerline; eight or more consecutive points on one side of the centerline (a true process shift); or six or more points in a consistently increasing or decreasing trend [14].
Comments (0)