
Remember me
The ever-growing applications of high-order harmonic generation (HHG) table-top attosecond sources in coherent diffraction imaging [1, 2], attosecond extreme ultraviolet (XUV) and soft x-ray spectroscopy of molecules [3, 4] and solids [5, 6], and quantum optics [7, 8] call for their optimization in terms of spectral extension (the so-called cutoff emission) and brightness. This is particularly challenging when targeting the generation of soft x-rays by driving HHG with the direct output of a near-infrared laser. On the one hand, the cutoff energy scales linearly with the intensity,  , of the driving field [9]. On the other hand, the plasma density resulting from the ionization of the generation medium at high intensities affects the spatial and temporal properties of the driving field along the propagation, limiting the effective phase matching length.
In the past years, several strategies have been proposed to achieve perfect phase matching at high photon energies. Conventional generation schemes rely on waveguides [10, 11] or loose focusing geometries [12, 13], for which the intensity of the driving field in the generation medium is tuned below the critical ionization threshold. In this geometry, the laser intensity is either constant or slowly varying along the propagation direction (gas medium length ≪ Rayleigh range), leading to the so-called adiabatic regime. Other approaches rely on quasi-phase matching, where the phase mismatch is compensated along the propagation direction by either modulating the driving laser phase and intensity [14, 15], or the medium density [16–18]. To reach photon energies above 100 eV, these schemes additionally rely on mid-infrared driving wavelengths, since the cutoff scales quadratically with the driving wavelength λ [9]. However, this strategy often requires optical parametric amplification (OPA) or optical parametric chirped pulse amplification sources, which substantially increase the complexity of the driving laser system. Moreover, longer driving wavelengths drastically reduce the HHG yield, as the conversion efficiency scales as λ−5.5–λ−6.5 [19, 20].
Circumventing these limitations requires substantial changes in the generation scheme, as in the case of the so-called overdriven or nonadiabatic regime, first experimentally observed in [21–23] and theoretically explained in [24, 25]. In this regime, intensities in the order of 1015–1016 W cm−2 and a tight focusing geometry (gas medium length greater or comparable to the Rayleigh range) are employed to balance the phase matching terms (see supplementary material for definitions). In contrast to the conventional regime, the tight focusing geometry introduces a strong dipole phase matching term that scales with the intensity gradient, partially compensating for the dominant plasma contribution caused by the high driving field intensities. Additionally, free-space propagation in a highly ionized medium leads to a strong temporal, spectral, and spatial reshaping of the driving field. Typically, reshaping effects are considered as detrimental, while here they transiently modify the generation conditions such that extended cutoff energies can be reached. These conditions, however, constrain the effective phase matching for high photon energies over short propagation distances (<1 mm), making gas confinement the limiting factor for cutoff extension.
In this work, we overcome this challenge by using a newly designed differentially-pumped glass chip [26]. This cell provides highly efficient gas confinement, naturally reducing the interaction with the gas to sub-mm lengths and improving the HHG yield at the cutoff energies. We demonstrate extended cutoff energies matching, or even surpassing, the expected results [27–30] by using multi-cycle (30 fs) driving pulses, in contrast with previous works often stressing the importance of a few-cycle driver [24, 25, 27, 29, 31]. Optimization of the gas pressure and gas target position with respect to the driving beam focus is key to properly balancing plasma, spatial, and dipole phase contributions. We explored the generation in argon, neon and helium, both with 800 nm and 1500 nm driving wavelengths, showing remarkable cutoff extensions in all cases. Moreover, we employed a three-dimensional (3D) propagation model [32], based on the strong-field approximation (SFA) [33], to prove the importance of short interaction lengths. Our results provide novel insights into the overdriven regime, showcasing the use of an engineered gas target for the generation of temporally and spatially confined radiation at high photon energies.
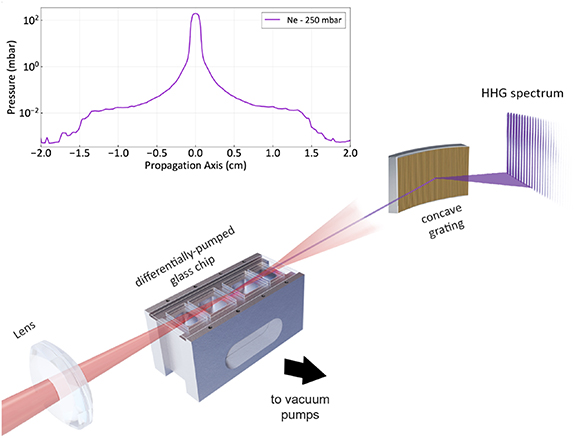
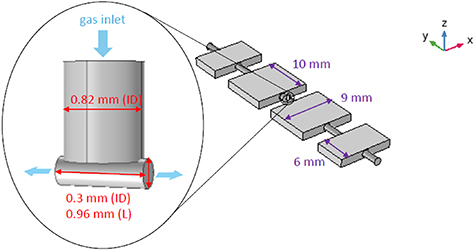
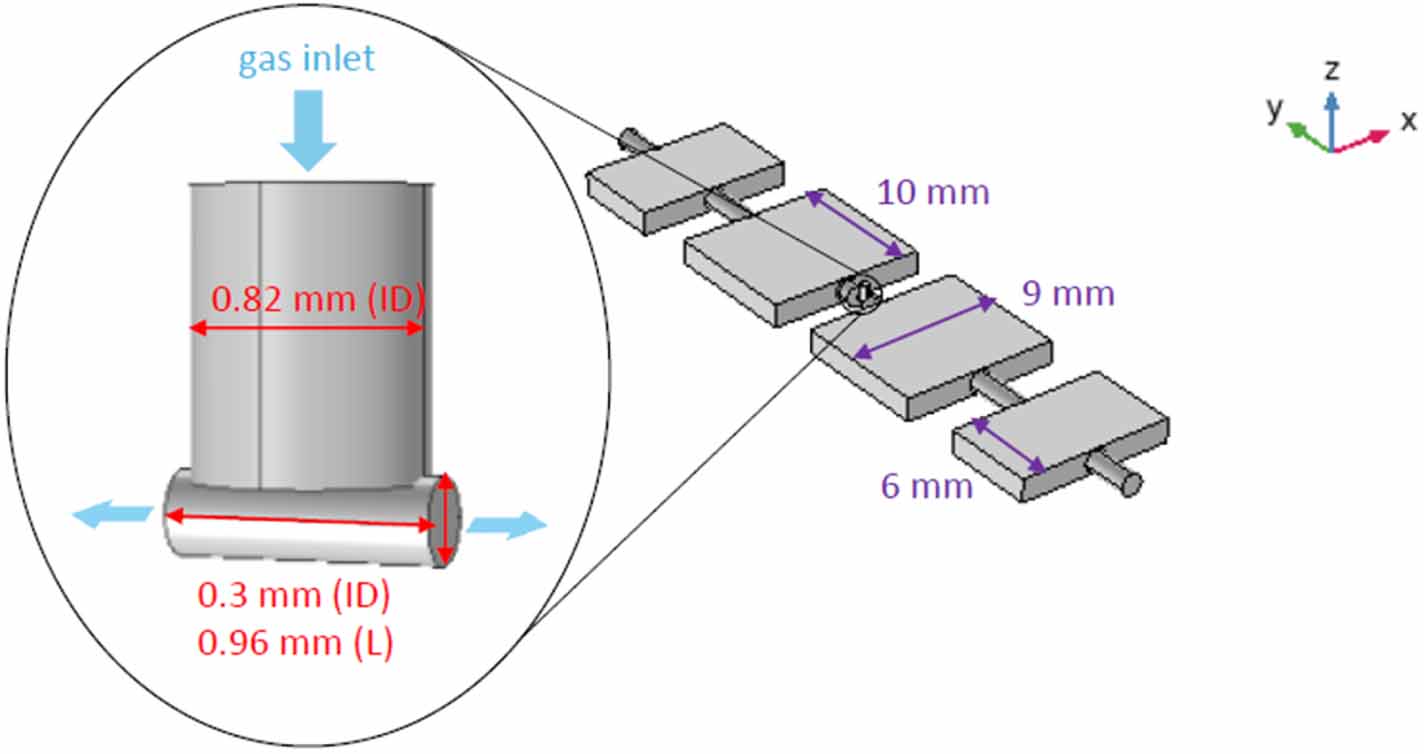
A schematic layout of the gas target used for this experiment is shown in figure 1. The glass chip used to confine the gas is a modified version of the one used in [26] for third harmonic generation, and it is composed of a central gas reservoir of 960 μm length followed by a two-stage differential pumping sections. It was fabricated using the femtosecond laser irradiation followed by chemical etching technique [34, 35]. A detailed description of the chip is reported in appendix A. The gas distribution along the chip has been simulated using the free-molecular flow model in COMSOL Multiphysics [36]. When an input pressure of 250 mbar of neon gas is injected into the cell, as shown in the inset of figure 1, a pressure drop of approximately four orders of magnitude is predicted in the first pumping stage, i.e. 1 cm away from the center, which is consistent with the experimentally measured pressure. The cell is placed on a motorized stage controlling three translation axes and one in-plane rotation axis, enabling the optimization of the generation process through precise control of the cell position with respect to the laser focus position. In our scheme, optimal conditions are achieved with the medium placed approximately one Rayleigh length after the focus and at gas pressures of a few hundred millibars. Positioning the medium further downstream reduces the intensity below the threshold for effective overdriven generation, while higher pressures and shorter distances cause excessive ionization early in the medium, preventing phase matching and suppressing the harmonic yield at high photon energies.
Figure 1. Schematic layout of the HHG setup. The near infrared light (800 nm or 1500 nm) is tightly focused into the differentially pumped glass chip granting intensities in the order of 1016 W cm−2. The harmonic radiation is then dispersed through a concave grating and collected at the detector. Inset: pressure profile along the cell (4 cm length) for the case of 250 mbar of neon input pressure as calculated using the free-molecular flow regime in the COMSOL simulation tool. The first pumping stage provides a pressure drop of four orders of magnitude when pumped at a speed of ca. 40 m3 h−1 corresponding to our experimental conditions.
Download figure:
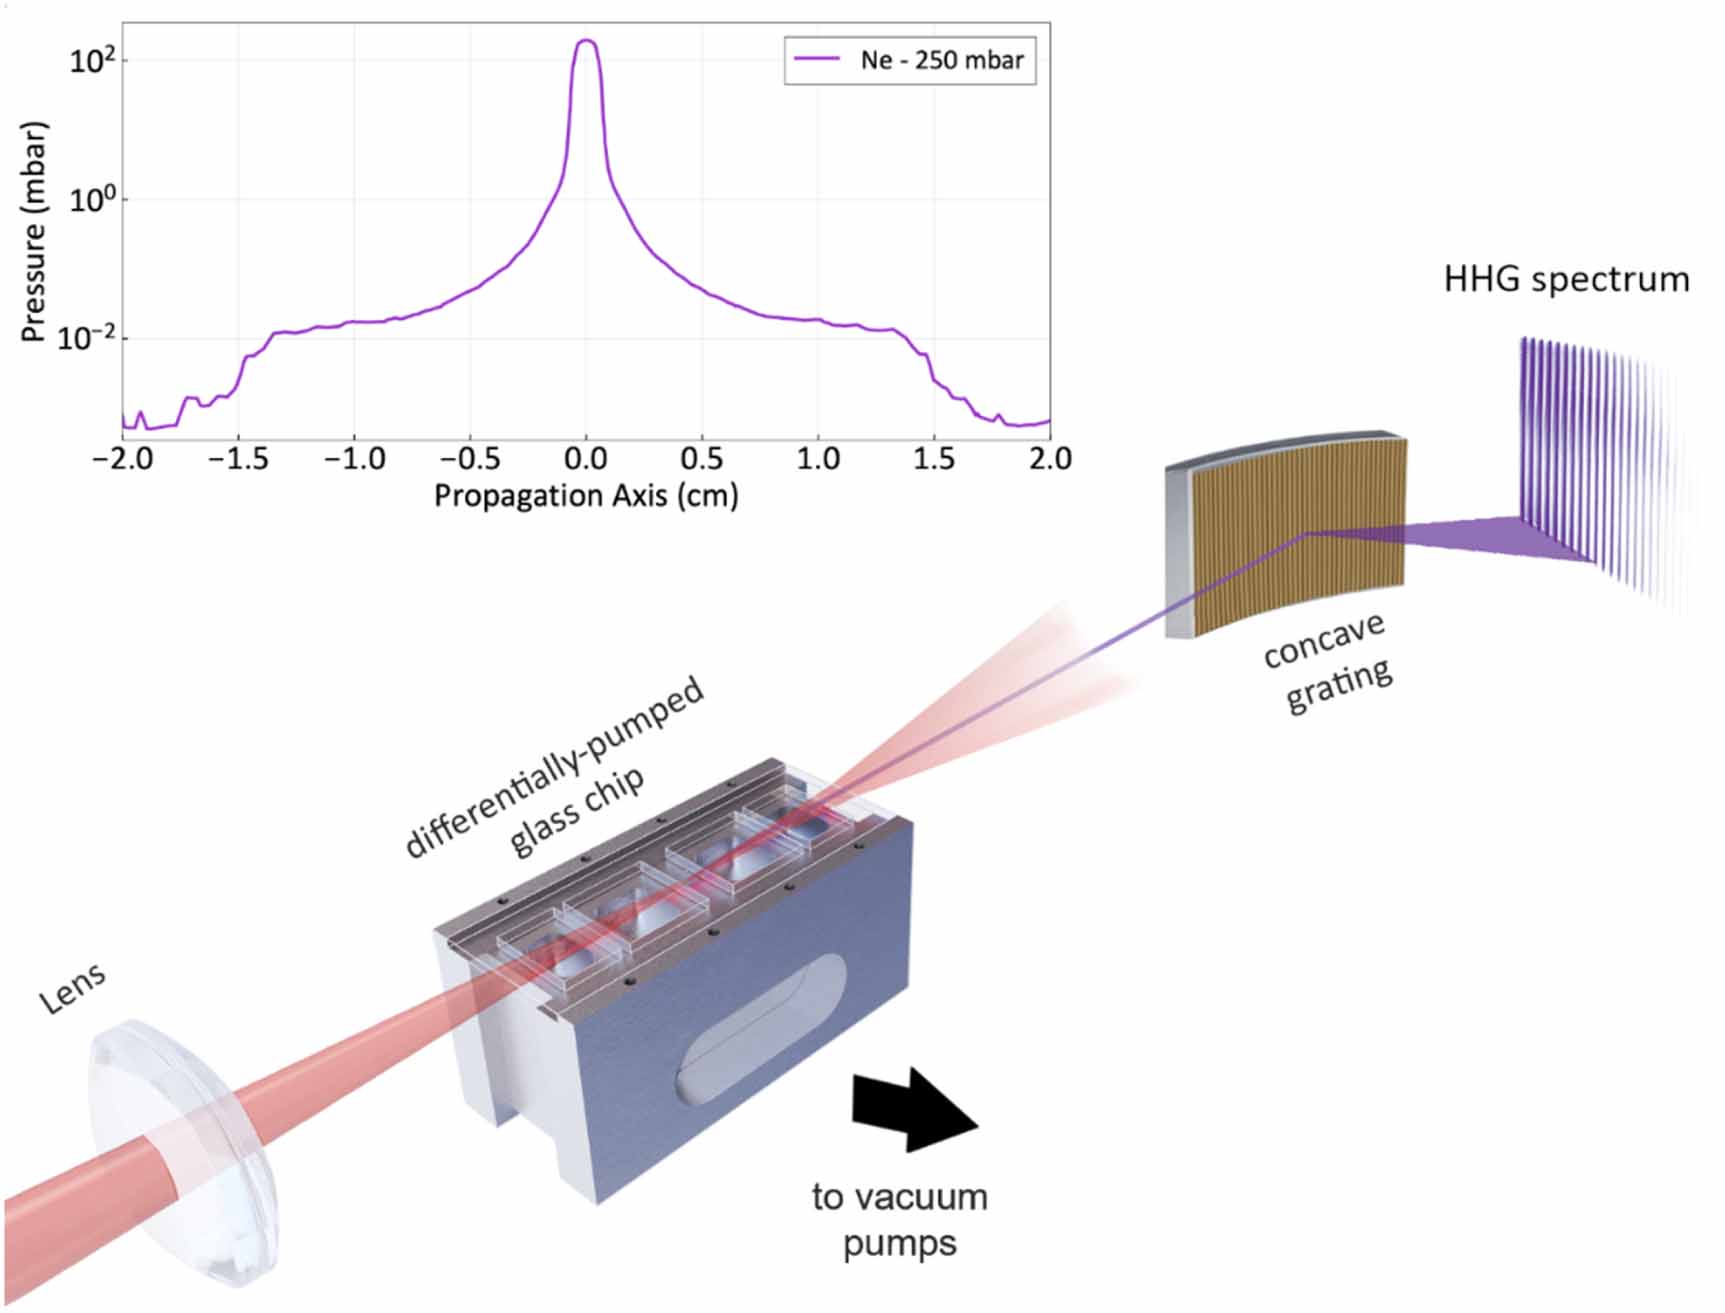
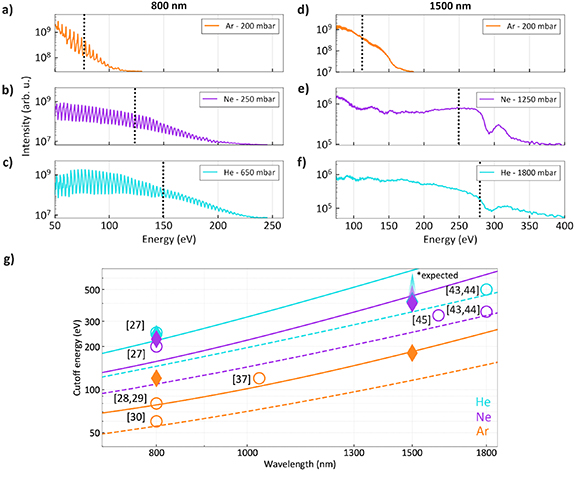
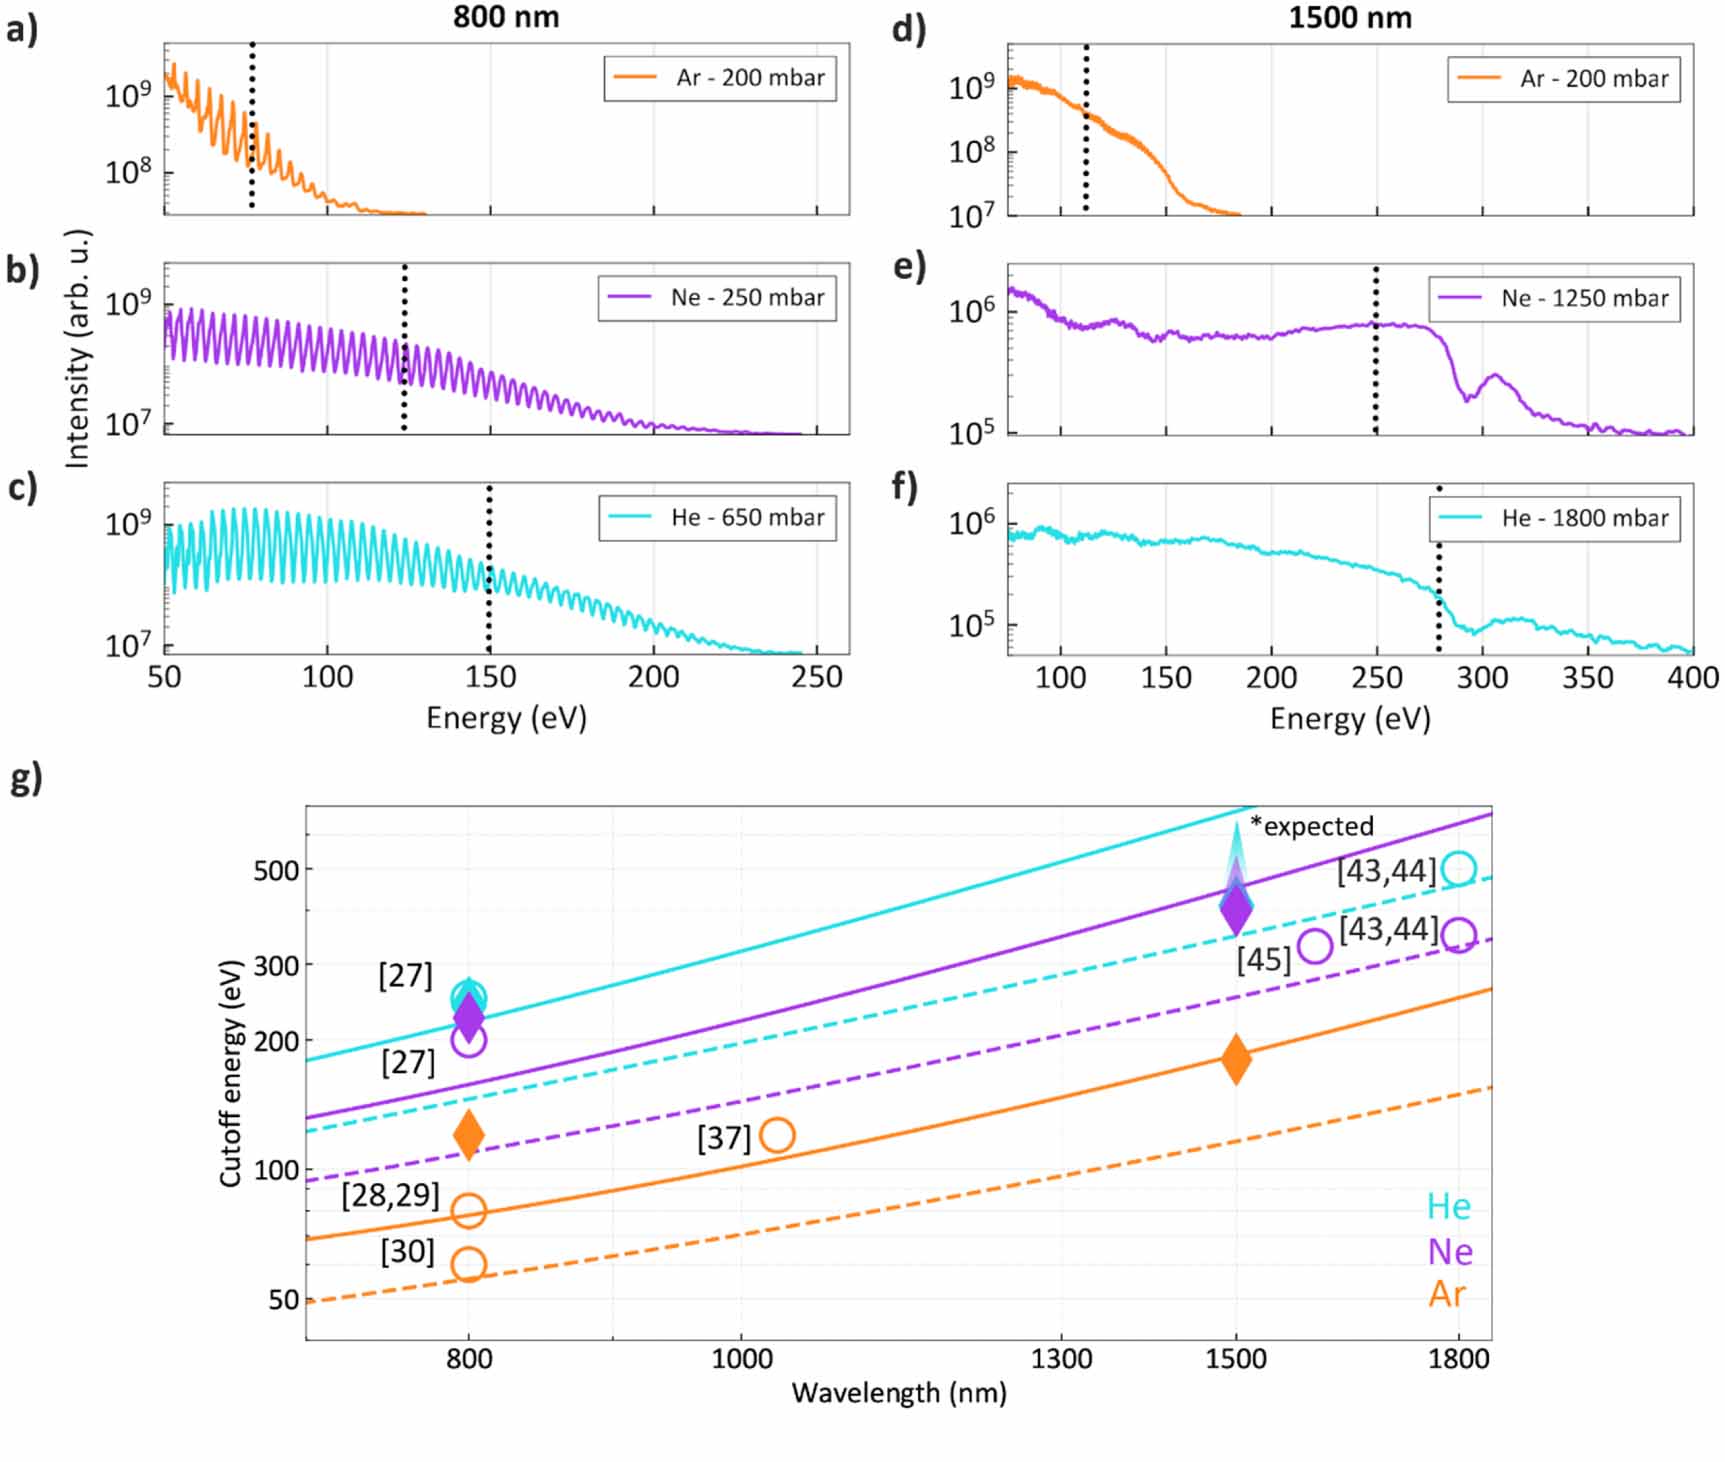
Standard image High-resolution imageHarmonic spectra generated in argon (top), neon (middle) and helium (bottom) with 800 nm (panels (a)–(c)) and 1500 nm (panels (d)–(f)) driving fields are reported in figures 2(a)–(f). The peak intensity at focus for both driving wavelengths is on the order of 1016 W cm−2, corresponding to a spot-size (1/e2 radius) of 20 µm and pulse durations of 30 fs. The optimal gas pressures are reported in the figure for each case and range from 200 to 1800 mbar. Both driving wavelengths generate harmonic spectra extending far beyond conventional cutoff photon energies, which are indicated by the black dotted lines in figures 2(a)–(f) and calculated from [37]. In all generating media, the measured cutoff energy is approximately twice what is typically reported in the conventional regime. We note that, in contrast to standard generation approaches using Ti:Sapphire lasers, a photon energy of 92 eV can be accessed in the plateau region of the HHG spectrum generated in neon (figure 2(b)). This corresponds to a wavelength of 13.5 nm, which is particularly relevant for XUV lithography [38, 39].
Figure 2. (a)–(f) HHG spectra obtained in Ar (orange), Ne (purple) and He (light blue) with 800 nm (left) and 1500 nm (right) driving fields. The black dotted lines highlight the expected cutoff in the conventional regime. (g) Theoretical curves (log-log scale) of the cutoff energies as a function of the driver laser wavelength in Ar (orange), Ne (purple) and He (light blue) in the conventional (dashed lines) and in the overdriven regime (full lines) from [37]. The circles mark the cutoff energies reported in literature, while the diamonds represent the results obtained in the current work. The photon energy at which the HHG yield decreases to 1% with respect to its maximum is consistently adopted as a cut-off energy definition for this work and the selected literature. The markers for He and Ne with the 1500 nm driver underestimate the actual cutoff as only a decrease to 10% of the maximum is observed (see main text). They are therefore reported as shaded areas towards higher energies to indicate qualitatively expected values based on the theory.
Download figure:
Standard image High-resolution imageIn contrast to the discrete spectra obtained with the 800 nm driving field, the HHG spectra at 1500 nm exhibit a quasi-continuum (figures 2(d)–(f)). This effect cannot be attributed to the spectrometer resolution, which exceeds 200 meV and readily resolves the ∼1.6 eV harmonic separation at 1500 nm. Instead, it can be readily explained by the physics of the HHG process [11, 40] when considering that the ionization rate for the central part of the beam is higher than 80%, way above the typical ionization rate of the conventional phase matching regime (generally below 10%). Extremely high ionization rates lead to an ionization gating effect [41], which combined with fewer optical cycles (6 cycles and 11 cycles for the 1500 nm and 800 nm drivers, respectively) yields to a spectral smearing of the otherwise discrete harmonic spectrum.
As in the previous case, the cutoff energy in argon extends by almost a factor of two compared to the conventional regime. The spectra in neon and helium reach even higher energies, showing an absorption feature around 290 eV corresponding to the C K-edge due to carbon contamination of the beamline optics. The current spectrometer allows the detection of up to 400 eV, even though the grating is optimized only for energies up to 250 eV [42]. If higher photon energies could be detected, the cutoff would likely extend even further. Notably, as shown in figures 2(e) and (f), only a modest decrease of about one order of magnitude (10%) relative to the maximum intensity is observed, which is still above the 1% yield drop used here as a definition for the cutoff energy. These results indicate the possibility of entering the water window without the need of using driving fields of 1800 nm or even longer wavelengths, so far privileged in the literature [43–46].
An overview of the cutoff energies reached as a function of the driving wavelength in argon, neon and helium is reported in figure 2(g). The dashed lines correspond to the expected cutoffs in the conventional regime, while the solids lines show the cutoff in the overdriven regime; both curves are calculated from [37]. Our results are reported as diamonds, while the circles correspond to selected literature data acquired in the same overdriven regime [27–30, 37, 43–45]. The photon energy at which the HHG yield decreases to 1% with respect to its maximum is consistently adopted as a cut-off energy definition for this work and the selected literature. The generation conditions for each case reported in figure 2(g) are summarized in table 1 (see supplementary material). In all cases, our generation’s conditions largely exceed the cutoff energies of the conventional regime. Furthermore, they either match or even surpass the expected values for the overdriven regime at 800 nm by 25%–50%, reaching 120 eV, 225 eV and 240 eV for Ar, Ne, He, respectively. In particular, the 800 nm spectral cutoff in argon is the highest ever reported in literature, while in neon and helium we obtain extended cutoffs similar to [27], where the authors employed few-cycle pulses. In this respect, our work shows the notable advantage of using the direct output of the Ti:Sapphire laser (30 fs) to exceed 200 eV photon energies, simplifying the generation scheme for these photon energies. This demonstrates that the overdriven regime does not necessarily impose constraints on the pulse duration of the driving field, contrary to what was initially reported as a strict requirement from theory [24, 25].
The HHG source driven with 800 nm pulses in argon and neon was characterized in terms of photon flux. Under optimal conditions, we measured a photon flux of approximately 109 photons per second for argon at a central energy of 60 eV (within a 20 eV bandwidth). For neon, the flux was about two orders of magnitude lower, at a central energy of 150 eV and within a 150 eV bandwidth. It is important to note that these values significantly underestimate the actual photon flux of the HHG source. This underestimation stems from the beamline losses mainly due to the limited size of the toroidal mirror used in this experimental setup, which results in a vertical cut of the HHG beam as observed at the detector plane (see appendix A). Additionally, our experimental observations indicate that the conditions producing the maximum cutoff do not coincide with those yielding the maximum brilliance. Achieving the maximum cutoff involves positioning the medium approximately 1 mm upstream of the focus, which results in a threefold reduction in flux but increases the spectral bandwidth by 50% compared to the maximum-brilliance configuration, where the medium is placed a few hundred microns downstream of the focus. To accurately quantify the photon flux, further optimization of both the experimental setup and the detection methods is necessary. These points will be addressed in future work.
To substantiate the claim that the exceptional gas confinement offered by the two-stage differentially pumped gas target is key to achieving the performances presented above, we performed simulations of the generation process based on a 3D full-space propagation model [32]. The model relies on the nonadiabatic SFA, which accounts for the response of each atom of the nonlinear medium to the full driving field, and thus to sub-cycle variations of the electron density. Additionally, the full-space simulation describes the sub-cycle variations of the driving field during the propagation in the medium, capturing the substantial reshaping of the NIR pulses due to propagation in the highly ionized medium characteristic of the overdriven regime. As proposed in [47, 48], the ionization rate is computed using a modified version of the Ammosov–Delone–Krainov (ADK) model [49]. This model includes an empirical correction of the standard ADK model to take into account the higher ionization rates. This allows for matching the experimental results without the need to include contributions from multiple ionizations [31, 50–52], and without implementing the computationally demanding above-barrier ionization (ABI) model [53], which would prevent performing full-space simulations. The calculations also include the absorption of the harmonic field through the gas medium, which was set to a constant gas density over the whole propagation length. A full description of the theoretical model adopted is reported in appendix B. We performed simulations for different media and driving wavelengths exploring a wide range of parameters, thus confirming the robustness of the model. In the following we will report on the results obtained in neon with the 800 nm driving wavelength by using the same parameters as in the experiment.
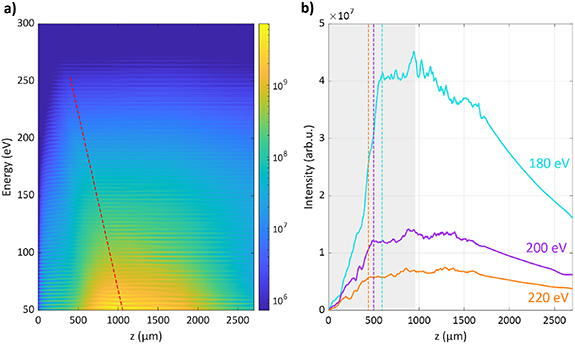
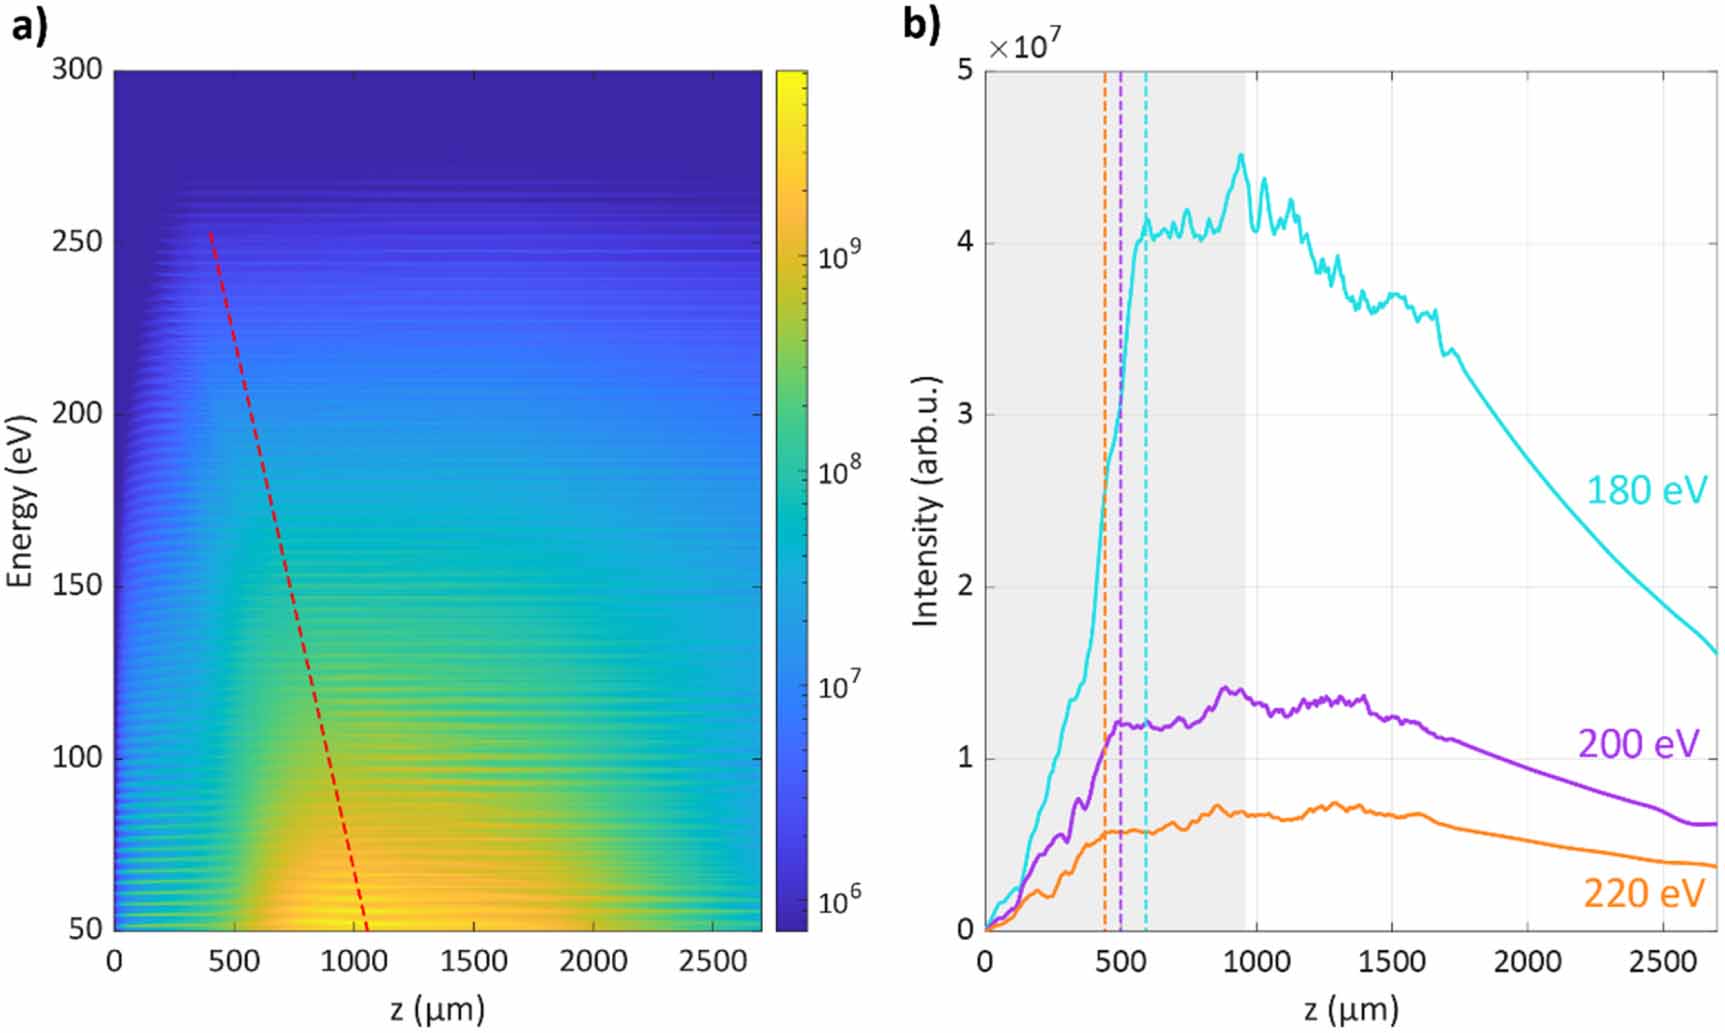
The relevance of gas confinement for efficient cutoff extension in the overdriven regime is highlighted in figure 3(a), which shows the calculated harmonic spectrum generated by the 800 nm driver in neon and integrated over the radial coordinate as a function of an extended propagation distance of 2700 µm. While for photon energies below 100 eV, the harmonics yield progressively increases up to almost 1.5 mm, for higher photon energies saturation is reached well below 1 mm, thus within the gas target thickness of 900 µm used in the experiment and significantly decreases for larger propagation distances. For a more quantitative visualization of this effect, in figure 3(b) we report line cuts of the harmonic intensity for the selected values of 180 eV (light blue), 200 eV (purple) and 220 eV (orange). The gray area highlights the medium length used in the experiment. We identify three distinct regions along the propagation axis: a first region, extending up to approximately 500 µm, where the harmonic yield increases; a second region, up to about 1.5 mm, where the yield remains nearly constant; and a third, final region where the yield begins to decrease. The first region corresponds to a regime of effective phase matching, where the interplay between plasma, dipole, and geometric phase contributions favors the generation of harmonics at higher cutoff energies. Intensity saturation is reached progressively earlier in the medium for increasing photon energies, as indicated by the vertical dashed lines. This behavior is consistent with the decrease in coherence length at increasing harmonic order [54]. In the central part of the medium, phase matching conditions start to become unfavorable, yet reabsorption remains minimal [24], allowing the yield to be preserved. The length of the intermediate region decreases as absorption becomes dominant, a condition that is generally true the lower the photon energy (up to 100 eV), and therefore especially in the plateau region (see supplementary material for extended simulation results). The step-like profile of the harmonic yield over sub-mm lengths is consistent with the description reported in [24] as signature of the overdriven regime. In the last region, harmonic propagation is increasingly affected by reabsorption, resulting in a yield reduction of nearly a factor of two over approximately 1 mm of propagation. This analysis reinforces the conclusion that efficient generation of extended cutoff emission in the overdriven regime strictly requires gas confinement on the sub-millimeter scale.
Figure 3. Simulated high harmonic generation and three-dimensional space propagation over 2700 µm of the HHG spectrum in Ne with 800 nm driving pulse (a) Spectral intensity (arbitrary units, arb.u.) integrated over the radial coordinate as function of the propagation axis (z) in the gas medium. The red dashed line highlights how saturation of the yield is progressively reached at shorter propagation distances, the higher the photon energy. (b) Intensity for three energies of interest (180 eV, 200 eV, 220 eV) as function of the propagation distance in the gas medium. The gray area corresponds to the actual medium length used in the experiment (900 µm). Intensity saturation (dashed vertical lines) is progressively reached at shorter propagation distances for higher HHG photon energies. Within the medium length, the yield of the cutoff energies is preserved.
Download figure:
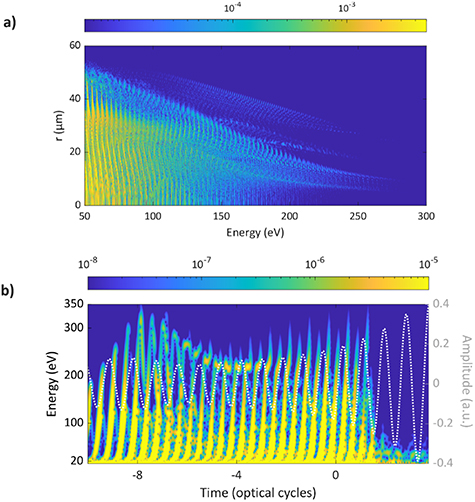
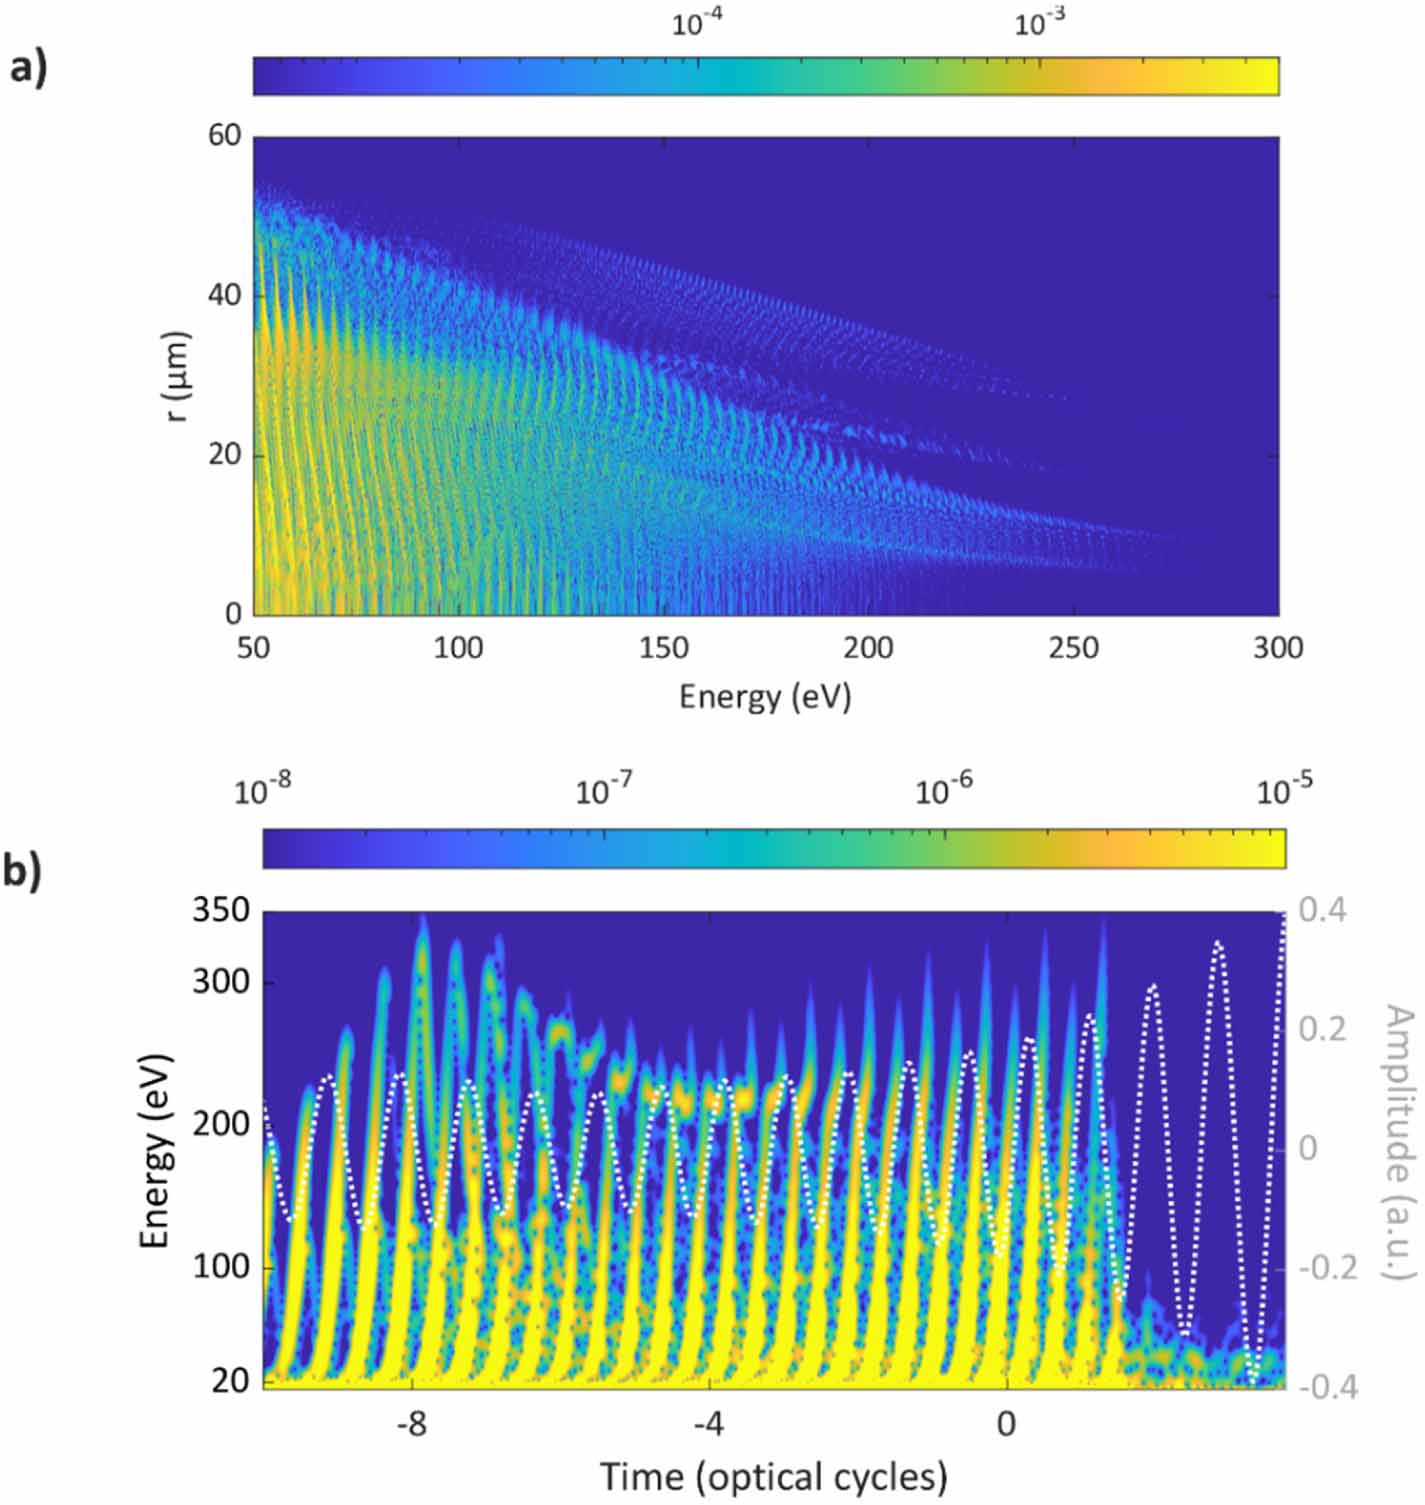
Standard image High-resolution imageAdditional physical insights about the overdriven regime can be derived from a detailed analysis of the temporal and spatial characteristics of the emitted radiation. Figure 4(a) shows the simulated spatial profile of the HHG spectrum as a function of the radial coordinate and photon energy computed at the end of the propagation in the medium (900 µm). Harmonics above 200 eV are generated off-axis and predominantly between 5 and 15 µm. This effect is a consequence of the full ionization of the medium in the central region of the beam (0–5 µm), which prevents efficient generation to take place (see supplementary material for extended simulations results). Notably, in the far-field this off-axis confinement is not observed, nor is it expected with our experimental geometry. We could in fact measure a rather homogeneous distribution of the harmonic spectra even in the cutoff region (see appendix A). Based on these results, we performed a Gabor analysis [55] of the harmonic spectrum at 8 µm radius, where the generation occurs for most of the cycles of the leading edge of the driving field (figure 4(b)). We find that the interplay between long and short trajectories varies at the sub-cycle time scale following the evolution and temporal reshaping of the driving field. For optical cycles between −10 and −8, corresponding to the maximum cutoff extension up to 300 eV, both short and long trajectories are equally contributing. For later cycles, the generation up to 220 eV is instead dominated by short trajectories. However, the region between −6 and −3 optical cycles presents interference trajectories to reconduct to a plasma-induced phase shift of the driving field. This peculiar generation dynamics can be explained by the transient nature of phase matching at high intensities, where both the plasma contribution and the intensity-dependent dipole phase vary on a sub-cycle timescale [56]. In neon, the higher ionization potential (21.6 eV) results in lower ionization levels. This reduces plasma dispersion and shifts the transient phase-matching conditions in favor of short trajectories, which exhibit weaker dipole phase sensitivity and are more robust against phase mismatch at higher harmonic orders. On the other hand, for the same generation conditions, in argon, characterized by a lower ionization potential (15.7 eV), long trajectories are favored at later cycles (see supplementary material).
Figure 4. Radial and temporal structure in the simulated harmonic spectrum at the end of the medium (z = 900 µm), using Ne and an 800 nm driving pulse (a) HHG spectral intensity as function of the radial coordinate and photon energy. The high-energy cutoff is confined to radial coordinates between 5 and 15 µm, where 0 µm represents the on-axis propagation. (b) Gabor analysis for the spectrum in (a) for a radial coordinate of 8 µm, corresponding to conditions of maximum extension of the photon energy cutoff. The corresponding driving field amplitude is overlaid (white dashed line) to allow sub-cycle and envelope effects to be examined. The leading edge of the pulse is strongly reshaped, while harmonics are emitted preferentially with short trajectories from cycles −5–0.
Download figure:
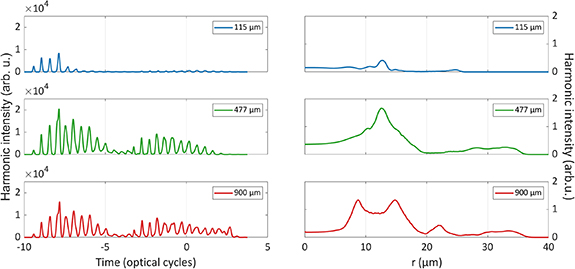
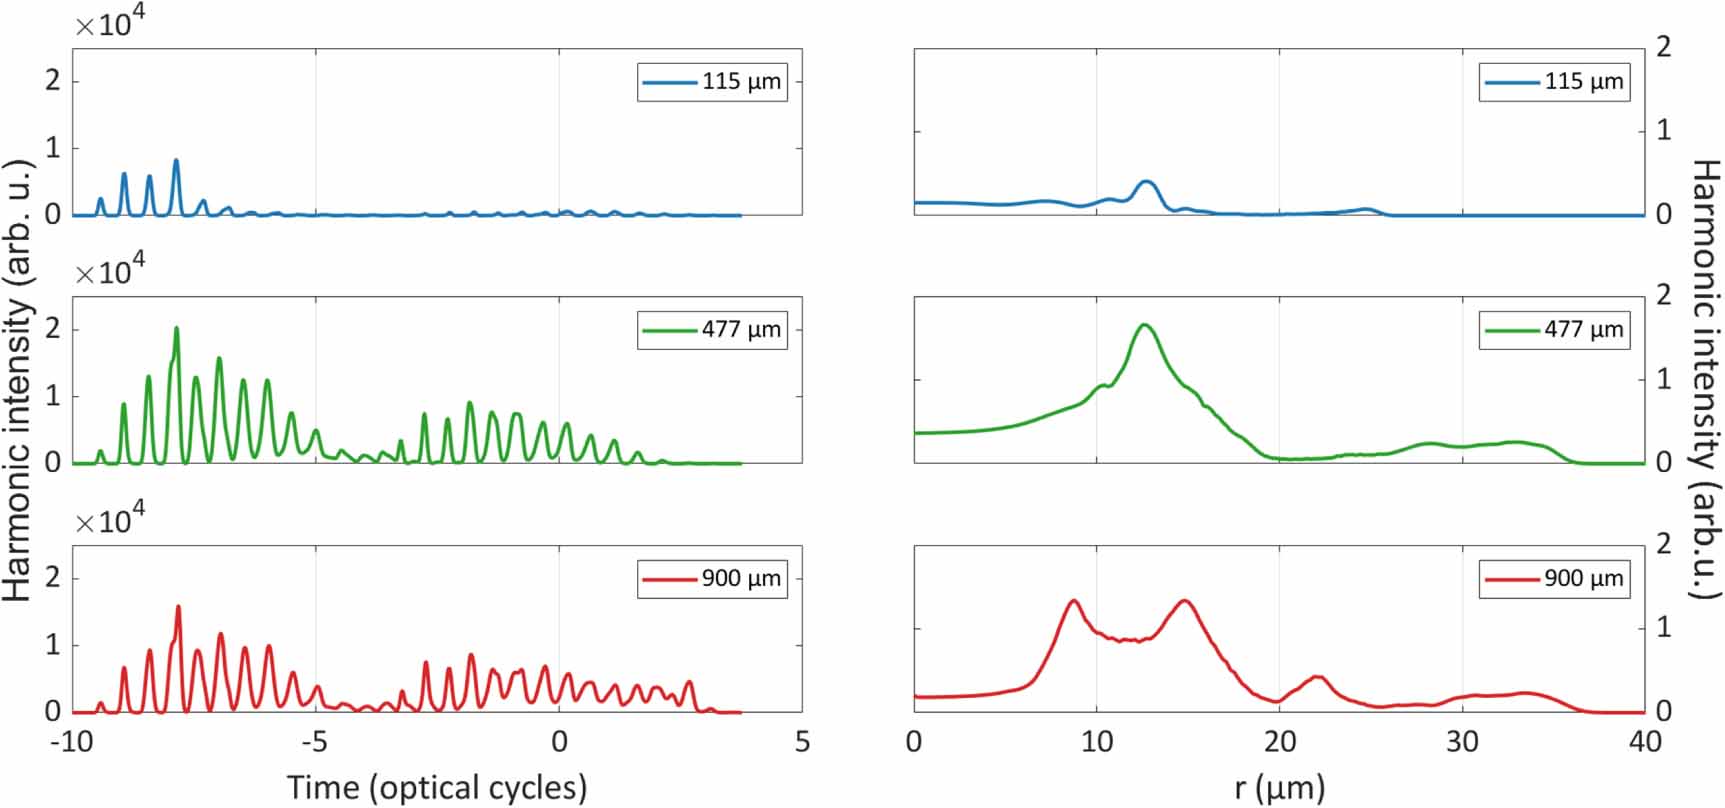
Standard image High-resolution imageMoreover, we performed a propagation-dependent analysis showing a dynamic build-up of the harmonic field from different temporal and spatial regions across the medium. Figure 5 reports the simulated harmonic intensity as per Gabor analysis integrated between 200 and 220 eV and over the radial coordinate as a function of time (first column), and over time as a function of the radial coordinate (second column). At small propagation distances (z = 115 µm), the high peak intensity of the driving field causes rapid plasma defocusing, limiting the phase matching to the first few cycles, before full ionization of the medium occurs (top panels). Additional propagation (z = 477 µm, middle panels) leads to off-axis maximization of the HHG intensity, with efficient generation shifting towards later time cycles. The strong plasma-induced reshaping of the driving field (see supplementary material) leads to a shrinking of the leading-edge intensity, allowing for efficient phase-matching over multiple cycles. Finally, in the second half of the cell (z > 500 µm, bottom panels), the reshaping of the driving field turns into unfavorable phase-matching generation conditions, leading to an overall yield decrease in the central region of the beam and a spreading towards external radii.
Figure 5. Simulated harmonic intensity integrated between 200 and 220 eV as function of time (first column) and radial coordinate (second column), as obtained through Gabor analysis, at z = 115 µm (top), z= 477 µm (middle), z = 900 µm (bottom). The harmonic emission shifts towards longer time cycles, the longer the propagation distance. It is radially confined between 5 and 20 µm.
Download figure:
Standard image High-resolution imageOverall, our analysis clarifies the exceptional efficiency of our generation scheme, where we fully harness the spatiotemporal reshaping of the driving field in the overdriven regime by using a multicycle driver. The dynamic spatiotemporal confinement of the cutoff emission highlights the opportunity of further improving the generation conditions by engineering the spatial profile of the driving field to compensate for plasma defocusing and blue shifting of the central frequency, extending the overdriven regime beyond previous expectations.
In this work we present a newly designed glass chip characterized by highly efficiency gas confinement showing unprecedented cutoff energy extension in the overdriven regime using multicycle near-infrared driving pulses. In particular, we investigated the cutoff emission using multicycle driving fields at 800 nm and 1500 nm. The 800 nm field enabled us to reach cutoff energies of 120 eV for Ar, 225 eV for Ne, and 240 eV for He. Using the 1500 nm field, we obtained a cut-off emission of 180 eV in Ar and reached 400 eV in Ne and He. The actual cutoff energies for Ne and He are likely even higher, but are limited by our detection geometry. By performing a 3D simulation of the HHG process that takes into account the experimental conditions, we show a dynamic reshaping of the driving field leading to a temporal and spatial confinement of the cutoff harmonics. Furthermore, our simulations rationalize the origin of increased phase matching efficiency for high-order harmonics using short generation media, highlighting the technological relevance of effective gas confinement over sub-mm scales and explaining the superior performances of our glass chip. By using the direct output of a commercial laser, our implementation strongly reduces the experimental complexities required for extended cutoffs, opening significant perspectives for simpler HHG schemes in both research and industry in the soft x-ray domain.
F.C. acknowledges funding from Cluster of Excellence ‘CUI: Advanced Imaging of Matter’ of the Deutsche Forschungsgemeinschaft (DFG)—EXC 2056—project ID 390715994, the Helmholtz-Lund International Graduate School (HELIOS) project number HIRS-0018, the Centre for Molecular Water Science (CMWS). O.C. acknowledges the Swiss National Science Foundation Postdoc.mobility program under the Grant agreement P500PN_214151 and the European Union’s Horizon Europe research and innovation program under the Marie Skłodowska-Curie METRICS HORIZON-MSCA-2022-PF-EF Grant Agreement No. 101106352. R.M.V. and S.S. acknowledge the European Union’s Horizon Europe research and innovation program under the FETOPEN Grant Agreement No 964588 (X-PIC). A.T. acknowledges funding from the Helmholtz Young Investigator Group (VH-NG-1603) and the European Research Council ‘SoftMeter’ (101 076 500). V.W. acknowledges funding from the German Research Foundation (DFG) project ID 545611997. This research was supported in part through the Maxwell computational resources operated at Deutsches Elektronen-Synchrotron DESY, Hamburg, Germany. A.A. thanks Aksana Maria Wietrow for the support on the 3D graphic content.
The data cannot be made publicly available upon publication because they are not available in a format that is sufficiently accessible or reusable by other researchers. The data that support the findings of this study are available upon reasonable request from the authors.
Supplementary data 1 available at https://doi.org/110.1088/2515-7647/ae4080/data1.
The laser system used in this work is a carrier-envelope phase (CEP) stable Ti:Sapphire laser at 1 kHz repetition rate, with 800 nm central wavelength and 30 fs pulse duration (Femtopower). HHG was driven either using the direct output of the Ti:Sapph system (up to 1.5 mJ at the generation point), or the output of a custom-built two-stage CEP-stable OPA [57] operating at 1500 nm, 30 fs duration, providing up to 500 µJ at the generation point. The driving fields were tightly focused into the gas target using a 15 cm focal length lens, yielding a beam waist of approximately 40 μm (1/e2) in diameter, corresponding to peak intensities of 0.8–1 × 10¹⁶ W cm−2 and 4–5 × 101⁵ W cm−2, respectively.
The gas target is confined to a sub-mm length by employing a custom-designed differentially pumped chip. The laser-gas interaction region consists of a single channel of 300 μm inner diameter and 960 μm length, which is oriented along the laser propagation axis and placed on top of a vertical cylinder of 820 μm in diameter that is used as a gas reservoir. Moving away from the center, the channel scales to a diameter of 1.3 mm into two consecutive chambers of the chip having areas of 9 × 10 mm2 and 9 × 6 mm2 (1 mm separation distance). These chambers are directly connected to two separate vacuum pumps (nominal pumping speed 55 m3 h−1) ensuring differential pumping and a sudden pressure drop along the laser propagation axis. The cell is placed on a motorized stage controlling three translation axes and one in-plane rotation axis. A metering valve mounted in the gas line before the entrance to the chip allows fine tuning of the input gas pressure at the mbar level. A schematic of the chip dimensions is shown in figure. A1 as per COMSOL Multiphysics simulations [36]. The total length of the chip is 41 mm, its thickness is 3 mm.
Figure A1. Schematic of the glass chip dimensions.
Download figure:
Standard image High-resolution imageTo block the residual fundamental beam, metallic filters (Al, Zr, In) were used after generation. The resulting high-order harmonics were then refocused in a 1:1 geometry using a toroidal mirror such to allow the installation of a sample target and further experiments. After the focus, the radiation is then spectrally dispersed with an aberration-corrected concave grating (Hitachi, central groove density 1200 grooves mm−1, wavelength range 5–25 nm). The signal was detected using a chevron-stack of microchannel plates (MCP) coupled to a phosphor screen (P43), which was imaged by a CMOS camera placed in air. The overall resolution of the detection system is better than 200 meV. The photon fluxes reported in the main manuscript were measured at the focus position after the toroidal mirror with a SiC-based photodiode optimized for EUV radiation (SCT-EUV20, GaNo Optoelectronics) connected to a lock-in amplifier trigger by the laser itself. Figure A2 shows an example of uncalibrated HHG spectrum (cutoff region) as recorded at the detector. The figure shows sharp edges (top and bottom of the spectrum), indication that the XUV radiation is partially cut at the toroidal. Quantifying the loss in terms of photon flux though is non-trivial.
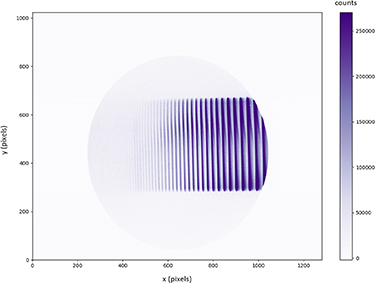
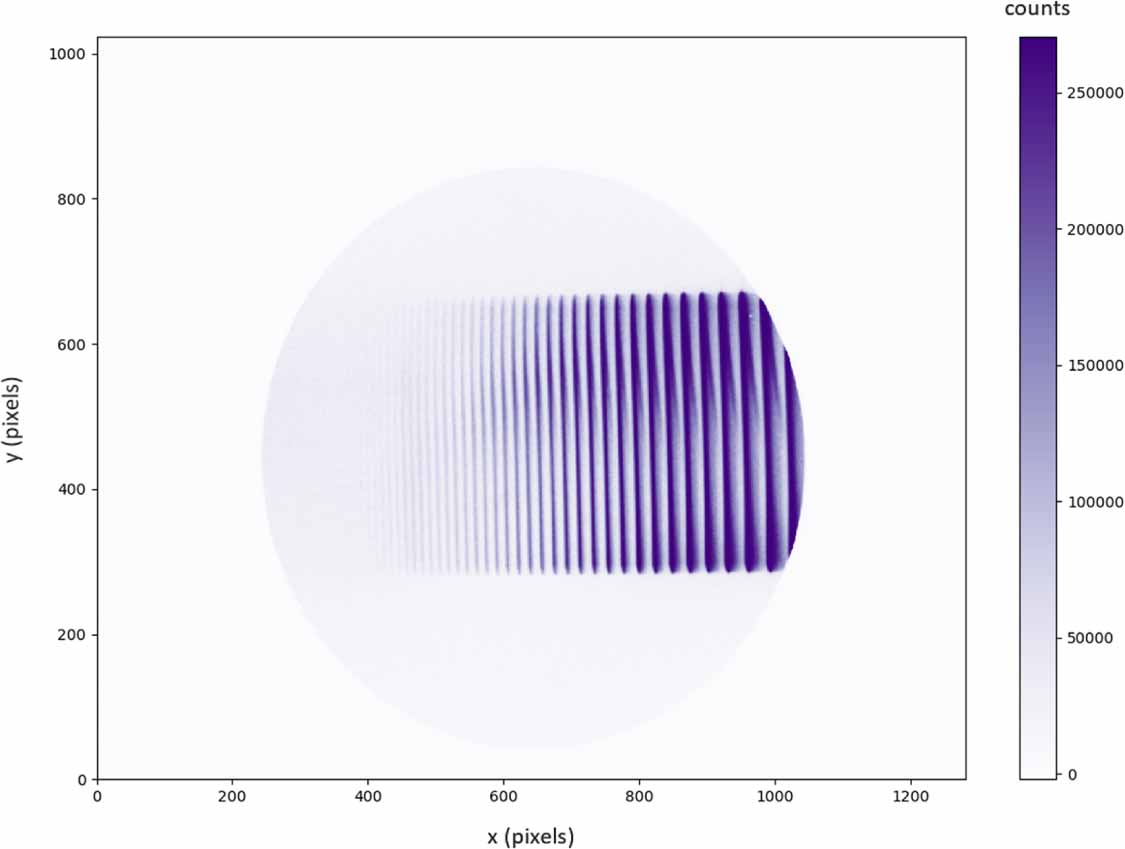
Figure A2. Spatial distribution of the HHG cutoff spectrum generated in 250 mbar of neon at 800 nm. These are the raw data collected at the phosphor screen after spectral dispersion of the HHG beam by the grating (position values along the uncalibrated pixel axis). Smaller pixel numbers along the x axis correspond to higher photon energies. Even though the simulations show a near-field confinement of the high energies at outer radii, the measurement shows a rather homogeneous distribution in the far-field, as a result of the energy redistribution at high divergence (the detector is at ca. 3 m from the source point of generation). The sharp horizontal cuts are caused by the limited vertical dimension (15 mm) of the toroidal mirror. Even though near-field simulations show a cutoff generation off-axis, the far-field measurements and simulations do not indicate loss of these energies with propagation.
Figure A2. Spatial distribution of the HHG cutoff spectrum generated in 250 mbar of neon at 800 nm. These are the raw data collected at the phosphor screen after spectral dispersion of the HHG beam by the grating (position values along the uncalibrated pixel axis). Smaller pixel numbers along the x axis correspond to higher photon energies. Even though the simulations show a near–field confinement of the high energies at outer radii, the measurement shows a rather homogeneous distribution in the far–field, as a result of the energy redistribution at high divergence (the detector is at ca. 3 m from the source point of generation). The sharp horizontal cuts are caused by the limited vertical dimension (15 mm) of the toroidal mirror. Even though near-field simulations show a cutoff generation off–axis, the far–field measurements and simulations don’t indicate loss of these energies with propagation.
Download figure:
Standard image High-resolution imageThe simulation code employed in this work calculates the response of each atom of the target using the Lewenstein model (SFA, and saddle-point method) [33]. The single-atom response is introduced as source term into the Maxwell equations governing the propagation of the fundamental and harmonic beams, which are solved in cylindrical coordinates assuming radial symmetry [32]. For the fundamental beam, the following equation holds:
with ![$}} = }}\left( \right)}}}}}}} \right]^}$](https://content.cld.iop.org/journals/2515-7647/8/1/015057/revision2/jpphotonae4080ieqn2.gif) being the plasma frequency depending on the free-electron density
being the plasma frequency depending on the free-electron density  defined by the Lewenstein model and calculated applying the correction to the ADK model discussed below. The equation is solved in paraxial approximation, taking into account both temporal plasma-induced phase modulation and spatial plasma lensing effects on the fundamental beam. For the harmonic beam, the propagation equation is the following:
where ![$}}} = \left[ - }}\left( \right)} \right]}}}\left( \right)$](https://content.cld.iop.org/journals/2515-7647/8/1/015057/revision2/jpphotonae4080ieqn4.gif) is the non-linear polarization generated in the gas,
is the non-linear polarization generated in the gas,  is the non-linear dipole moment as from SFA model,
  is the neutral atom density and
  is the free-electron density, changing along the propagation direction
  over time and radial coordinate.
When operating at the high intensities required for the overdriven regime, particular care is required in defining the ionization rate [58]. Under this condition, and particularly for short near-infrared wavelengths, the ionization rate is well described by the ABI model [53], whilst the ADK model [49] typically used to depict the tunnel ionization mechanism breaks down. Ideally, a high-intensity regime would require an exact calculation of the static ionization rates, which, however, is extremely computationally demanding. To overcome this complexity, several approximation or numerical methods have been developed in the years [47, 48, 58, 59]. We employed the empirically corrected ADK (E-ADK) ionization rate introduced in [47]. Following literature results [48], we further corrected the ionization rate of this model, which is overestimated by a factor two, as follows:
with  being the ADK rate as in [49],
  being the charge seen by the active electron (single ionization),
  for Ar and Ne and
Comments (0)