Collection of clinical samples
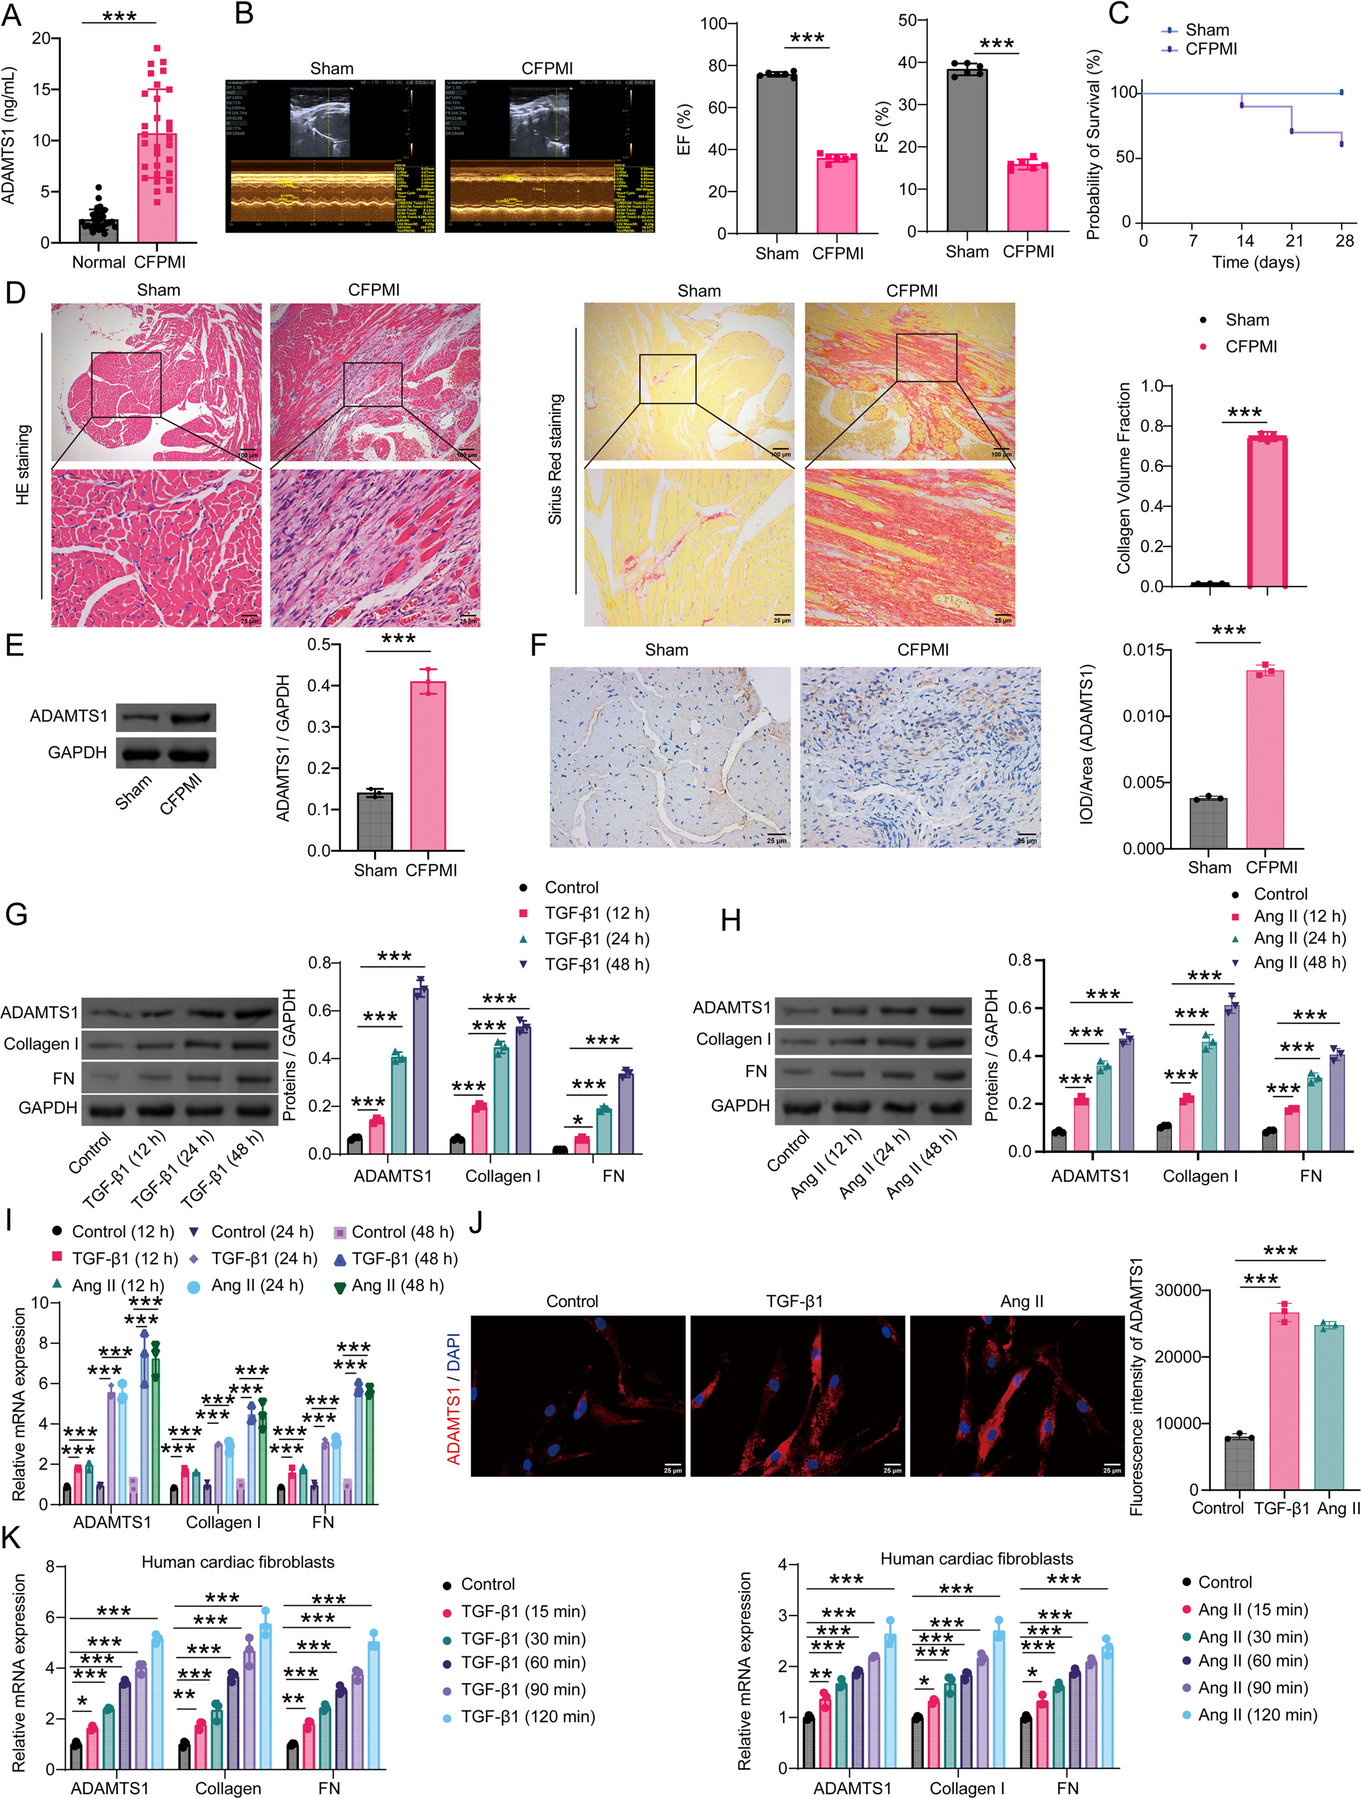
Blood samples were collected from clinical patients with myocardial fibrosis at Changsha Central Affiliated Hospital. Altogether, 30 blood samples from such patients, collected between January 2024 and June 2024, were included. The baseline characteristics of the cardiac fibrosis patients are shown in Table S1. All subjects received secondary prevention drug therapy for coronary heart disease. Representative cardiac MR images of short-axis view sections through the left ventricular lateral and inferior endocardium of cardiac fibrosis patients are shown in Figure S1. Blood samples from 30 age-matched disease-free individuals were used as healthy controls. All the samples were grouped into the Normal group or the CFPMI group. Myocardial fibrosis was diagnosed on the basis of history, physical examination, cardiac function and delayed gadolinium enhancement on cardiac magnetic resonance imaging. For subsequent experiments, serum samples were collected and cryopreserved at −80 °C.
Animals
SPF-grade C57BL/6 male mice (8–12 weeks) were procured from Slac Jingda Laboratory Animal Co., Ltd. All mice were housed in a controlled facility with a 12-h light/dark cycle at 23 ± 3 °C. To avoid the influence of estrogen fluctuations in female mice, male mice were selected to ensure the consistency of the results of this study. After the animals were in place, formal experimental procedures were initiated following one week of adaptive feeding.
Group 1: Mice were randomized into a Sham group and a CFPMI group, with 6 mice/group. When designing the experiment, we referred to the sample sizes of previous similar studies and determined that each group required at least six mice based on statistical requirements (such as power analysis) (Hayasaka et al. 2025; Li et al. 2025). All operations and analyses were performed in a blinded manner. The CFPMI mouse model was constructed with reference to previous studies (Weng et al. 2023). The mice were anesthetized with 3% isoflurane for a short time and then inhaled 1.5% isoflurane to maintain anesthesia. Each mouse’s left chest region was shaved and disinfected, and the mice were fixed in a supine position. Following endotracheal intubation, the mice were connected to a small-animal dedicated ventilator. The opening was 1 cm ± at the most obvious location of the heartbeat in the left chest. Subcutaneous fascia and muscles were dissected to fully expose the 3rd and 4th ribs. The intercostal muscles were cut across three or four intercostal spaces, the pericardium was incised to expose the heart, and the opening was secured with a spinner. The left anterior descending coronary artery (LAD) was quickly ligated using a No. 8 sterile band suture needle. The needle was inserted at the lower edge of the left atrial appendage, and the needle was removed from the pulmonary artery (insertion depth 0.5–1 mm, width 2 mm). Chest gas was removed (to prevent pneumothorax), and the wound was quickly closed and disinfected. The mice were kept warm until they awoke. The same operation was performed on Sham mice without LAD ligature.
Group 2: Mice were randomized into the Sham, CFPMI, and CFPMI + sh-ADAMTS1 groups. Mice in the CFPMI + sh-ADAMTS1 group were injected with 100 μL of shRNA-ADAMTS1 lentivirus slowly through the tail vein before surgery, and the lentivirus titer was 1 × 10⁸ TU/mL. In contrast, mice in Sham and CFPMI groups were injected with adeno-associated virus (AAV) shRNA at the same dose as the control through the tail vein.
Group 3: Mice were randomized into the Sham, CFPMI, CFPMI + anti-ADAMTS1, CFPMI + sh-HDAC6, and CFPMI + anti-ADAMTS1 + sh-HDAC6 groups. After CFPMI model establishment, mice in CFPMI + anti-ADAMTS1 group were administered 10 mg/kg anti-ADAMTS1 monoclonal antibody (ab134430, Abcam) via intraperitoneal injection once a week for 4 weeks (Wang et al. 2021). The ADAMTS1 antibody (ab134430, Abcam) used in this study is a specific monoclonal antibody targeting the ADAMTS1 protein. It specifically recognizes the extracellular domain of ADAMTS1, enabling specific targeting and blocking of its pathological functions. ADAMTS1 is primarily localized to the ECM and cell membrane, with its main biological effects exerted through extracellular interactions that regulate cellular behaviors (Li et al. 2025; Kong et al. 2025). Although the ADAMTS1 antibody cannot penetrate cells, it effectively inhibits the extracellular actions of ADAMTS1, thereby attenuating its regulatory effects on the ECM and cellular behaviors. The mice in the CFPMI + sh-HDAC6 group and the CFPMI + anti-ADAMTS1 + sh-HDAC6 group were injected with 100 μL of shRNA-HDAC6 lentivirus slowly through the tail vein before surgery, and the lentivirus titer was 1 × 10⁸ TU/mL. AAV shRNA lentivirus were utilized for the knockdown of ADAMTS1 and HDAC6, owing to their high transfection efficiency, low immunogenicity, suitability for long-term expression, and ability to efficiently integrate into the host genome, thereby ensuring stable transgene expression. Mice in Sham and CFPMI groups were administered an equivalent dose of control AAV shRNA via tail vein. All the mice were subsequently housed in the animal facility and carefully fed for one week before being used for modeling. The experiment lasted for 4 weeks, and the mice were euthanized. Heart tissues were promptly excised and immersed in 4% paraformaldehyde for fixation. The hearts were cut into multiple cross-sectional slices for subsequent histological analysis. Due to the 28-day fibrosis evaluation period (including assessments of cardiac function, hematoxylin‒eosin (HE) staining and picrosirius red staining, protein expression level at 28 days’ post-infarction, etc.), we excluded animals that died within 28 days after myocardial infarction. The sequences of the mouse AAV-sh-HDAC6 (HG-AAVSH010413, HonorGene) were as follows: GGCCAAGATTCTTCTACTAGA, AAV-sh-NC: TGCACAACACCCAGGTGGTGA.
Cell culture and treatment
Mouse cardiac fibroblasts (AW-YCM032, Abiowell) were cultured in fibroblast medium (AW-MC023, Abiowell), which consisted of fibroblast basal medium with 1% fibroblast additive, 10% fetal bovine serum, and 1% penicillin/streptomycin. Human cardiac fibroblasts (CP-H078, Procell) were cultured in human cardiac fibroblast cell complete medium (CM-H078, Procell), which contained all necessary components for the growth of human cardiac fibroblasts. This medium requires no additional supplements and can be directly used for in vitro culture. Human cardiac fibroblasts were incubated with 10 ng/mL TGF-β1 (HY-P78168, MCE) or 0.1 μM Ang II (HY-13948, MCE) for 12, 24, and 48 h to establish in vitro models, and mouse cardiac fibroblasts were treated with 10 ng/mL TGF-β1 (50698-M08H-B, Sino Biological) for 12, 24, and 48 h to establish in vitro models (Weng et al. 2023), which was divided into the following groups: the Control, TGF-β1/Ang II (12 h), TGF-β1/Ang II (24 h), and TGF-β1/Ang II (48 h) groups. Regarding the exposure of cells to Ang II or TGF-βunder serum-containing conditions, our experiment included a normal control (Control) group for the model. By setting up this Control group, we could eliminate potential influences of Ang II or TGF-β that might be present in the culture medium. After the optimal time point (48 h) was determined, the samples were further divided into the Control, TGF-β1 and Ang II groups. Next, we used 10 ng/mL TGF-β1 or 0.1 μM Ang II to induce human or mouse cardiac fibroblasts for 15, 30, 60, 90, and 120 min. We also used 10 ng/mL TGF-β1 to stimulate human and mouse cardiac fibroblasts for 12, 12, 24, 48, and 72 h. Furthermore, human and mouse cardiac fibroblasts were exposed to 10 ng/mL TGF-β1 for 48 h, and assigned to Control and TGF-β1 groups. Subsequently, we interfered with SMAD2 expression, with the groups designated as si-NC and si-SMAD2-1/2. After the best si-SMAD2 was selected, the cells were further divided into the si-NC, TGF-β1, si-SMAD2, and TGF-β1 + si-SMAD2 groups. Furthermore, we overexpressed ADAMTS1 and divided the cells into the oe-NC, TGF-β1, oe-ADAMTS1, and TGF-β1 + oe-ADAMTS1 groups. Additionally, we interfered with ADAMTS1 in the following groups: si-NC, si-ADAMTS1-1, and si-ADAMTS1-2. After the si-ADAMTS1 group was selected, the cells were further divided into the si-NC, TGF-β1, si-ADAMTS1, and TGF-β1 + si-ADAMTS1 groups. Moreover, 5 μM HDAC6 inhibitor ACY1215 was treated for 48 h (Ruan et al. 2021), assigned to si-NC, si-ADAMTS1, si-NC + ACY1215, and si-ADAMTS1 + ACY1215 groups. Additionally, changes in level of ubiquitinated HDAC6 protein in human and mouse cardiac fibroblasts transfected with oe-ADAMTS1/si-ADAMTS1 or oe-NC/si-NC in the presence of 10 μM MG132 were observed. We utilized siRNA technology to knock down ADAMTS1 (si-ADAMTS1) and set up a control group (NC). In human and mouse cardiac fibroblasts treated with si-ADAMTS1 and NC, proteasome inhibitor MG132 (10 μM) or DMSO (solvent control) were added respectively and incubated for 24 h. The groups were as follows: NC, MG132, si-ADAMTS1, and si-ADAMTS1 + MG132.
For the knockdown experiments of SMAD2 and ADAMTS1, we used siRNA fragments provided by HonorGene. The specific procedures were as follows: siRNAs were transfected into target cells via Lipofectamine 2000 (11668019, Invitrogen). The knockdown efficiency of SMAD2 and ADAMTS1 was verified 48 h after transfection. In addition, for the overexpression experiment of ADAMTS1, we used the overexpression plasmids provided by HonorGene. The specific procedures were as follows: oe-ADAMTS1 was transfected into the target cells via Lipofectamine 2000, and the overexpression efficiency of ADAMTS1 was verified 48 h after transfection. The sequences of the human interference fragment si-SMAD2 (HG-SH005901, HonorGene) were as follows: si-SMAD2-1: GACCCCCCGGATCTGACGGG; si-SMAD2-2: GAACTTCCGCCTCTGGATGAC. The sequences of the mouse interference fragment si-SMAD2 (HG-SM010754, HonorGene) were as follows: si-SMAD2-1: GCGCGCCCGCTCGGCCGGCG; si-SMAD2-2: GCGTCACAGCCCTCGCTCAC. The human overexpression fragment oe-ADAMTS1 (HG-HO006988) and the mouse overexpression plasmid oe-ADAMTS1 (HG-MC105434) were obtained from HonorGene. The sequences of the human interference fragment si-ADAMTS1 (HG-SH006988, HonorGene) were as follows: si-ADAMTS1-1: GCCACTCTGCCTGCGCC TGCCTC; si-ADAMTS1-2: GCGCCCCTCCGAGGAGGACGAG. The sequences of the mouse interference fragment si-ADAMTS1 (HG-Mi050834, HonorGene) were as follows: si-ADAMTS1-1: GCACACATGCTGTTGCTGCTCCTC; si-ADAMTS1-2: GA CCCCACGCCTCAGGACGCGG.
Conventional echocardiography and doppler imaging
Based on a previous study (Schiattarella et al. 2019), transthoracic echocardiography was conducted with a VisualSonics Vevo 2100 system coupled with an MS400 transducer. Diastolic function parameters were acquired from apical four-chamber views of anesthetized mice via pulsed-wave and tissue Doppler imaging at mitral valve level. Representative left ventricular M-mode echocardiograms were recorded, and ejection fraction (EF, reflecting the pumping efficiency of the heart with each contraction) and fractional shortening (FS, reflecting the degree of ventricle shortening during contraction) were calculated.
Enzyme-linked immunosorbent assay (ELISA)
ADAMTS1 levels in clinical serum samples were measured using an ADAMTS1 ELISA kit (CSB-E15060h, CUSABIO) following manufacturer’s protocol.
HE and picrosirius red staining
HE staining was utilized to evaluate cardiac morphological alterations. Sections were heated at 60 °C for 12 h, followed by immersion in xylene three times for 20 min each. Subsequently, they were transferred to gradient ethanol (from high to low concentration) for hydration, and then soaked in distilled water. Sections were then stained with hematoxylin, differentiated, and blued in PBS. Afterward, sections were stained with eosin, followed by dehydration in gradient ethanol (95% to 100%, increasing concentration) for 5 min per gradient. Finally, sections were transferred to xylene for transparency, mounted with neutral balsam, and observed under a light microscope.
Fibrosis in mouse heart tissue was assessed by picrosirius red staining. We primarily analyzed the fibrotic conditions of the infarcted and non-infarcted areas. Using picrosirius red staining, we assessed collagen deposition in these two areas. Specifically, we analyzed the degree of fibrosis at the edge of infarct area and in the non-infarcted area to comprehensively evaluate the changes in fibrosis. Sections were heated at 60 °C followed by immersion in xylene. Subsequently, sections were subjected to gradient ethanol (from high to low concentration) for hydration and then rinsed thoroughly with distilled water. Thereafter, sections were stained with picrosirius red staining solution for 5–10 min. Finally, sections were air-dried thoroughly, cleared with xylene, and mounted with neutral balsam for microscopic observation. We used the ImageJ software to quantitatively analyze the picrosirius red-stained sections to assess the area of the fibrotic region. Each group should have at least three independent samples. The specific steps are as follows: Use a microscope to take pictures of Sirius red-stained sections, ensuring that the magnification and exposure time of all images are consistent. Set a threshold based on the depth of staining to separate the fibrotic area (the red-stained area) from the background. Use the “Measure” function of ImageJ to calculate the area of the fibrotic region and express it as a percentage (fibrotic region area/total tissue area).
Immunohistochemistry (IHC)
ADAMTS1, p-SMAD2, and HDAC6 levels in mouse heart tissues were evaluated using IHC. Sections were heated at 60 °C for 12 h, followed by immersion in xylene. Subsequently, sections were sequentially immersed in 100%, 95%, 85%, and 75% ethanol for 5 min per concentration for hydration. Thereafter, antigen retrieval was conducted via heat treatment. Endogenous peroxidase activity was blocked with 1% periodic acid. Primary antibodies against ADAMTS1 (12,749–1-AP, 1:200, Proteintech), p-SMAD2 (Ab280888, 1:200, Abcam), and HDAC6 (bs-2811R, 1:200, Bioss) were diluted appropriately and incubated with sections at 4 °C overnight. Subsequently, 50–100 μL of HRP-conjugated anti-rabbit IgG secondary antibody was incubated at 37 °C for 30 min. Thereafter, DAB chromogen working solution (50–100 μL per section) was added for color development, and the reaction process was monitored under a microscope to control the staining intensity. Sections were then counterstained with hematoxylin and blued in PBS. Next, sections were dehydrated via a graded ethanol series (60%, 75%, 85%, 95%, 100%) for 5 min per concentration. Finally, sections were cleared in xylene twice for 10 min each, mounted with neutral balsam, and observed under a light microscope.
Western blot
Total protein was isolated from cells and mouse heart tissues, and ADAMTS1, Collagen I, fibronectin (FN), SMAD2, p-SMAD2, α-SMA, HDAC6 and TGF-β1 levels were determined via Western blot. Briefly, total protein was extracted using RIPA buffer (AWB0136, Abiowell). Equal amounts of protein (20 μg per lane) were separated by SDS‒PAGE and electrotransferred onto nitrocellulose membranes. Subsequently, membranes were blocked with 5% non-fat dry milk. The blocked membranes were incubated overnight at 4 °C with the following primary antibodies: ADAMTS1 (ab236497, 1:2000, Abcam), Collagen I (ab270993, 1:1000, Abcam), FN (AWA00143, 1:1000, Abiowell), SMAD2 (12,570–1-AP, 1:5000, Proteintech), p-SMAD2 (ab280888, 1:1000, Abcam), α-SMA (ab5694, 1 μg/ml, Abcam), HDAC6 (128,341-AP, 1:1000, Proteintech), TGF-β1 (AWA00083, 1:1000, Abiowell), and GAPDH (10,494–1-AP, 1:5000, Proteintech) at 4 °C overnight. The membrane was then incubated with HRP-conjugated goat anti-mouse/rabbit IgG (SA00001-1/SA00001-2, 1:5000/1:6000, Proteintech) for 1.5 h. Protein bands were visualized by incubating membranes with enhanced ECL reagent (AWB0005, Abiowell) for 1 min, followed by imaging with a chemiluminescence imaging system. The original images are shown in Figure S2.
Quantitative real-time PCR (qRT‒PCR)
ADAMTS1, Collagen I, FN, SMAD2 and HDAC6 levels were determined using qRT-PCR. Briefly, total RNA was extracted from samples with TRIzol total RNA extraction kit (15,596,026, Thermo). The concentration and purity of the extracted RNA were determined with NanoDrop spectrophotometer. Subsequently, cDNA was synthesized from mRNA by reverse transcription kit (CW2569, CWBIO). qRT-PCR was conducted on an ABI 7900 Real-Time PCR System using Ultra SYBR Master Mix (CW2601, CWBIO) to quantify gene expression levels. GAPDH acted as internal reference, and target gene levels were calculated using 2−△△Ct method. Primer sequences are shown below: H-ADAMTS1-F: CTAAAGCATTACCTTCTCACGTT, H-ADAMTS1-R: CGGCCCCTTCTGTTCATCG; H-Collagen I-F: GCAAGAACCCCGCCCGCACC, H-Collagen I-R:GCTCTCGCCGAACCAGACATGCC; H-FN-F: ATTCACCTACAATGGCAGGACGTT, H-FN-R: GCACCAAAGATGTCCGTCCTGT; H-SMAD2-F: TGCATCACAGCCCTCACTCAC, H-SMAD2-R: CTTGTCATTTCTACCGTGGCAT; H-HDAC6-F: CTCAACAGAAACACCGCATCCG, H-HDAC6-R: CCAGAACCTACCCTGCTCGT; H-GAPDH-F: ACAGCCTCAAGATCATCAGC, H-GAPDH-R: GGTCATGAGTCCTTCCACGAT; M-SMAD2-F: CTACACCCACTCCATTCC, M-SMAD2-R: GCAGGTTCCGAGTAAGTAA; M-HDAC6-F: GTCATCCAAGTCCATCGCAAA, M-HDAC6-R: CTATGGTCTTCCTCACGCTTT; M-ADAMTS1-F: AAGAATCCGCAGCTTTAGTCC,M-ADAMTS1-R: CCCCACTCTTCAATCACCCAC; M-GAPDH-F: GCGACTTCAACAGCAACTCCC, M-GAPDH-R: CACCCTGTTGCTGTAGCCGTA.
Immunofluorescence (IF)
Vimentin (VIM), HDAC6, ADAMTS1, p-SMAD2, Collagen I, and FN levels in cultured cells were determined via IF staining. Briefly, cells grown on glass slides were fixed with 4% paraformaldehyde at room temperature. Fixed cells were then permeabilized with 0.3% Triton X-100 in PBS to facilitate antibody penetration. Subsequently, non-specific binding sites were blocked with 5% BSA. Primary antibodies against VIM (10,366–1-AP, 1:200, Proteintech), HDAC6 (12,834–1-AP, 1:50, Proteintech), ADAMTS1 (12,749–1-AP, 1:50, Proteintech), FN (AWA10327, 1:50, Abiowell), Collagen I (ab138492, 1:200, Abcam), and p-SMAD2 (ab280888, 1:50, Abcam) were incubated at 4 °C overnight. Goat anti-mouse IgG (H + L) (AWS0003a, Abiowell) or goat anti-rabbit IgG (H + L) (AWS0006a/AWS0005a, Abiowell) (50–100 μL) was incubated for 90 min at 37 °C. Furthermore, cell nuclei were counterstained with DAPI for 10 min. Finally, slides were mounted with anti-fade buffered glycerol, sealed, and either stored at 4 °C in the dark or immediately imaged under a fluorescence microscope.
Chromatin immunoprecipitation (ChIP)
Binding of SMAD2 to ADAMTS1 was verified by ChIP. Cells were fixed in 1% formaldehyde (10 min, room temperature) for protein-DNA crosslinking. Subsequently, chromatin was isolated, and genomic DNA was sheared randomly into 200–800 bp fragments via ultrasonication and immunoprecipitated with targeted protein-specific antibodies against SMAD2. For the purposes of purifying and eluting ChIP DNA, one hundred microlitres of H2O was applied. A total of 2.5 μL of ChIP-DNA was subjected to qRT‒PCR. SMAD2 enrichment in the ADAMTS1 gene promoter was assessed with different primers: H-ADAMTS1-F: CTTCCGCCCCTAGATTGACGAG, H-ADAMTS1-R: CTCCTCCCCTTTGGCCCTT; M-ADAMTS1-F: CTGTTTCGGCGTCTTACACCC, M-ADAMTS1-R: CCGCCCCTTTATAGCCACA.
Co-immunoprecipitation (Co-IP)
Co-IP was used to assess whether ADAMTS1 and HDAC6 interact and whether ADAMTS1 and SMAD2 interact in cells. ADAMTS1 or HDAC6 antibodies were used as bait proteins, and ADAMTS1 and HDAC6 expression was assessed by Western blot. First, cells were collected for protein extraction. Subsequently, equal amounts of protein extracts were immunoprecipitated in RIPA buffer (AWB0136, Abiowell) containing ADAMTS1 and HDAC6 antibodies at 4 °C overnight. Following this, protein A/G agarose beads were introduced into immunoprecipitation mixture for 2 h. Subsequently, the mixture underwent three washing cycles. The immunoprecipitated sample was then resuspended in SDS‒PAGE buffer, subjected to boiling, resolved by SDS‒PAGE, and then blotted onto a nitrocellulose membrane. Membrane was initially probed with primary antibodies against ADAMTS1 (ab236497, 1:2000, Abcam) and HDAC6 (128,341-AP, 1:1000, Proteintech), followed by incubation with matching secondary antibodies. ECL solution was applied to the nitrocellulose membrane for 1 min, and a gel imaging system was used for imaging.
Statistical analysis
All statistical evaluations were carried out via GraphPad Prism 8.0. Quantitative data were denoted as the mean ± standard deviation (SD). The Kolmogorov‒Smirnov test combined with exploratory descriptive statistics was applied to assess the normality of data distribution and the homogeneity of variance. Subsequent analyses verified that the dataset followed a normal distribution pattern and displayed homogeneous variance. Parametric tests were applied for data analysis. When comparing two independent groups, we used unpaired Student’s t-tests; for comparisons involving multiple groups, one-way ANOVA was followed by Tukey’s post hoc test. To assess group differences across different time points, two-way ANOVA was performed with Bonferroni correction as the post hoc test. The analysis results were reported using three key metrics: degrees of freedom, sum of squares, and mean sum of squares. Statistical significance was indicated by P < 0.05.


Comments (0)