
Remember me
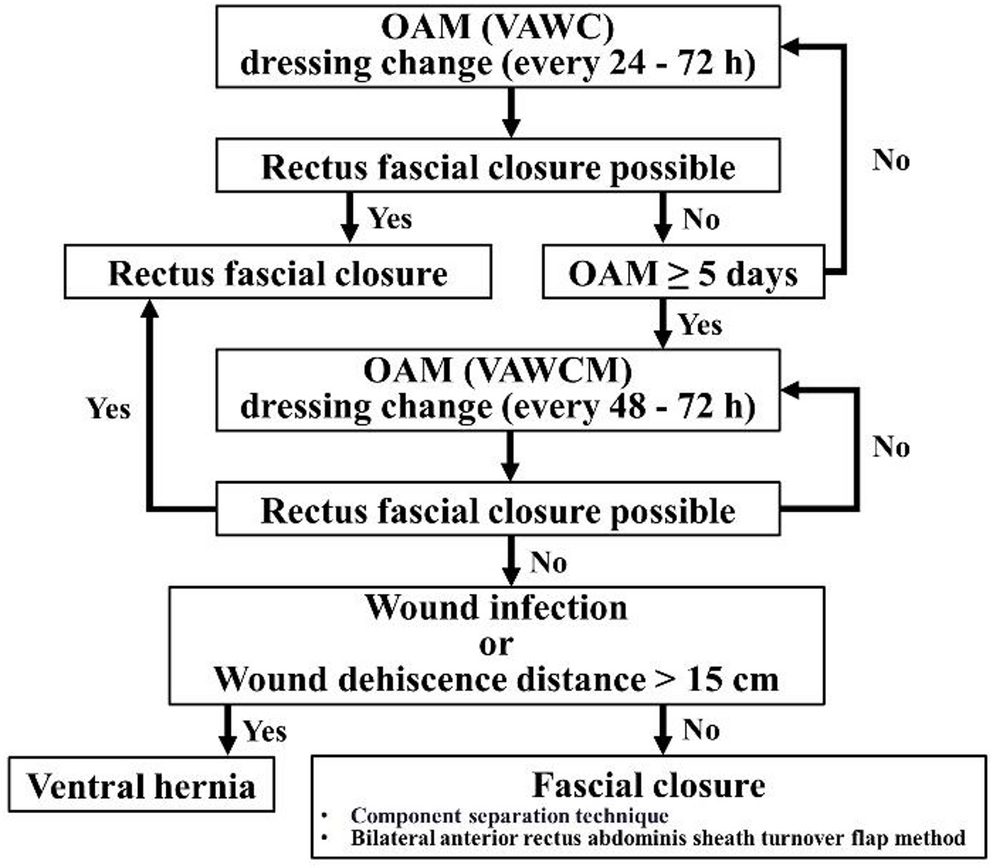
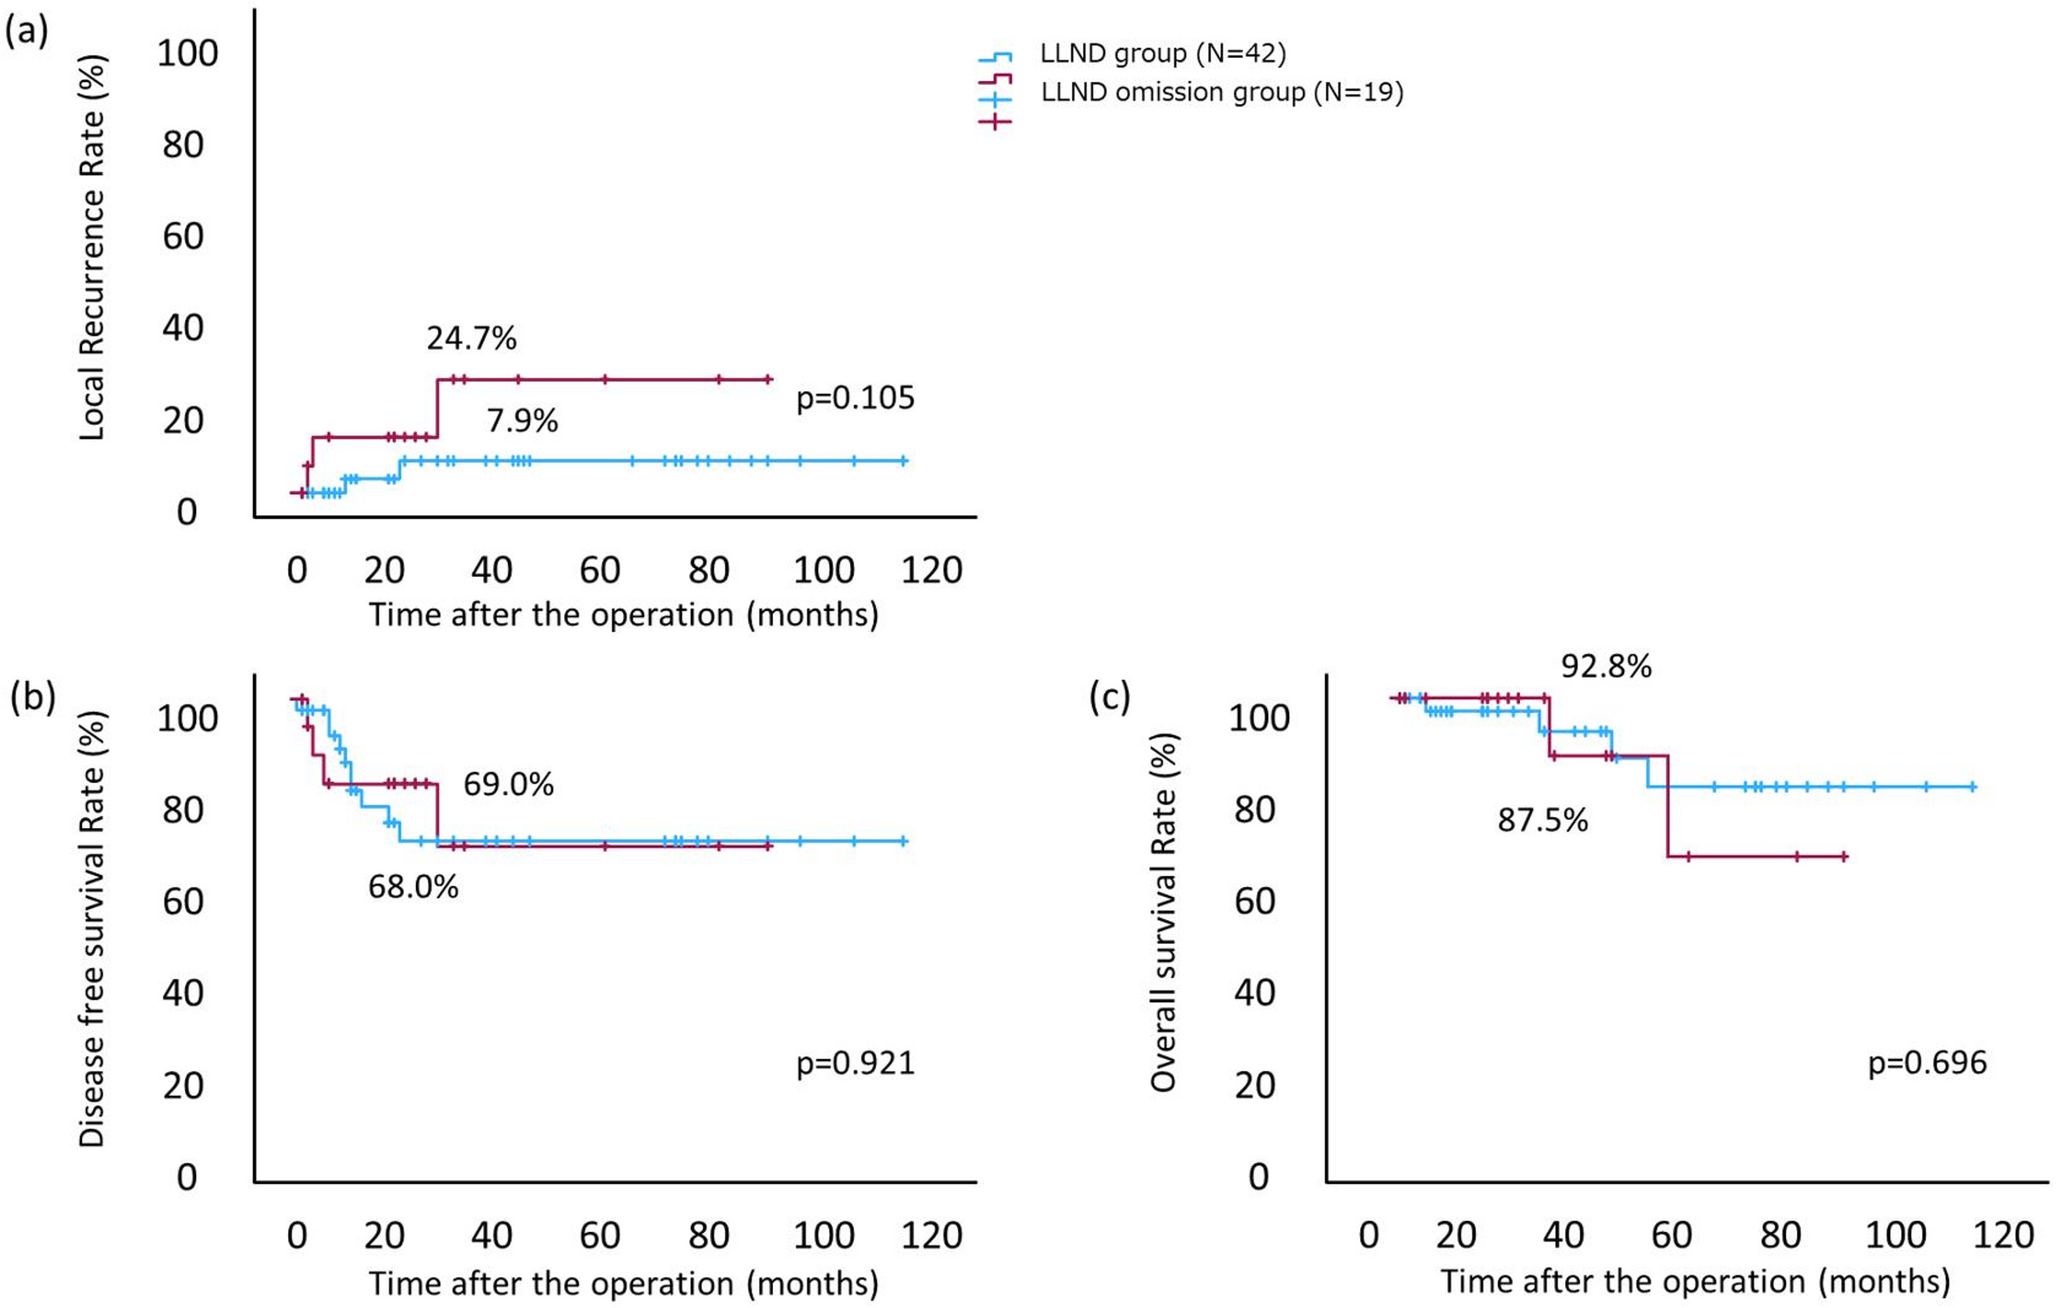


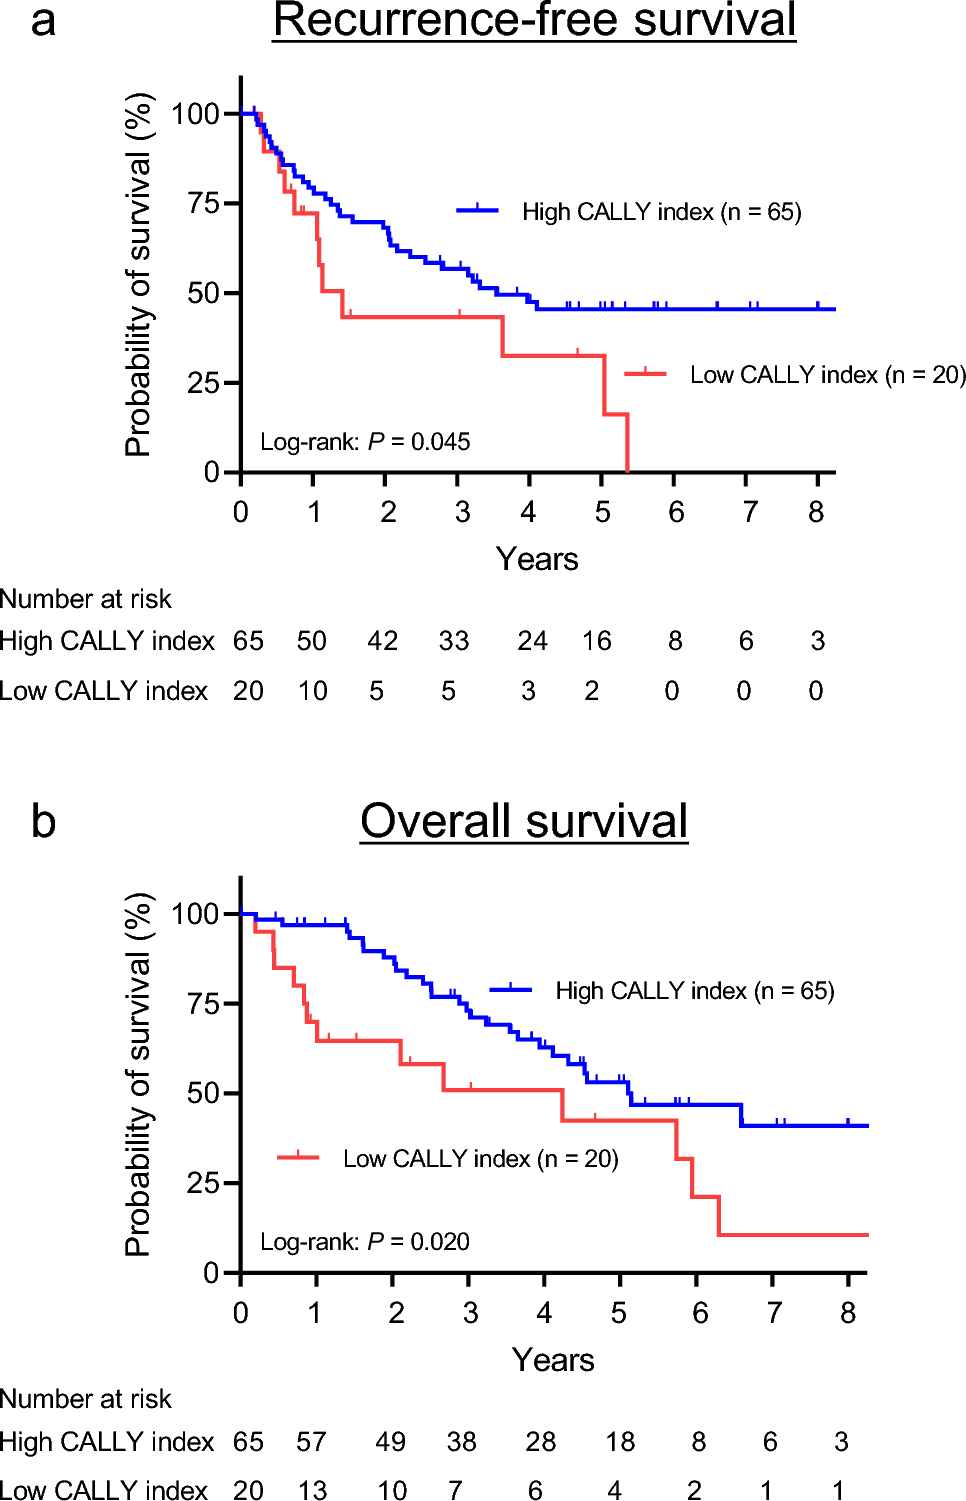
Table 1 presents an overview of retrograde drain infection. Retrograde drain infection developed in 5.5% (46/842) of the patients. The infection manifested as elevated inflammatory responses, with a median white blood cell count (WBC) of 10,300/µL (IQR 8100–12100/µL) and a median C-reactive protein (CRP) level of 9.1 mg/dL (IQR 5.6–14.1 mg/dL). Common clinical findings included fever (35/46, 76.1%), redness or swelling (34/46, 73.9%), pain or tenderness (31/46, 67.4%), and purulent discharge (30/46, 65.2%). All these patients were treated with antibiotic therapy and there was no mortality. The infection depth was superficial/deep in 30 patients and organ/space in 16. Bacterial cultures were performed in 25 of these 46 patients. All detected bacteria were skin commensals, with methicillin-susceptible Staphylococcus aureus (32.6%) being the most common, followed by Pseudomonas aeruginosa (15.2%) and methicillin-resistant S. aureus (MRSA) (6.5%). Most (84.8%; 39/46) of the drain infections were diagnosed on POD 7 or later (Fig. 2a). Over the years, earlier drain removal within 7 days has become more common (2010–2014: 15.7%, 2015–2018: 27.7%, 2020–2022: 68.0%) (Fig. 2b), and infection rates have decreased accordingly (2010–2014: 7.1%, 2015–2018: 5.1%, 2020–2022: 3.9%) (Fig. 2c). This suggests that prolonged drain placement increases infection risk.
Table 1 Overview of retrograde drain infection (n = 46)Fig. 2
Timing of retrograde drain infection onset and its relationship with drain duration and infection frequency across the surgical periods in this study. (a) 84.8% (39/46) of drain infections were diagnosed on postoperative day (POD) 7 or later. (b) The percentage of patients with drains removed within 7 days increased significantly over time. (2010–2014: 15.7%, 2015–2018: 27.7%, 2020–2022: 68.0%) (c) The retrograde infection rate tended to decrease accordingly (2010–2014: 7.1%, 2015–2018: 5.1%, 2020–2022: 3.9%)
Risk factors for retrograde drain infectionTo assess the factors influencing retrograde drain infection, clinical, tumor, and surgical factors were compared between patients with and those without infection (Table 2). Male patients had a significantly higher infection rate than female patients (6.9% [35/509] vs. 3.3% [11/333], P = 0.026). However, no significant differences were found in body mass index, preoperative therapy, history of abdominal surgery, smoking, steroid use, or comorbidities. There were also no significant differences in tumor-related factors, including distance from the anal verge, tumor stenosis, and pathological stage. Surgical factors such as bowel preparation, surgical approach, anastomosis type, operative time, bleeding, intraoperative blood transfusion, rate of combined resection of other organs, presence of diverting stoma, rate of lateral pelvic lymph node dissection, and the incidence of a positive radial margin did not differ significantly.
Table 2 Comparison of clinical, tumor, and surgical factors between patients with vs. those without retrograde drain infectionTo evaluate the independent risk factors further, a multivariable logistic regression analysis was performed using five prespecified variables (sex, body mass index, diabetes, operative time, and surgical period), selected based on clinical relevance. In this model, male sex remained an independent risk factor for retrograde drain infection (adjusted odds ratio 2.22, 95% confidence interval 1.13–4.70, P = 0.03), but the other variables were not significantly associated with infection (Table 3).
Table 3 Multivariable logistic regression analysis of risk factors for retrograde drain infectionImpact of the postoperative hospital stayPatients with retrograde drain infections had significantly longer hospital stays [median 22 (IQR 18–28) vs. 16 (IQR 13–19) days, P < 0.001] (Table 4). To identify whether drain infection was independently associated with prolonged hospitalization, we performed a multivariable linear regression analysis adjusting for clinically relevant pre- and intraoperative factors (age, sex, operative time, surgical approach, diverting stoma, and surgical period). The results demonstrated that retrograde drain infection remained an independent factor associated with longer hospital stays (Supplementary Table 1).
Table 4 Analysis of the postoperative hospital stayNext, we investigated the relationship between the timing of drain removal and hospital stays in patients with a retrograde drain infection. After the diagnosis of retrograde drain infection, 11 had immediate removal, while 35 had delayed removal (11 of these patients had their drains replaced with a new open drain). Because there are no established guidelines for the management of retrograde drain infection, the decision regarding immediate or delayed removal depended on the clinical judgment of the responsible surgeon. WBC, CRP, and infection depth did not differ significantly, but hospital stay was shorter in the immediate removal group [median 18 (IQR 14–24) vs. 23 (IQR 19–30) days, P = 0.03] (Table 4).
Anastomotic leakagePostoperative anastomotic leakage developed in 10 patients (1.2%) and was diagnosed within 7 days in 7 of these patients, with 6 cases detected by changes in drain content. Leakage was identified after drain removal in five patients, triggered by fever, abdominal pain, or elevated inflammatory markers. Five patients required emergency surgery, including stoma creation, while five were managed conservatively. Notably, two patients (no. 3 and no. 5) without a diverting stoma at primary surgery were treated successfully with drain management, avoiding stoma creation (Table 5).
Table 5 Diagnosis and treatment summary of the 10 patients with anastomotic leakageOncological impactThe median follow-up period was 59.7 months for patients with a drain infection and 60.4 months for those without a drain infection. In the prognostic analysis, patients with a retrograde drain infection were stratified into superficial/deep (n = 29) and organ/space (n = 17) subgroups.
Supplementary Table 2 summarizes the pathological stage distributions. While the organ/space group tended to include a higher proportion of patients with pStage III disease than the superficial/deep group, the overall distribution was broadly similar to that of the no infection group. The organ/space drain infection group had significantly worse recurrence-free survival (RFS) for stage I–III disease (5-year RFS: 79.2% no infection, 85.0% superficial/deep, 55.0% organ/space, P = 0.04) (Fig. 3a). Overall survival (OS) analysis showed no significant differences for stage I–III disease (5-year OS: 92.3% without infection, 91.4% superficial/deep, 79.6% organ/space, P = 0.65) or across all stages (5-year OS: 87.7% no infection, 88.3% superficial/deep, 69.8% organ/space, P = 0.42) (Fig. 3b and c).
Fig. 3
Kaplan–Meier survival curves comparing patients with no drain infection, those with superficial/deep infection, and those with organ/space infection. (a) Recurrence-free survival of patients with Stage I–III disease (b) Overall survival of patients with Stage I–III disease (c) Overall survival irrespective of stage
Comments (0)