
Remember me


Our new health economics model was informed by relevant best practice and validated guidelines. These included the Consolidated Health Economic Evaluation Reporting Standards (CHEERS) and the International Society for PharmacoEconomics and Outcomes Research guidelines for good modelling practice [11, 12]. The data sources used in the new model included MSBase Australian data, 2025 AMSLS Health Economic Impact Report, and 2020 AMSLS Quality of Life Survey (Table 1).
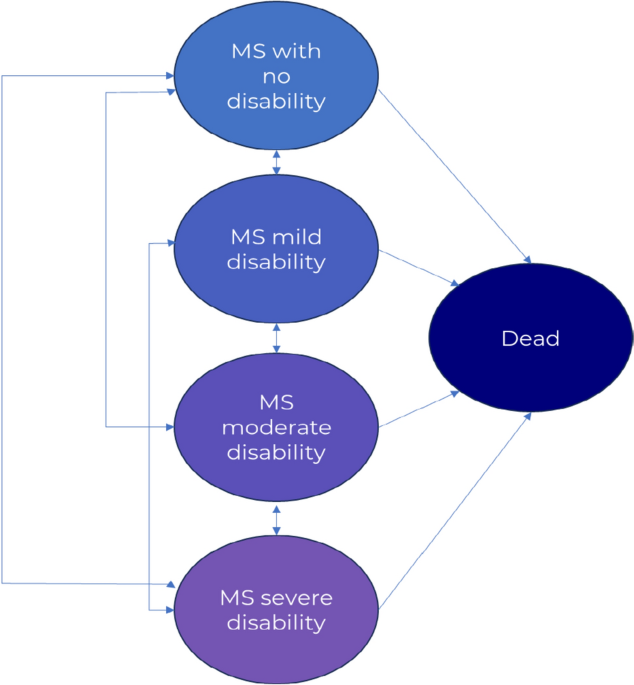
Table 1 Difference in input data between the updated and previous MS simulation model2.2 Model StructureFigure 1 provides the conceptual diagram for our new five-state Markov model of MS progression, where ovals represent health states considered in the model and directions of arrows indicate allowable transitions. We developed this new Markov state-transition model using more granular and updated Australian data to simulate the progression of disability for a hypothetical cohort of PwMS. The health states of the new model were generated from a large cohort of Australians from the neurologist-driven MSBase database and classified as no disability (EDSS level 0.0), mild disability (EDSS 1.0–3.5), moderate disability (EDSS 4.0–6.0), and severe disability (EDSS 6.5–9.5) [13]. Any health state was allowed to transition to itself, or to other health states including death. Death was an absorbing state, with no possibility of any further transitions.
Fig. 1
Conceptual diagram of the 5-state Markov model of MS. Ovals represent health states considered in the model, and arrows indicate allowable transitions. The health states of the new model were generated from a large cohort of Australians from the neurologist-driven MSBase database and were classified as no disability (EDSS level: 0.0), mild disability (EDSS 1.0–3.5), moderate disability (EDSS 4.0–6.0), and severe disability (EDSS 6.5–9.5). Any health state was allowed to transition to itself, or to other health states, including death. Death was an absorbing state, with no possibility of any further transitions. Transient relapse events can occur from each state, the probability of which is state dependent. EDSS Expanded Disability Status Scale, MS multiple sclerosis
The health economic model used the cohort simulation approach and was programmed in TreeAge Pro. In the primary analysis, simulations were run for women aged 35 years, starting with no disability at baseline. This was consistent with the previous model, given that the typical age of onset of MS in Australia falls between 30 and 40 years and roughly three out of four PwMS are women. The model was run for 75 cycles, with each cycle representing 1 year. Key model outcomes (i.e. life expectancy, undiscounted and discounted QALYs, and discounted total lifetime costs of MS) were projected over a lifetime horizon from the age of 35 years to reflect the chronic nature of MS. The cohort started in the no disability health state, and in any given cycle, a simulated person’s disease state could worsen (except for the severe disability health state), improve (except for the no disability health state), or stay the same. Furthermore, a participant could die in any cycle, with the probability of death dependent on which disability severity state they were in.
2.3 Model InputsWe updated the model input parameters using Australian-specific contemporary cost and health outcomes data that matched the more granular health states of our new model [3, 13, 14]. The differences in input data between our previous and new model are shown in Table 1 and described in detail below. Tables 2 and 3 summarise the specific input data parameters for this updated model, as outlined in Sects. 2.3.1, 2.3.2, 2.3.3, 2.3.4, and 2.3.5.
Table 2 Annual transition probability matrix for transitions amongst disability states from Campbell et al. [13]Table 3 Key input parameters of the Markov model2.3.1 Transition ProbabilitiesAnnual transition probabilities were allocated for the flow of patients between the four disability states over a 1-year cycle. Transition probabilities were estimated for combined MS phenotypes including RRMS and all forms of progressive MS using the MSBase Australian participants (Table 2) [13].
We assumed that MS with no disability had the same mortality rate as the Australian general population. After developing an MS-related disability, relative mortality risks were applied to the Australian general female population mortality rate by multiplying it with 1.60, 1.84, and 4.44 for mild, moderate, and severe MS-related disability, respectively [15].
2.3.2 CostsDisability-level state-specific direct, indirect, and informal care costs were included in the model. Direct costs included prescription and non-prescription medications, supplements and over-the-counter drugs, durable and disposable equipment, consultations, diagnostics and procedures, hospital admissions, nursing services, household and personal services, home and car alterations, memberships and subscriptions, allied health, and transport. Indirect costs included those due to lost productivity from early retirement, changing to part-time work or unemployment, changing to lower-paid occupations, lost earnings while transitioning from one job to another, presenteeism (decreased productivity when at work), and absenteeism. Informal care costs were found to be a mixture of both direct and indirect costs and were subsequently classified separately in the 2025 report.
Costs used in the model were collected using surveys, cost diaries, and linked data. Respondents were asked to record all costs and resource use related to their MS on a daily basis over 6 months. Lost productivity costs due to absenteeism and presenteeism were measured using an employment survey.
A detailed description of the costing methodology can be found in our 2025 cost-of-illness report [3]. As the costs were presented in 2024 Australian dollars (AUD) in the original cost-of-illness report, we inflated the annualised 2024 costs to 2026 AUD using the Reserve Bank of Australia cost inflator website to inflate from years 2024 to 2025 (the last year Reserve Bank of Australia inflation rates were available) [16] and the Australian Bureau of Statistics website to inflate from 2025 to 2026 [17].
The average costs per person were $79,581 in 2024 values ($84,357 in 2026 values), and were made up of 55% direct costs, 34% indirect costs, and 10% informal care costs.
Future costs incurred in the simulation were discounted 5% annually, following the Australian guidelines [18] (Table 3).
2.3.3 Health State Utility ValuesHSUs were generated using the AQoL multi-attribute utility instrument. Mean HSUs and their distributions were calculated for four disability categories (Table 3) and were used to generate lifetime (discounted at 5% annually and undiscounted) QALYs through the simulation model.
2.3.4 State-Specific Probabilities of Relapse and the Disutility of RelapseState-dependent relapse probabilities and the associated disutility adopted in the new model assumed that from each disability health state, MS-related relapse events could occur and induce disutility (representing the decrement in the mean HSU associated with an MS-related relapse). The state-specific probabilities of relapse were calculated using MSBase Australian participants and were weighted for both relapsing and progressive MS phenotypes, and decreased with increasing severity of disability, which is highly correlated with age. The disutility was estimated for relapse onset MS, which included both relapse in RRMS and SPMS [14]. We calculated the lifetime number of relapse events for the simulated cohort from the baseline age of 35 years.
2.4 Sensitivity AnalysesOne-way sensitivity analyses were performed to investigate the impact of individually varying inputs on key model outcomes. Baseline age, transition probabilities, HSUs, relapse probabilities, and disutilities associated with relapse were varied by ± 10% of the point estimates of these parameters.
Second-order Monte Carlo simulation (probabilistic sensitivity analysis) was performed, and 10,000 samples were drawn from all distributions concurrently. The 10,000 Monte Carlo simulations refer to 10,000 random samples of all distributions within the model, ensuring that there was adequate sampling from each of these distributions.
Comments (0)