
Remember me

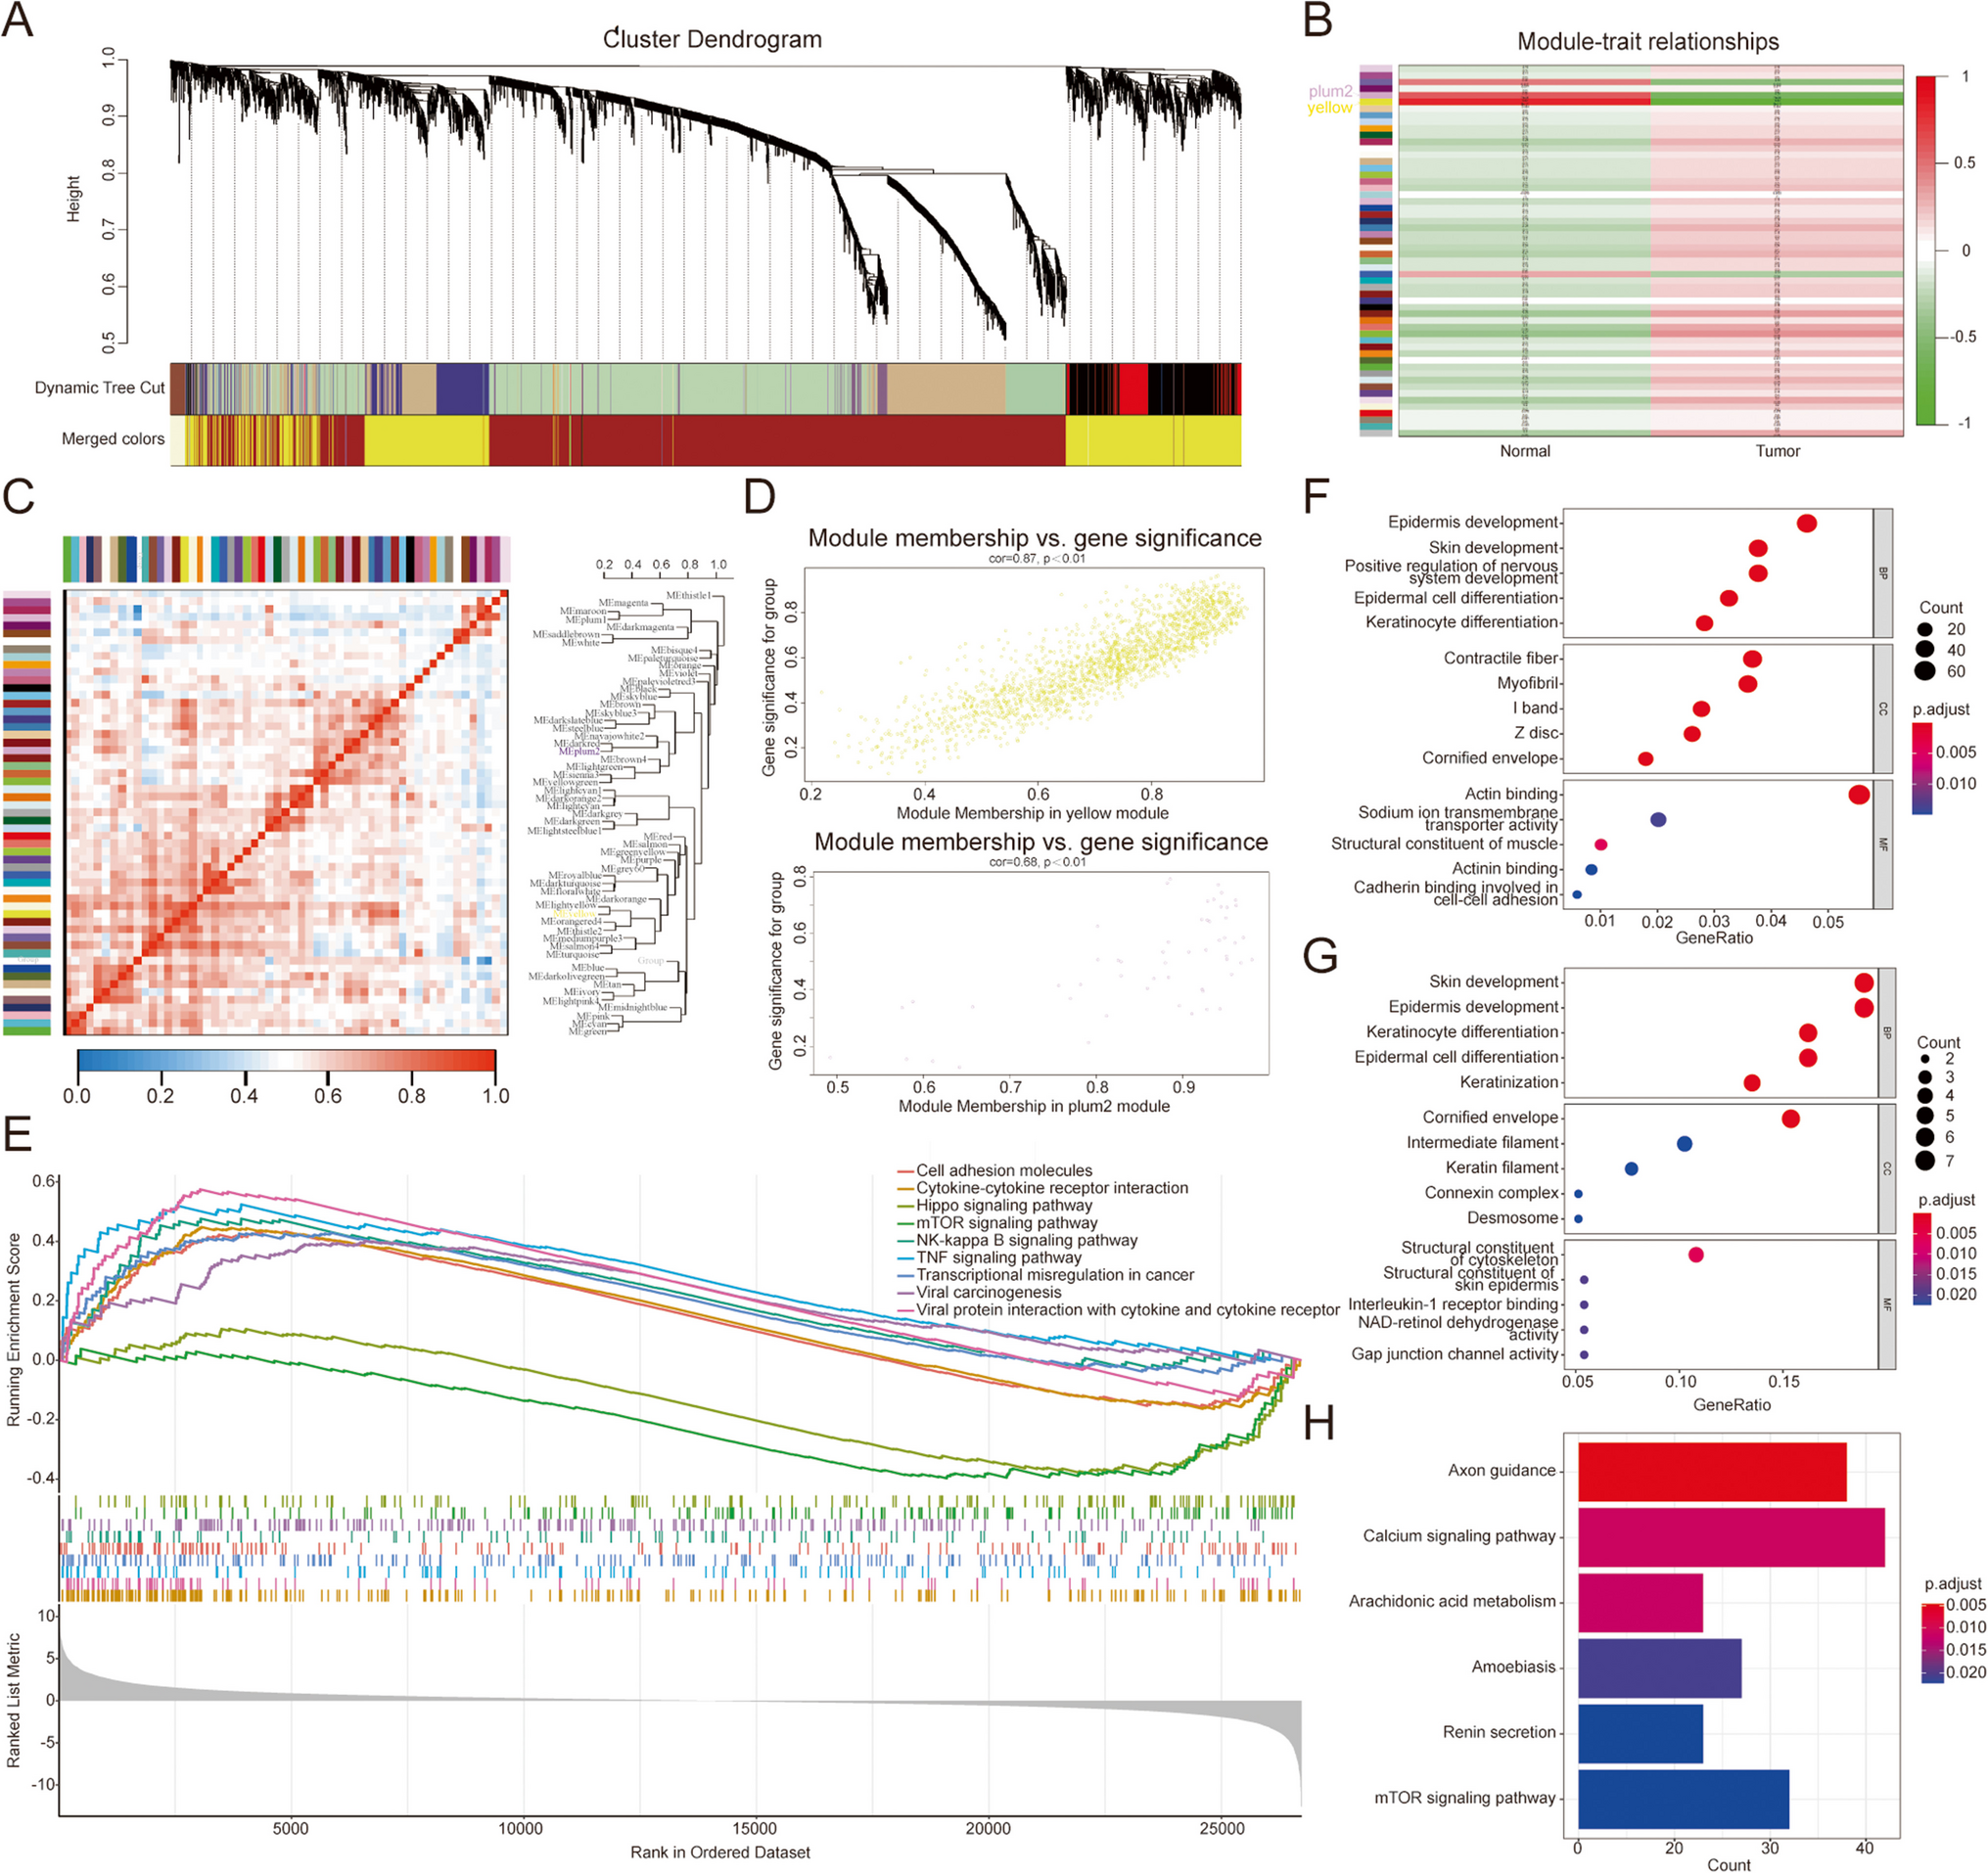
Using the RNA editing sites defined in TCGA Breast Cancer RNA-seq dataset (TCGA-RNAediting, SynID: syn2374375) (Han et al. 2015), we detected differentially edited mRNAs in breast tumors (Fig. 1). Given that majority of differentially edited regions mapped to 3’UTRs, we focused on these editing events detected in all breast cancer subtypes (Table S1, Fig.S1a).
Fig. 1
TCGA breast cancer (n = 837) and normal breast tissue (n = 105) RNA-seq data was screened for A-to-I(G) editing events. Informative RNA editing sites were identified in at least five tumor and non-tumor sample pairs. Differential editing was assessed using the Wilcoxon test, with significant sites defined by FDR < 0.05 and a mean editing level difference ≥ 5% between tumor and non-tumor samples. Majority of significant editing sites map to 3’UTRs. The upstream and downstream regions were defined as 1 kilobase (kb) sequences flanking the annotated transcription start and end sites of the gene, respectively. ncRNA: Noncoding RNA
We started by experimentally confirming the A-to-I editing events in the 3’UTRs of selected transcripts based on their cancer relevance and high expression in breast tumors (Fig. S1b). Inosine (I) in the RNA is recognized as guanosine (G) by reverse transcriptase (RT), and therefore cytosine (C) is incorporated into the reverse-transcribed cDNA. Next, upon PCR amplification of the cDNA, DNA polymerase incorporates G into the new strand. Consequently, A-to-I editing is observed as a complete or partial replacement of edited A with G in the cDNA (Malik et al. 2021).
To this end, we used primers (Table S2) flanking the editing sites and generated PCR amplicons by using genomic DNA or cDNA as templates. Following amplicon sequencing, we confirmed A-to-I(G) changes in the 3’UTRs of MDM2 (mouse double minute 2 homolog), GINS1 (GINS complex subunit 1), and F11R (junctional adhesion molecule A) (Fig. 2a, b, c, Table S3). A-to-I(G) editing sites were quantified by calculating G count percentage in RNA-seq reads at positions where an A was present in the gDNA templated amplicons (Malik et al. 2021). The initial editing predictions for MDM2, GINS1, and F11R, obtained from the TCGA breast cancer patient dataset was experimentally validated (Fig. 2). A few additional A-to-I(G) editing events were identified for MDM2 that were not initially predicted (Fig. 2a, indicated by *). Importantly, none of these edit sites were reported as SNPs based on the DBSNP (The Single Nucleotide Polymorphism Database). We also checked the Database of RNA Editing in Humans (DARNED), further confirming that these sites were edited in diverse tissues (Table S4-6). Among the editing sites we confirmed, chr12:69237004, chr12:69237010, chr12:69237013, and chr12:69237053 have been previously shown to be edited in breast cancer, 12 of 15 sites for MDM2, 8 of 9 sites for GINS1, 4 of 5 sites for F11R of editing sites were also confirmed in lymphoblastoid cells according to DARNED (Bahn et al. 2012; Ramaswami et al. 2012). Moreover, independently amplified and sequenced PCR amplicons yielded comparable editing percentages in MCF7 cells, supporting the reproducibility of the results (Fig. S2a). Editing was further confirmed in MDA-MB-231 cells representing triple negative breast cancer cells (Fig. S2b-d).
Fig. 2
A-to-I(G) editing events in the 3’UTRs of MDM2 (a), GINS1 (b), and F11R (c) in MCF7 cells. gDNA (genomic DNA) or cDNA templated PCR amplicons were sequenced and G% values were calculated based on NGS read counts. The NGS confirmed A-to-I(G) editing events that were not initially predicted are indicated by *
ADAR1 interaction with the 3’UTRs of MDM2, GINS1 and F11RNext, to functionally test the relationship between ADAR1 and edited mRNAs, we performed ADAR1 immunoprecipitation of interacting RNAs and RT-PCR (RIP-PCR) to determine whether ADAR1 interacts with MDM2, GINS1, and F11R mRNAs. cDNAs were synthesized from ADAR1 immunoprecipitated RNAs using oligo (dT) or gene-specific primers. Editing events were examined in the MCF7 breast cancer model, representing the most common type of breast cancer (luminal A subtype), expressing estrogen receptor (ER) and/or progesterone receptor (PR) (Perou et al. 2000; Sorlie et al. 2003). Our results demonstrated that all three mRNAs, MDM2, GINS1, and F11R were specifically enriched in ADAR1 immunoprecipitation samples. In contrast, these mRNAs were not detected in the control samples immunoprecipitated with non-specific control IgG antibody (Fig. 3).
Fig. 3
RIP-PCR for MDM2 (a), GINS1 (b) and F11R (c). For RNA-IP, ADAR1 (Abcam, ab168809), and rabbit IgG (Cell Signaling, 2729) antibodies were used. cDNAs were synthesized from RNA samples isolated after RIP with oligo d(T) primers (lanes 1, 2), or gene-specific primers (GSP) for MDM2 (lanes 3,4). Three independent biological replicates are shown for each RIP experiment and PCR. Lane 5 for MDM2, and lanes 3 for GINS1 and F11R RIP-PCRs had MCF7 cDNA (Input) as positive control for PCR. NT lane was no template/negative control
We also sought to investigate whether these interactions were functional and knocked down ADAR1 using RNAi and sequenced RT-PCR amplicons covering the previously edited regions for MDM2, GINS1, and F11R. All three mRNAs, MDM2, GINS1, and F11R had markedly decreased editing levels compared to ADAR1-expressing cells. MDM2 editing levels were similar in NT siRNA transfected cells and untransfected MCF7 cells (Fig. 4, Fig. S2e).
Fig. 4
siRNA-mediated ADAR1 knockdown and RNA editing in MCF7 cells, a. Western blot shows ADAR1 protein levels in ADAR1 siRNA or NT (non-targeting) siRNA transfected cells. UNT: Untransfected cells. The same blots were hybridized with ACTB antibody to test sample loading, b. A-to-I(G) editing ratios of MDM2, c. A-to-I(G) editing ratios of GINS1, and A-to-I(G) editing ratios of F11R in ADAR1 knockdown MCF7 cells
To this end, based on in silico editing predictions from tumors, we were able to experimentally confirm editing events in the 3’UTRs of selected candidates, showing their physical and functional relationship with ADAR1. Next, given its established role in cancer, we focused on RNA editing events in the 3’UTR of MDM2.
MDM2 overexpression and editing in breast cancerFirst, we determined MDM2 levels in breast cancers using GTEx normal breast tissue (n = 179), TCGA normal breast tissue (n = 113), and TCGA breast cancer tumor subtypes (luminal A (n = 562), luminal B (n = 214), basal (n = 190), HER2-enriched (n = 81), and normal-like (n = 39). Curiously, MDM2 is most significantly overexpressed in luminal A (lumA) breast cancers in the TCGA dataset compared with normal breast tissue or adjacent normal tissue (Fig. 5a, b). For lumA tumors, high MDM2 transcript levels correlate with poor relapse-free survival times (p < 0.05) (Fig. 5c). In line with these findings, an earlier study suggested MDM2 as an independent negative prognostic marker for breast cancer based on IHC performed in more than 2000 breast carcinomas (Turbin et al. 2006).
Fig. 5
a. MDM2 mRNA expression levels (log2-transformed RSEM TPM values (TPM + 0.001) in GTEx breast normal tissue (n = 179), TCGA breast cancer normal tissue (n = 113), and TCGA breast cancer tumor subtypes (luminal A (lumA,0 n = 562), luminal B (lumB, n = 214), basal (n = 190), HER2-enriched (n = 81), and normal-like (n = 39)). Asterisks above the violin plots indicate statistical significance compared to TCGA normal breast tissue data, while asterisks below the violin plots indicate statistical significance compared to GTEx normal breast tissue. One-way ANOVA with Tukey correction for multiple comparisons was performed (**** p < 0.0001, *** p < 0.001, ** p < 0.01, and “ns” for non-significant), b. MDM2 expression in lumA and lumB breast tumors compared with matched normal tissue (paired t-test, **** p < 0.0001), c. Kaplan-Meier analysis of relapse-free survival (RFS) in TCGA BRCA lumA and lumB patients based on MDM2 transcript levels. Patients were grouped into ‘high’ (red) and ‘low’ (black) expression categories based on “Auto select best cutoff” option using data upload. For lumA, Hazard ratio (HR) is 1.98 (95% CI: 1.06–3.71) with a log-rank p-value of 0.021. For lumB, log-rank p-value is 0.048 (HR:3.37). The number of patients at low vs high risk at different time points is indicated below the graphs
MDM2 has an unusually long 3’UTR, harboring previously described cis-elements recognized by trans-factors, including microRNAs (Zhang et al. 2016). To investigate the functional impact of RNA editing, we focused on the highly edited region within the MDM2 3’UTR. Double-stranded oligonucleotides were synthesized to mimic either the non-edited or edited state, where the edited oligo featured guanine (G) substitutions at the adenosine (A) positions for seven nucleotides within the highly edit-rich region of the MDM2 3’UTR. The edited and non-edited sequences were cloned downstream of the firefly luciferase coding sequence of the pMIR vector (Fig. 6a). Cells were co-transfected with pMIR and phRL-TK (Renilla luciferase) for normalization, and dual luciferase activity was measured (Fig. 6a). The edited region exhibited a 60% increase in luciferase activity compared to the non-edited 3’UTR fragment (p < 0.05), indicating that RNA editing positively influences MDM2 protein levels. Notably, this reporter assay provided insight into a short segment of the MDM2 3’UTR undergoing editing. Additional evidence supporting the role of RNA editing in modulating MDM2 protein levels was obtained from ADAR1 knockdown experiments. Reduced ADAR1 expression led to a significant decrease in A-to-I(G) editing ratio, and decreased MDM2 protein levels (Figs. 4b and 6b). These findings collectively suggest that 3’UTR RNA editing modulates MDM2 protein levels in cancer cells. Furthermore, supporting the cancer-specific nature of this editing, MDM2 RNA editing was less prevalent in normal breast tissue (Fig. 6c, Table S7).
Fig. 6
Effect of RNA editing on MDM2 protein levels, (a) Dual luciferase reporter assay with MDM2 3’UTR edit rich region. Non-edited (A) and edited (G) oligos were cloned downstream of the luciferase gene in pMIR. MCF7 cells were transiently transfected, and Firefly/Renilla luciferase read-outs from the constructs were normalized to that of empty pMIR (EV) (*p < 0.05, ***p < 0.0005, n = 3 independent transfections, one-way ANOVA, Tukey’s HSD), (b) ADAR1 and MDM2 protein levels in ADAR1 siRNA transfected (24 h, 48 h, 72 h) MCF7 cells. The same blots were hybridized with ACTB antibody to test sample loading. The image is representative of 3 independent experiments. Graphs show densitometric quantification of MDM2 and ADAR1 bands normalized to NT siRNA transfected cells (**p < 0.005, ***p < 0.0005, ****p < 0.0001, one-way ANOVA, Tukey’s HSD). NT: non-targeting siRNA transfected cells, UNT: Untransfected cells, (c) NGS and G% reads for the fifteen RNA editing positions for the 3’UTR of MDM2 in normal breast tissue. Fold changes in RNA editing percentage values between MCF7 cells and normal breast cDNA are shown on the bars
While these experiments offered preliminary insights into the functional relevance of several RNA editing sites within the MDM2 3′UTR, a more comprehensive analysis using full-length 3’UTR constructs, coupled with functional assays, would be necessary to determine whether RNA editing alters the binding affinity of microRNAs or other trans-acting regulatory factors. Supporting this possibility, in silico target prediction identified putative microRNA binding sites in close proximity to the validated editing sites within the MDM2 3′UTR (Fig. S3a).
ADAR1 in close proximity to the polyadenylation machineryConsidering the predominance of RNA editing in the Alu regions (Fumagalli et al. 2015), we used RepeatMasker to investigate the presence of repeat elements around the A-I(G) sites. There were no Alu elements around MDM2 editing (Fig. S3b). Nevertheless, we sought to confirm the presence of ADAR1 in the 3’UTR region despite the lack of Alu elements. We hypothesized that RNA-binding proteins associated with 3’UTRs might interact with ADAR1 and play a role in region-selective editing. To investigate this, we selected CSTF2—a well-known RNA-binding protein associated with 3’ UTRs and a core component of the polyadenylation machinery—as a candidate to identify potential protein partners that might explain ADAR1’s presence on 3’ UTRs. We employed a proximity labeling approach for this analysis. We considered the dynamic nature of transcription and post-transcriptional mechanisms and used the TurboID-based proximity-labeling because of its faster kinetics compared to the original BirA biotin ligase (Roux et al. 2012). We transfected estrogen receptor-positive MCF7 cells with the CSTF2-TurboID construct and treated them with E2 (Estradiol) to stimulate transcription and proliferation (Ayaz et al. 2019). We confirmed the expression and biotinylation potential of CTSF2-TurboID by incubating the cells with 50 µM biotin for 3 h (Fig. 7a). Endogenous CSTF2 was mostly present in the nuclear fraction (n), whereas CSTF2-TurboID fusion protein was detected in both the nucleus and cytosol (c) (Fig. 7a). Of note, E2 treatment to enhance transcription and proliferation did not alter the subcellular localization of the fusion protein. Following this characterization, target proteins were labeled using the described conditions.
Fig. 7
ADAR1 interacts with CSTF2, a. Schematic shows the proximity biotinylation approach to detect protein interactions at 3’UTRs using CSTF2_TurboID_HA fusion protein expression and biotinylation in MCF7 cells. Biotinylated target proteins were immunoprecipitated (B-IP) and analyzed by LC-MS/MS. Western blot analysis of CSTF2-TurboID transfected MCF7 cells treated with 100 nM E2 or ethanol for 45 min–3 h, and 50 µM biotin. Nuclear and cytoplasmic lysates were subjected to western blot analysis using anti-CSTF2 antibody to detect CSTF2_TurboID_HA fusion and endogenous CSTF2. HDAC1 and TUBA1A antibodies were used to validate the nuclear and cytoplasmic fractions. Anti-Biotin antibody was used for biotinylation assessment, b. Biotinylated nuclear proteins were identified through LC-MS/MS analysis. ADAR1 was found to be significantly enriched among the biotinylated nuclear proteins (SAINT score 1), c. ADAR1 was confirmed to be biotinylated by the CSTF2-TurboID fusion. MCF7 cells were transfected with CSTF2-TurboID. After 24 h, cells were incubated with 50 µM Biotin in the presence or absence of E2 for 45 min and 3 h. Isolated nuclear and cytoplasmic lysates were used for affinity capture with streptavidin beads. Eluted proteins were used for western blot analysis with anti-ADAR1, anti-CSTF2 and anti-Biotin antibodies, d. Nuclear extracts (500 µg) of MCF7 cells were subjected to Co-IP with CSTF2 or isotype-matched IgG. Input was 25 µg nuclear lysate. Immunoprecipitated proteins were then subjected to immunoblotting using CSTF2 or ADAR1 antibodies. WB: western blotting, e. Upset plot showing intersection of RNA editing events on mRNAs. Majority of RNA editing events were only detected on 3’UTRs. Each row represents a genomic feature, and the filled dots indicate the intersection of editing regions in individual mRNAs. The vertical bars indicate the number of genes in each category
To capture nuclear targets of CSTF2-TurboID, biotinylated proteins in the nuclear and cytoplasmic lysates were separately captured using streptavidin-conjugated magnetic beads and subjected to LC-MS/MS analysis. The experiment was repeated twice, with two technical replicates for each sample (E2 or ethanol-treated). All biotinylated proteins in the cytoplasmic fraction were subtracted from the nuclear fraction and the SAINT algorithm was used to probabilistically score protein-protein interactions in E2 treated cells (Choi et al. 2011) (Fig. 7b). Of note, we did not capture any E2-spesific biotinylation of proteins by the CSTF2-TurboID construct. In addition to the expected interactors of CSTF2 that appeared as biotinylated proteins (e.g., CSTF2 itself, CPSF3, and CPSF2), 13 proteins had a SAINT score of 1. These candidates were considered high-confidence CSTF2 interactors (Table S8). Interestingly, ADAR1 emerged as one of the most significant nuclear interactors of CSTF2 (Saint Score 1, FC:40, BFDR:0) (Fig. 7b, Table S8). Consistent with this interaction, ADAR1 is predominantly localized in the nucleus (Fig. S4).
To confirm the LC-MS/MS results and explore a potential interaction between ADAR1 and CSTF2, we first performed an independent proximity biotinylation experiment. CSTF2-TurboID biotinylated proteins were pulled down and subjected to western blotting. CSTF2 and ADAR1 were both found in the biotinylated fraction (Fig. 7c). Using an independent approach, we performed Co-IP in untransfected MCF7 cells. Immunoprecipitation of nuclear extracts using the CSTF2 antibody followed by immunoblotting with the ADAR1 antibody confirmed the presence of ADAR1 in the immunoprecipitated lysates (Fig. 7d, Fig. S5 for biological replicates for the Co-IP experiment). These results suggest that ADAR1 interacts with CSTF2, a critical component of the polyadenylation machinery. In addition, we found that the majority of differentially edited mRNAs exhibited editing exclusively within their 3′UTRs, with no detectable editing in other transcript regions (Fig. 7e). This pattern may indicate a 3′UTR-specific accessibility or the selective recruitment of ADAR1 to these regions.
It remains unclear whether the interaction between ADAR1 and CSTF2 and/or other polyadenylation machinery components is essential for RNA editing at specific 3’UTRs, including MDM2. It is also not clear whether this interaction is direct and/or is RNA dependent. Possibly due to the essential role of CSTF2 in mRNA maturation, CSTF2 knockdown resulted in a 60% reduction in ADAR1, and 40–50% reduction in MDM2 protein levels, which precluded the ability to assess the role of the CSTF2-ADAR1 interaction in RNA editing under these conditions for MDM2 (Fig. 8). Of note, siRNA-mediated knockdown of CSTF2 or ADAR1 in MCF7 cells did not result in a noticeable reduction of MDM2 transcript levels and there was no correlation between ADAR1 and MDM2 mRNAs levels in the TCGA breast cancer RNA-seq data for LumA patients (Fig. S7). There is also no correlation between MDM2 and ADAR1 mRNA expression in Luminal A breast cancer samples (TCGA) (Fig. S7).
Fig. 8
Effect of CSTF2 knockdown on ADAR1 and MDM2 protein levels. Western blot analysis of CSTF2 siRNA transfected MCF7 cells (24, 48, and 72 h) showed decreased ADAR1 and MDM2 protein levels. The same blots were hybridized with ACTB antibody to test sample loading. The image is representative of 3 independent experiments. Graphs show densitometric quantification of bands normalized to NT bands (ns: not significant, *p < 0.05, **p < 0.01, ****p < 0.0001; n = 3 biological replicates, one-way ANOVA, Tukey’s HSD). NT: non-targeting siRNA transfected cells
Overall, these findings highlight the impact of 3’UTRs and RNA editing on protein levels of MDM2 and potentially other cancer-related genes. Elucidating the mechanism of RNA editing for activation or inactivation of cancer-related genes may open new avenues for epitranscriptome targeted therapies in cancer.
Comments (0)