
Remember me

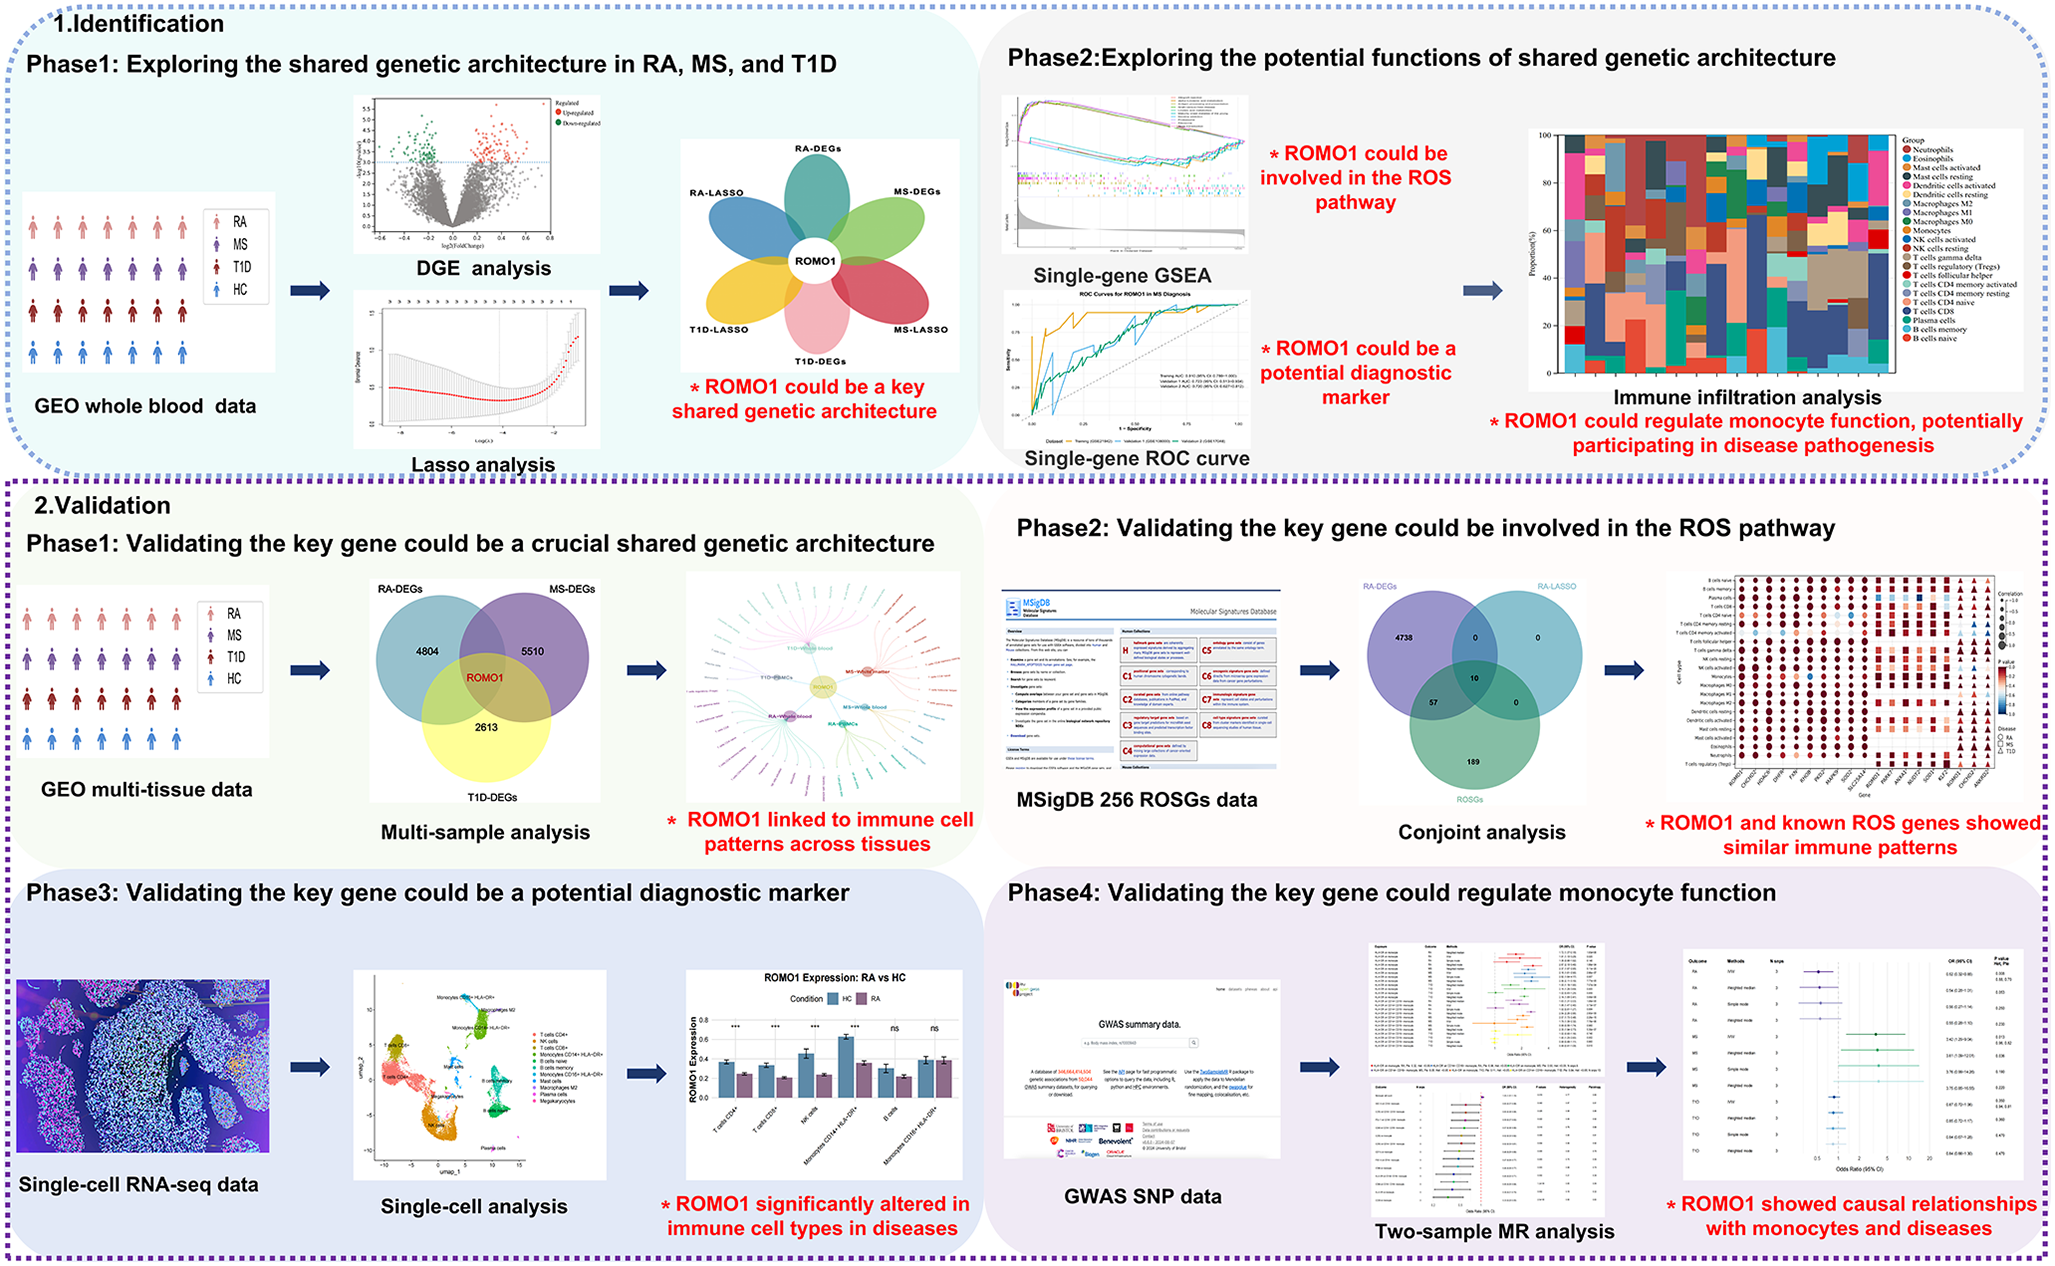
We first conducted the DGE analysis for three autoimmune diseases: RA, MS, and T1D(Figs. 2A, B, C). Through cross-comparison, we identified 8 genes that were differentially expressed across all three diseases: ROMO1, FAU, RPS10, RPL35, RPS17, RPS27, LSM3, and RPL27(Supplementary Fig. 1). Further analysis of the expression patterns of these shared DEGs revealed that their expression levels were generally reduced in RA and T1D patients, while showing a trend of increased expression in MS patients(Fig. 2D, E, F). To further identify the most relevant key genes, we performed LASSO regression analysis for each disease separately(Fig. 2G, H, I). We selected the optimal λ values for each disease: for RA, λ was set to 0.010, indicating the 2 genes as as the candidate genes for RA (ROMO1 and LSM3); for MS, λ was determined to be 0.012, identifying 2 genes for MS (ROMO1 and FAU); for T1D, λ was set at 5.14 × 10− 4, identifying 3 genes for T1D (ROMO1, LSM3 and TPT1). By cross-comparing the LASSO regression results, we found that ROMO1 was the only gene selected in all three diseases(Fig. 2J). These findings strongly suggested that ROMO1 may play a crucial role in these three autoimmune diseases.
Fig. 2
(A) The volcano plot displays the expression patterns of DEGs in RA.(B) The volcano plot displays the expression patterns of DEGs in MS. (C) The volcano plot displays the expression patterns of DEGs in T1D. (D) Comparison of the expresssion of 8 shared genes between RA and healthy controls(*P < 0.05, **P < 0.01, ***P < 0.001, ****P < 0.0001). (E) Comparison of the expresssion of 8 shared genes between MS and healthy controls(*P < 0.05, **P < 0.01, ***P < 0.001, ****P < 0.0001). (F) Comparison of the expresssion of 8 shared genes between T1D and healthy controls(*P < 0.05, **P < 0.01, ***P < 0.001, ****P < 0.0001). (G)Lasso regression model to identify candidate genes in RA. (H)Lasso regression model to identify candidate genes in MS. (I)Lasso regression model to identify candidate genes in T1D. (J)The Venn diagram displays the hub gene ROMO1 among T1D, RA, and MS
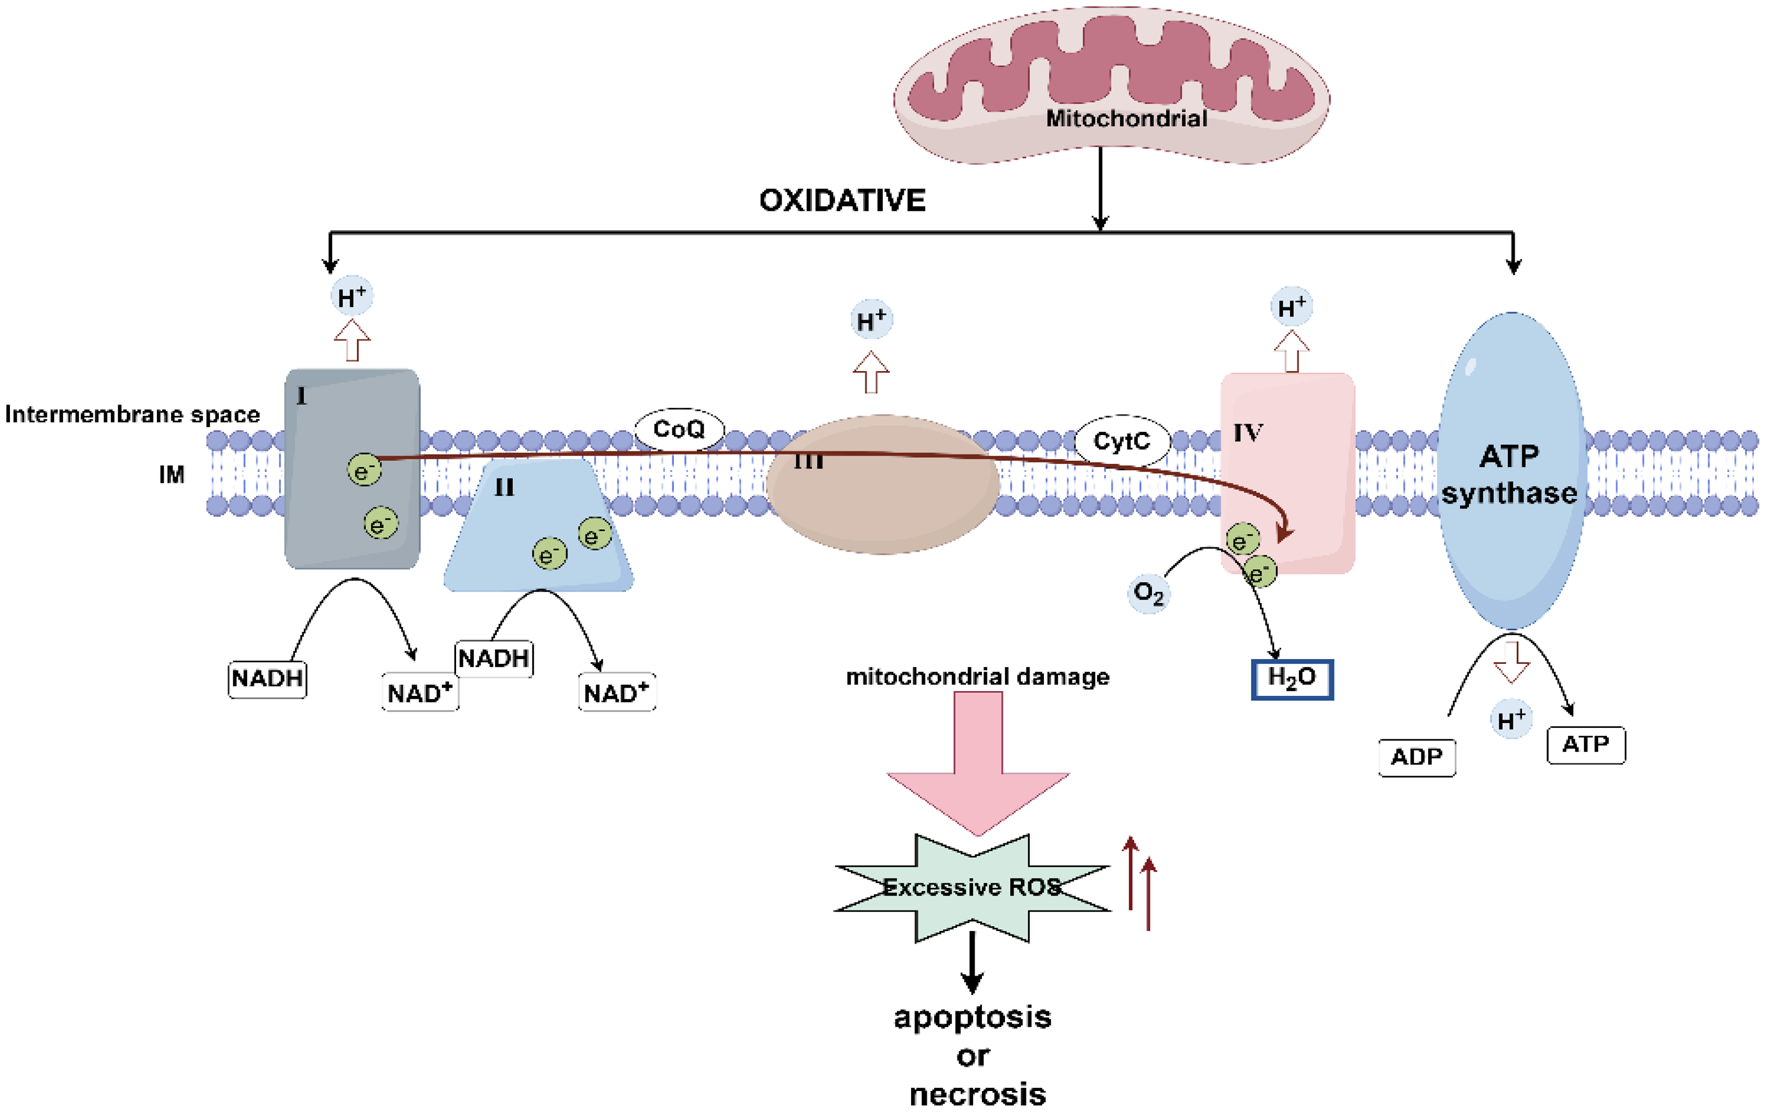
ROMO1 could be involved in the ROS pathway in RA, MS, and T1DAfter identifying ROMO1 as a key gene in three autoimmune diseases, we conducted a single gene GSEA. We examined the top five and bottom five KEGG signaling pathways (Fig. 3A, B, C) and GO terms (Fig. 3D, E, F) associated with these diseases. The analysis revealed that ROMO1 was significantly enriched in the KEGG ribosome pathway across all three conditions (Fig. 3G). Furthermore, GO analysis indicated that ROMO1 was negatively correlated with the electron transfer from cytochrome c to oxygen in the mitochondrial electron transport chain in these diseases (Fig. 3H). Considering that both ribosomal function and mitochondrial electron transport chain were closely related to cellular redox status, and previous studies had demonstrated a direct link between ROMO1 and ROS production (Zhou et al. 2021), we inferred that ROMO1 was likely involved in the ROS pathway in RA, MS, and T1D. At the same time, we also noted that there the three autoimmune diseases had differences in terms of enrichment pathways. RA showed unique functional enrichment in ribonucleoside triphosphate metabolism and regulation of adaptive immune response, which differed markedly from MS and T1D. In addition, T1D was mainly involved in myosystem-related processes, whereas MS showed specific regulation of proteolytic metabolic processes. These differences also provided important clues to understanding the pathomechanisms of these autoimmune diseases.
Fig. 3
(A) KEGG enrichment analysis in RA. (B) KEGG enrichment analysis in MS. (C) KEGG enrichment analysis in T1D. (D) Go enrichment analysis in RA. (E) GO enrichment analysis in MS. (F) GO enrichment analysis in T1D. (G) The network of KEGG pathways in RA, MS and T1D. (H) The network of GO pathways in RA, MS and T1D
ROMO1 could regulate monocyte function, potentially participating in disease pathogenesisUsing the CIBERSORT algorithm, we obtained the proportions of 22 different immune cell types in samples from three autoimmune diseases(Fig. 4A, B, C). The results of immune infiltration analysis, using non-parametric tests, also revealed significant differences in the immune cell composition between the HC and diseased groups across all the three diseases(Fig. 4D, E, F). Particularly the correlation heatmaps between ROMO1 and the immune cells in three diseases further confirmed the critical role of ROMO1 in the pathogenesis of these autoimmune disorders (Fig. 4G, H, I). ROMO1 was found to be significantly associated with various types of immune cells in three diseases (Supplementary Fig. 2). Notably, consistent and significant associations with monocytes were found in all of these different disorders (RA, Cor = 0.20, P = 0.037; MS, Cor = 0.41, P = 3.51 × 10− 3; T1D, Cor=-0.43, P = 3.93 × 10− 3). Considering RA, MS and T1D as autoimmune diseases in which immune cells play a key role in the pathological process, and our analysis revealed that ROMO1 showed significant correlation with monocytes in all three diseases. Therefore, we hypothesised that ROMO1 could regulate monocyte function and thus participated in the pathogenesist of RA, MS, and T1D.
Fig. 4
(A) Proportions of 22 immune cell types in RA. (B) Proportions of 22 immune cell types in MS. (C) Proportions of 22 immune cell types in T1D. (D) Comparison of the proportion of immune cell subsets between RA and healthy controls (*P < 0.05, **P < 0.01, ***P < 0.001, ns: not significant). (E) Comparison of the proportion of immune cell subsets between MS and healthy controls(*P < 0.05, **P < 0.01, ***P < 0.001, ns: not significant). (F) Comparison of the proportion of immune cell subsets between T1D and healthy controls(*P < 0.05, **P < 0.01, ***P < 0.001, ns: not significant). (G) Correlation between ROMO1 and immune cell subsets of RA. (H) Correlation between ROMO1 and immune cell subsets of MS.(I) Correlation between ROMO1 and immune cell subsets of T1D
ROMO1 could be a potential diagnostic marker in RA, MS, and T1DROMO1 demonstrated overall good diagnostic performance across three autoimmune diseases. In RA, ROMO1 showed exceptional performance: the training set (GSE56649) achieved an AUC of 0.991 (95% CI: 0.968-1.000), validation set 1 (GSE15573) reached 0.781 (95% CI: 0.620–0.943), and validation set 2 (GSE205962) attained a perfect 1.000 (95% CI: 1.000–1.000), demonstrating high diagnostic accuracy and good generalizability(Fig. 5A). For MS, ROMO1’s diagnostic value was relatively consistent: the training set (GSE21942) had an AUC of 0.910 (95% CI: 0.789-1.000), while the two validation sets (GSE108000 and GSE17048) showed AUCs of 0.723 (95% CI: 0.513–0.934) and 0.720 (95% CI: 0.627–0.812) respectively, indicating moderate diagnostic accuracy for MS(Fig. 5B). In T1D, ROMO1’s performance varied across datasets: the training set (GSE44314) achieved an AUC of 1.000 (95% CI: 1.000–1.000), validation set 1 (GSE19273) reached 0.594 (95% CI: 0.410–0.778), and validation set 2 (GSE33440) showed an AUC of 0.708 (95% CI: 0.442–0.975), suggesting potential but variable diagnostic utility for T1D (Fig. 5C). We also performed the ROC analysis of ROMO1 with these three diseases in supplementary results to compare the diagnostic ability of ROMO1 with existing conventional biomarkers (Supplementary Fig. 8, 9, 10). Surprisingly, ROMO1 outperformed typical biomarkers in the diagnosis of these diseases, showing higher diagnostic value. Taken together, these results indicate that ROMO1 could be a potential diagnostic marker in RA, MS, and T1D, with varying degrees of performance across these autoimmune diseases.
Fig. 5
(A) The ROC curves for ROMO1 in RA diagnosis. (B) The ROC curves for ROMO1 in MS diagnosis. (C) The ROC curves for ROMO1 in T1D diagnosis. (D)The Venn diagram displays the hub gene ROMO1 among T1D, RA, and MS. (E) The significant correlations between ROMO1 and RA, MS and T1D immune cell subsets. (F) Multi-tissue ROMO1 correlation with immune subsets in RA, MS, T1D. (G) The Venn diagram displays the shared genes between RA and ROSGs. (H) The Venn diagram displays the shared genes between MS and ROSGs. (I) The Venn diagram displays the shared genes between T1D and ROSGs. (J) Correlation between shared genes and immune cell subsets of RA, MS and T1D
Validation of ROMO1 could be a crucial shared genetic architecture in RA, MS, and T1DWe analyzed data from peripheral blood cell tissues of patients with RA, MS, and T1D, obtained from the GEO database. Our analysis consistently identified ROMO1 as differentially expressed across these three autoimmune diseases(Fig. 5D). Further immune infiltration analysis revealed significant correlations between ROMO1 and various immune cell types (Fig. 5E). Subsequently, by integrating all immunological findings, we observed consistent and significant associations between ROMO1 and monocytes across different tissues in all three diseases (Fig. 5F). Collectively, these results validate that ROMO1 could be a key component of the shared genetic architecture in RA, MS, and T1D.
Validation of ROMO1 could be involved in the ROS pathway in RA, MS, and T1DAfter DGE and LSAAO regression analyses, we identified overlapping genes between DEGs and ROSGs in three autoimmune diseases. We found 10 overlapping genes in RA (including ROMO1, CHCHD2, HDAC6, DHFR, FXN, RHOB, PKD2, MAPK9, SOD2, SLC25A14), 6 in MS(including ROMO1, PARK7, ANXA1, NUDT2, SOD1, KLF2), and 3 in T1D (ROMO1, CHCHD2, ANKRD2). Notably, ROMO1 was the only ROSG that overlapped in all three diseases (Fig. 5G, H, I). To further validated the above findings, we performed an immune infiltration analysis. The results showed that ROMO1 and other key genes known to be involved in the ROS pathway (e.g., CHCHD2, PARK7, ANXA1, NUDT2, SOD1, and ANKRD2) exhibited a highly similar immune infiltration pattern in the three diseases(Fig. 5J). This remarkable similarity suggested that ROMO1 may share similar functions and regulatory mechanisms with these known ROS pathway genes. These results strongly validated the critical role of ROMO1 in the ROS pathway in RA, MS, and T1D.
Validation of ROMO1 could be a potential diagnostic marker in RA, MS, and T1DAfter quality control of the single-cell data, we obtained the following dataset-specific information: in the single-cell dataset for RA, the number of cells was 8, 564, the total number of reads was 36, 851, 544, and the depth of read per cell was 4, 304; in the single-cell dataset for MS, the number of cells was 2, 046, the total number of reads was 8, 709, 744 with a read depth of 4, 257 per cell; in the single-cell dataset for T1D, the number of cells was 3, 011 with 12, 827, 205 total reads and a read depth of 4, 260 per cell; in the single-cell dataset for the HC, the number of cells was 2, 961 with 15, 819, 466 total reads and the depth of read per cell was 5, 343. Subsequently, we performed cell classification analysis. The analysis identified six major immune cell populations (T cells CD4+, Monocytes CD16 + HLA-DR+, T cells CD8+, Monocytes CD14 + HLA-DR+, B cells, and NK cells) across four categories: RA, MS, T1D, and HC(Fig. 6A, B, C, D). ROMO1 expression was detected in multiple cell types, with Monocytes CD14 + HLA-DR + and Monocytes CD16 + HLA-DR + showing the highest expression levels across all four groups. Compared to HC, RA samples exhibited significantly lower overall ROMO1 expression (P < 0.001), with notable reductions in T cells CD4+ (P < 0.001), T cells CD8+, Monocytes CD14 + HLA-DR+ (P < 0.001), and NK cells (P < 0.001). While MS samples did not show significantly higher overall ROMO1 expression compared to HC, we observed significant decreases in T cells CD4+ (P < 0.01), Monocytes CD14 + HLA-DR+ (P < 0.001), and NK cells (P < 0.001). In T1D samples, overall ROMO1 expression was significantly lower than HC (P < 0.001), with a marked decrease in T cells CD4+ (P < 0.01). In conclusion, the consistency of ROMO1’s differential expression, particularly in key immune cell types such as CD4 + T cells and CD14 + HLA-DR + monocytes, further reinforces its potential as a robust biomarker.
Fig. 6
(A) The single cell analysis in RA(*P < 0.05, **P < 0.01, ***P < 0.001, ns: not significant). (B) The single cell analysis in MS(*P < 0.05, **P < 0.01, ***P < 0.001, ns: not significant). (C) The single cell analysis in T1D(*P < 0.05, **P < 0.01, ***P < 0.001, ns: not significant). (D) The single cell analysis in HC(*P < 0.05, **P < 0.01, ***P < 0.001, ns: not significant)
Validation of ROMO1 could regulate monocyte function in RA, MS, and T1DAfter rigorous screening, we obtained three IVs for ROMO1. Subsequent MR analysis revealed significant associations between upregulated ROMO1 expression and monocyte data across 14 types, with positive links to monocyte counts and negative links to 13 monocyte phenotypes (Fig. 7A). Then we used these 14 types of monocytes as exposure variables and the three autoimmune diseases as outcome variables. The results revealed that HLA-DR + monocytes, especially CD14 + monocytes, had OR greater than 1 for all three autoimmune diseases, suggesting these cells may increase disease risk (Fig. 7B). Finally, the two-sample MR analysis results showed that upregulated ROMO1 expression was associated with an OR of 0.52 (95% CI: [0.32, 0.85], P = 0.0083) for RA, indicating that upregulated ROMO1 expression might be a protective factor for RA(Fig. 7C). For MS, upregulated ROMO1 expression correlated with an OR of 3.42 (95% CI: [1.29, 9.04], P = 0.013), suggesting that upregulated ROMO1 might be a risk factor for MS. For T1D, the results for T1D were not significant, with an OR of 0.87 (95% CI: [0.72, 1.06], P = 0.35). These findings provided strong statistical evidence that ROMO1 could regulate monocyte function, potentially participating in disease pathogenesis. We also assessed heterogeneity among IVs using Cochran’s Q test and tested for pleiotropy using the MR-Egger intercept method. The p-value of MR-Egger intercept method was greater than 0.05, indicating no significant pleiotropy. In the study of monocytes against three autoimmune diseases, although no pleiotropy was found, we observed some heterogeneity, so these results needed to be interpreted with caution. In summary, these findings provided strong statistical evidence that ROMO1 could regulate monocyte function, potentially participating in disease pathogenesis.
Fig. 7
(A) The forest plot displays the effect estimates for the causal influence of upregulated ROMO1 expression on the risk of monocytes. (B) The forest plot displays the effect estimates for the causal influence of monocytes on the risk of RA, MS and T1D. (C) The forest plot displays the effect estimates for the causal influence of upregulated ROMO1 expression on the risk of RA, MS and T1D
Supplementary methods and resultsWe also conducted several analyses to support these findings, including linkage disequilibrium score regression (LDSC) analysis, multi-trait analysis of GWAS (MTAG), cell communication analysis, bidirectional MR analysis, reverse MR analysis, and the ROC analysis for ROMO1 and other typical biomarkers in diagnosing diseases. For detailed methods and results of our analyses, please refer to the “Supplementary methods and results material”.
Comments (0)