
Remember me


The institutional Clinical Research Ethics Committee of the participating center (approval numbers: B2022-568R) approved this retrospective study and waived the requirement of informed consent. We retrospectively included consecutive patients with MF-ICC who underwent surgical resection at two hospitals. Patients diagnosed with MF-ICC were enrolled from Zhongshan Hospital, Fudan University (Center 1) between February 2022 and May 2023, and Shanghai Tenth People’s Hospital of Tongji University (Center 2) between January 2020 and March 2023. The tumor location was determined using pathological specimens, with all lesions situated near the secondary bile duct within the liver parenchyma.
The inclusion criteria were as follows: (1) patients diagnosed with focal liver lesions, (2) patients scheduled for surgical resection with a pathological diagnosis of MF-ICC, and (3) patients who underwent conventional US and CEUS examinations within 1 month before surgery and prior to any treatments, including biopsy, radiotherapy, chemotherapy, or other transformative therapies. The exclusion criteria were as follow: (1) lack of clinicopathological information (n = 22 at Center 1, n = 1 at Center 2), (2) incomplete imaging data (n = 11 at Center 1, n = 1 at Center 2), (3) significant respiratory motion artifacts resulting in poor US image quality (n = 1 at Center 1).
Finally, 141 consecutive patients with MF-ICC were enrolled in this study. A detailed flowchart of patient selection process is shown in Fig. 1.
Fig. 1
Flowchart of study participants selection in this study
US imageUS examinations were performed by three experienced sonographers specializing in liver US at Center 1 using three types of US instruments (Philips EPIQ7 with a 5C1 convex array transducer, Hitachi Arietta 70 with an EUP-C532 convex array transducer, and Samsung RS80A with a CA1-7A convex array transducer). Three experienced sonographers used GE E9 US instruments with a C1-5 convex array transducer at Center 2. During real-time scanning, the acoustic window and depth were adjusted to ensure simultaneous display. The dynamic range, mechanical index (MI), output power, and focal zone were optimized to achieve effective tissue cancellation while maintaining adequate penetration. Additionally, the MI was set to 0.06–0.08 for CEUS. In this study, conventional US was performed 5–10 min before CEUS. Each patient’s conventional US and CEUS were performed by the same sonographer using the same US machine. A volume of 2.0 (at Center 1) or 1.5 mL (at Center 2) sulfur hexafluoride microbubbles (SonoVue®, Bracco Imaging, Milan, Italy) was injected within 1 s via the antecubital vein. A timer was started immediately after the microbubble injection. The enhancement characteristics of MF-ICC during the arterial, portal venous, and late phases were recorded according to the liver CEUS guidelines [15].
The conventional US characteristics recorded included: (1) tumor location (left or right lobe), (2) shape (regular or irregular), (3) echogenicity (hyper-, iso-, or hypo-echogenicity), and (4) margins (clear or ill-defined).
The CEUS characteristics that were recorded included: (1) initial enhancement time (time from contrast agent injection to its appearing in the lesion), (2) time to peak (time from contrast agent injection to the highest enhancement intensity of the lesion), (3) washout time (transition from hyper- or iso-enhancement during the arterial phase to hypo-enhancement), (4) arterial phase enhancement degree (hyper-, iso-, or hypo-enhancement), (5) portal venous phase enhancement degree (hyper-, iso-, or hypo-enhancement), (6) late-phase enhancement degree (hyper-, iso-, or hypo-enhancement), (7) contrast enhancement pattern (circular, non-circular, or nodular enhancement), and (8) degree of clearance (no clearance, slight clearance or significant clearance).
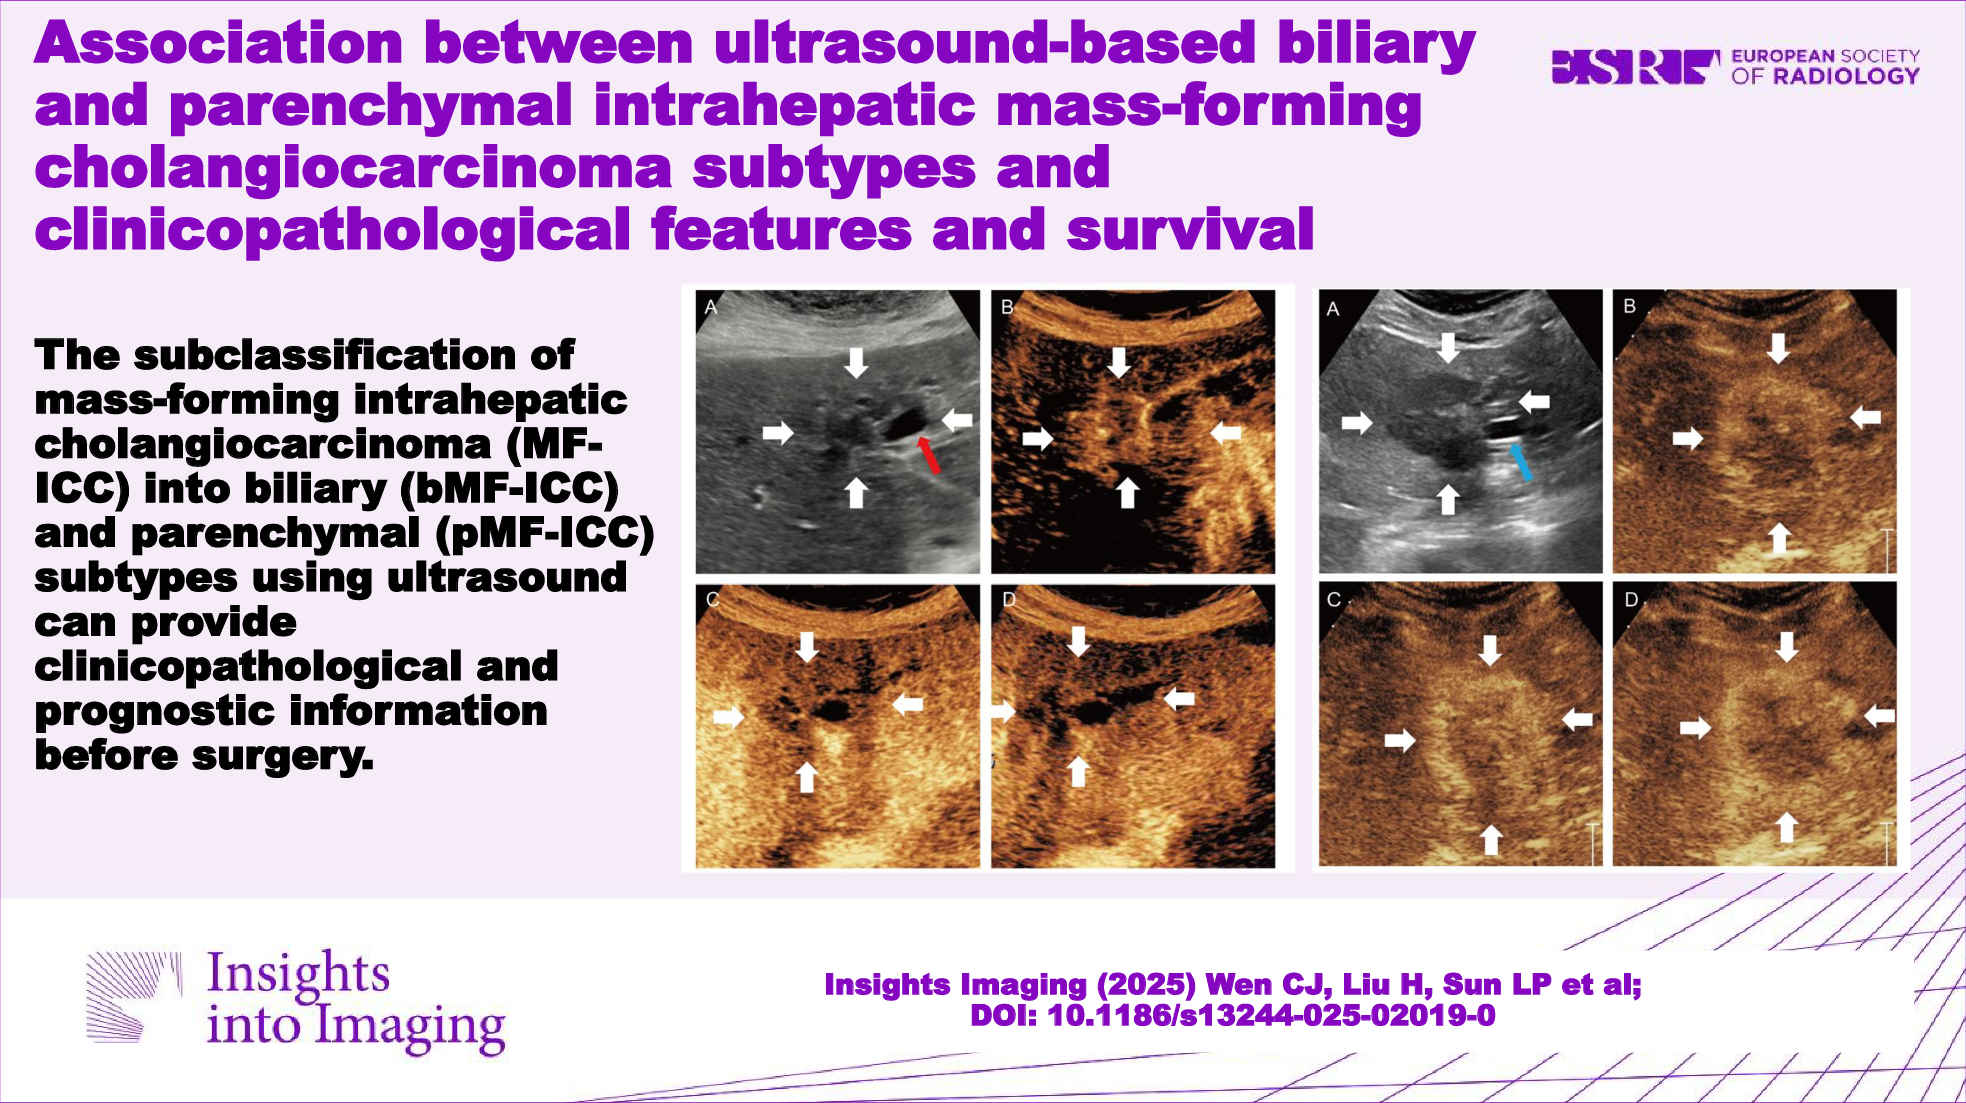
Images analysisThree sonographers subclassified MF-ICC as bMF-ICC (Figs. 2–4) or pMF-ICC (Fig. 5) based on preoperative US images. bMF-ICC was strictly defined by the presence of intra-tumoral bile duct dilatation, in which dilated bile ducts were entirely confined within the tumor mass. Otherwise, MF-ICCs were defined as pMF-ICC.
Fig. 2
A 79-year-old female with a 14-mm biliary type MF-ICC. B-mode ultrasound showed hypo-echogenicity lesion and dilated bile duct (A). Circular enhancement was observed in the arterial phase (B). Hypo-enhancement was observed in the portal venous phase (C) and late phase (D). White arrow indicated the margin of the lesion; red arrow indicated the dilated bile duct
Fig. 3
A 70-year-old male with a 32-mm biliary type MF-ICC. B-mode ultrasound showed hypo-echogenicity lesion and dilated bile duct (A). Circular enhancement was observed in the arterial phase (B). Hypo-enhancement was observed in the portal venous phase (C) and late phase (D). White arrow indicated the margin of the lesion; red arrow indicated the dilated bile duct
Fig. 4
A 76-year-old female with a 56-mm biliary type MF-ICC. B-mode ultrasound showed hypo-echogenicity lesion and dilated bile duct (A). Non-circular enhancement was observed in the arterial phase (B). Hypo-enhancement was observed in the portal venous phase (C) and late phase (D). White arrow indicated the margin of the lesion; red arrow indicated the dilated bile duct
Fig. 5
A 41-year-old female with 41-mm parenchymal type MF-ICC. B-mode ultrasound showed hypo-echogenicity lesion (A). Circular hyperenhancement was observed in the arterial phase (B). Hypo-enhancement was observed in the portal venous phase (C) and late phase (D). White arrow indicated the margin of the lesion; blue arrow indicated the left portal vein
Baseline characteristics collectionClinicopathological data of the patients were collected from medical records, including age, sex, serum tumor markers (AFP, CEA, and CA19-9), hepatitis B virus (HBV), cirrhosis, pathological grade (G1, G2, and G3) [16], pathological classification (small and large duct types), Ki-67 expression, and postsurgical outcomes. Ki-67 nuclear staining with a positive rate ≥ 50% was defined as high expression, whereas a positive rate < 50% was defined as low expression [17].
Statistical analysisIBM SPSS Statistics (version 23.0, IBM Corporation, Armonk, USA) was used for the statistical analysis. We use the Fleiss Kappa coefficient to assess agreement between the readers. The level of agreement was considered as follows: 0.01–0.20 = poor agreement; 0.21–0.40 = fair agreement; 0.41–0.60 = moderate agreement; 0.61–0.80 = substantial agreement; 0.81–1.00 = excellent agreement [18]. Categorical variables were compared using the Chi-Squared test or Fisher’s exact test. Continuous variables were compared using t-test or Mann–Whitney U test. Survival rates were calculated using the Kaplan–Meier method and compared using the Breslow test. Statistical significance was set at p < 0.05.
Comments (0)