Cells and reagents
The human myeloid leukemia cell line THP-1 was obtained from the Japanese Collection of Research Bioresources on November 24, 2021 (JCRB, Riken Cell Bank, Japan, #0112.1). Cells were used within 6 mo of thawing from stock and cultured in RPMI1640 medium (Sigma-Aldrich, St. Louis, MO) supplemented with 10% fetal bovine serum (FBS) under a humidified atmosphere of 5% CO2 at 37 °C. The mycoplasma contamination test was performed using TaKaRa PCR Mycoplasma Detection Set (Takara, Shiga, Japan) (Supplemental Fig. 1). Activated vitD (calcitriol), a histone deacetylase (HDAC) inhibitor Panobinostat, and phorbol 12-myristate 13-acetate (PMA) were sourced from Sigma-Aldrich. HDAC inhibitors belinostat, vorinostat, and AGF-2 were procured from Tokyo Chemical Industry Co., Ltd (Tokyo, Japan). Sirtinol, GM-CSF, and M-CSF were obtained from FUJIFILM Wako Pure Chemical Corporation (Osaka, Japan), and IFNγ was purchased from Peprotech (Cranbury, NJ). Antibodies (mouse monoclonal anti-human CD14-fluorescein isothiocyanate (FITC) [clone M5E2], mouse monoclonal anti-human CD163-phycoerithrin(PE) [clone GHI/61], and rat monoclonal anti-human CD80- allophycocyanin (APC) [clone W17149D], mouse monoclonal anti-human CCR1-PE [clone 5F10B29], mouse monoclonal anti-human CCR2-AlexaFluoro488 [clone K036C2] mouse monoclonal anti-human CCR4-Brilliant Violet(BV)421 [clone L291H4], and rat monoclonal anti-human CCR5-APC [clone J418F1], as well as isotype control antibodies) for flow cytometry and 7-amino-actinomycin D (7AAD) reagent were purchased from BioLegend (San Diego, CA) except mouse monoclonal anti-human NADPH Oxidase2 (NOX2)-PE [clone 7D5] and its isotype control antibody which were purchased from Medical & Biological Laboratories (MBL) (Tokyo, Japan). Chemokine receptor antagonists BX471 for CCR1, AZD2098 for CCR4, and Maraviroc for CCR5 were procured from Selleck Chemicals (Houston, TX).
Differentiation of THP-1 cells
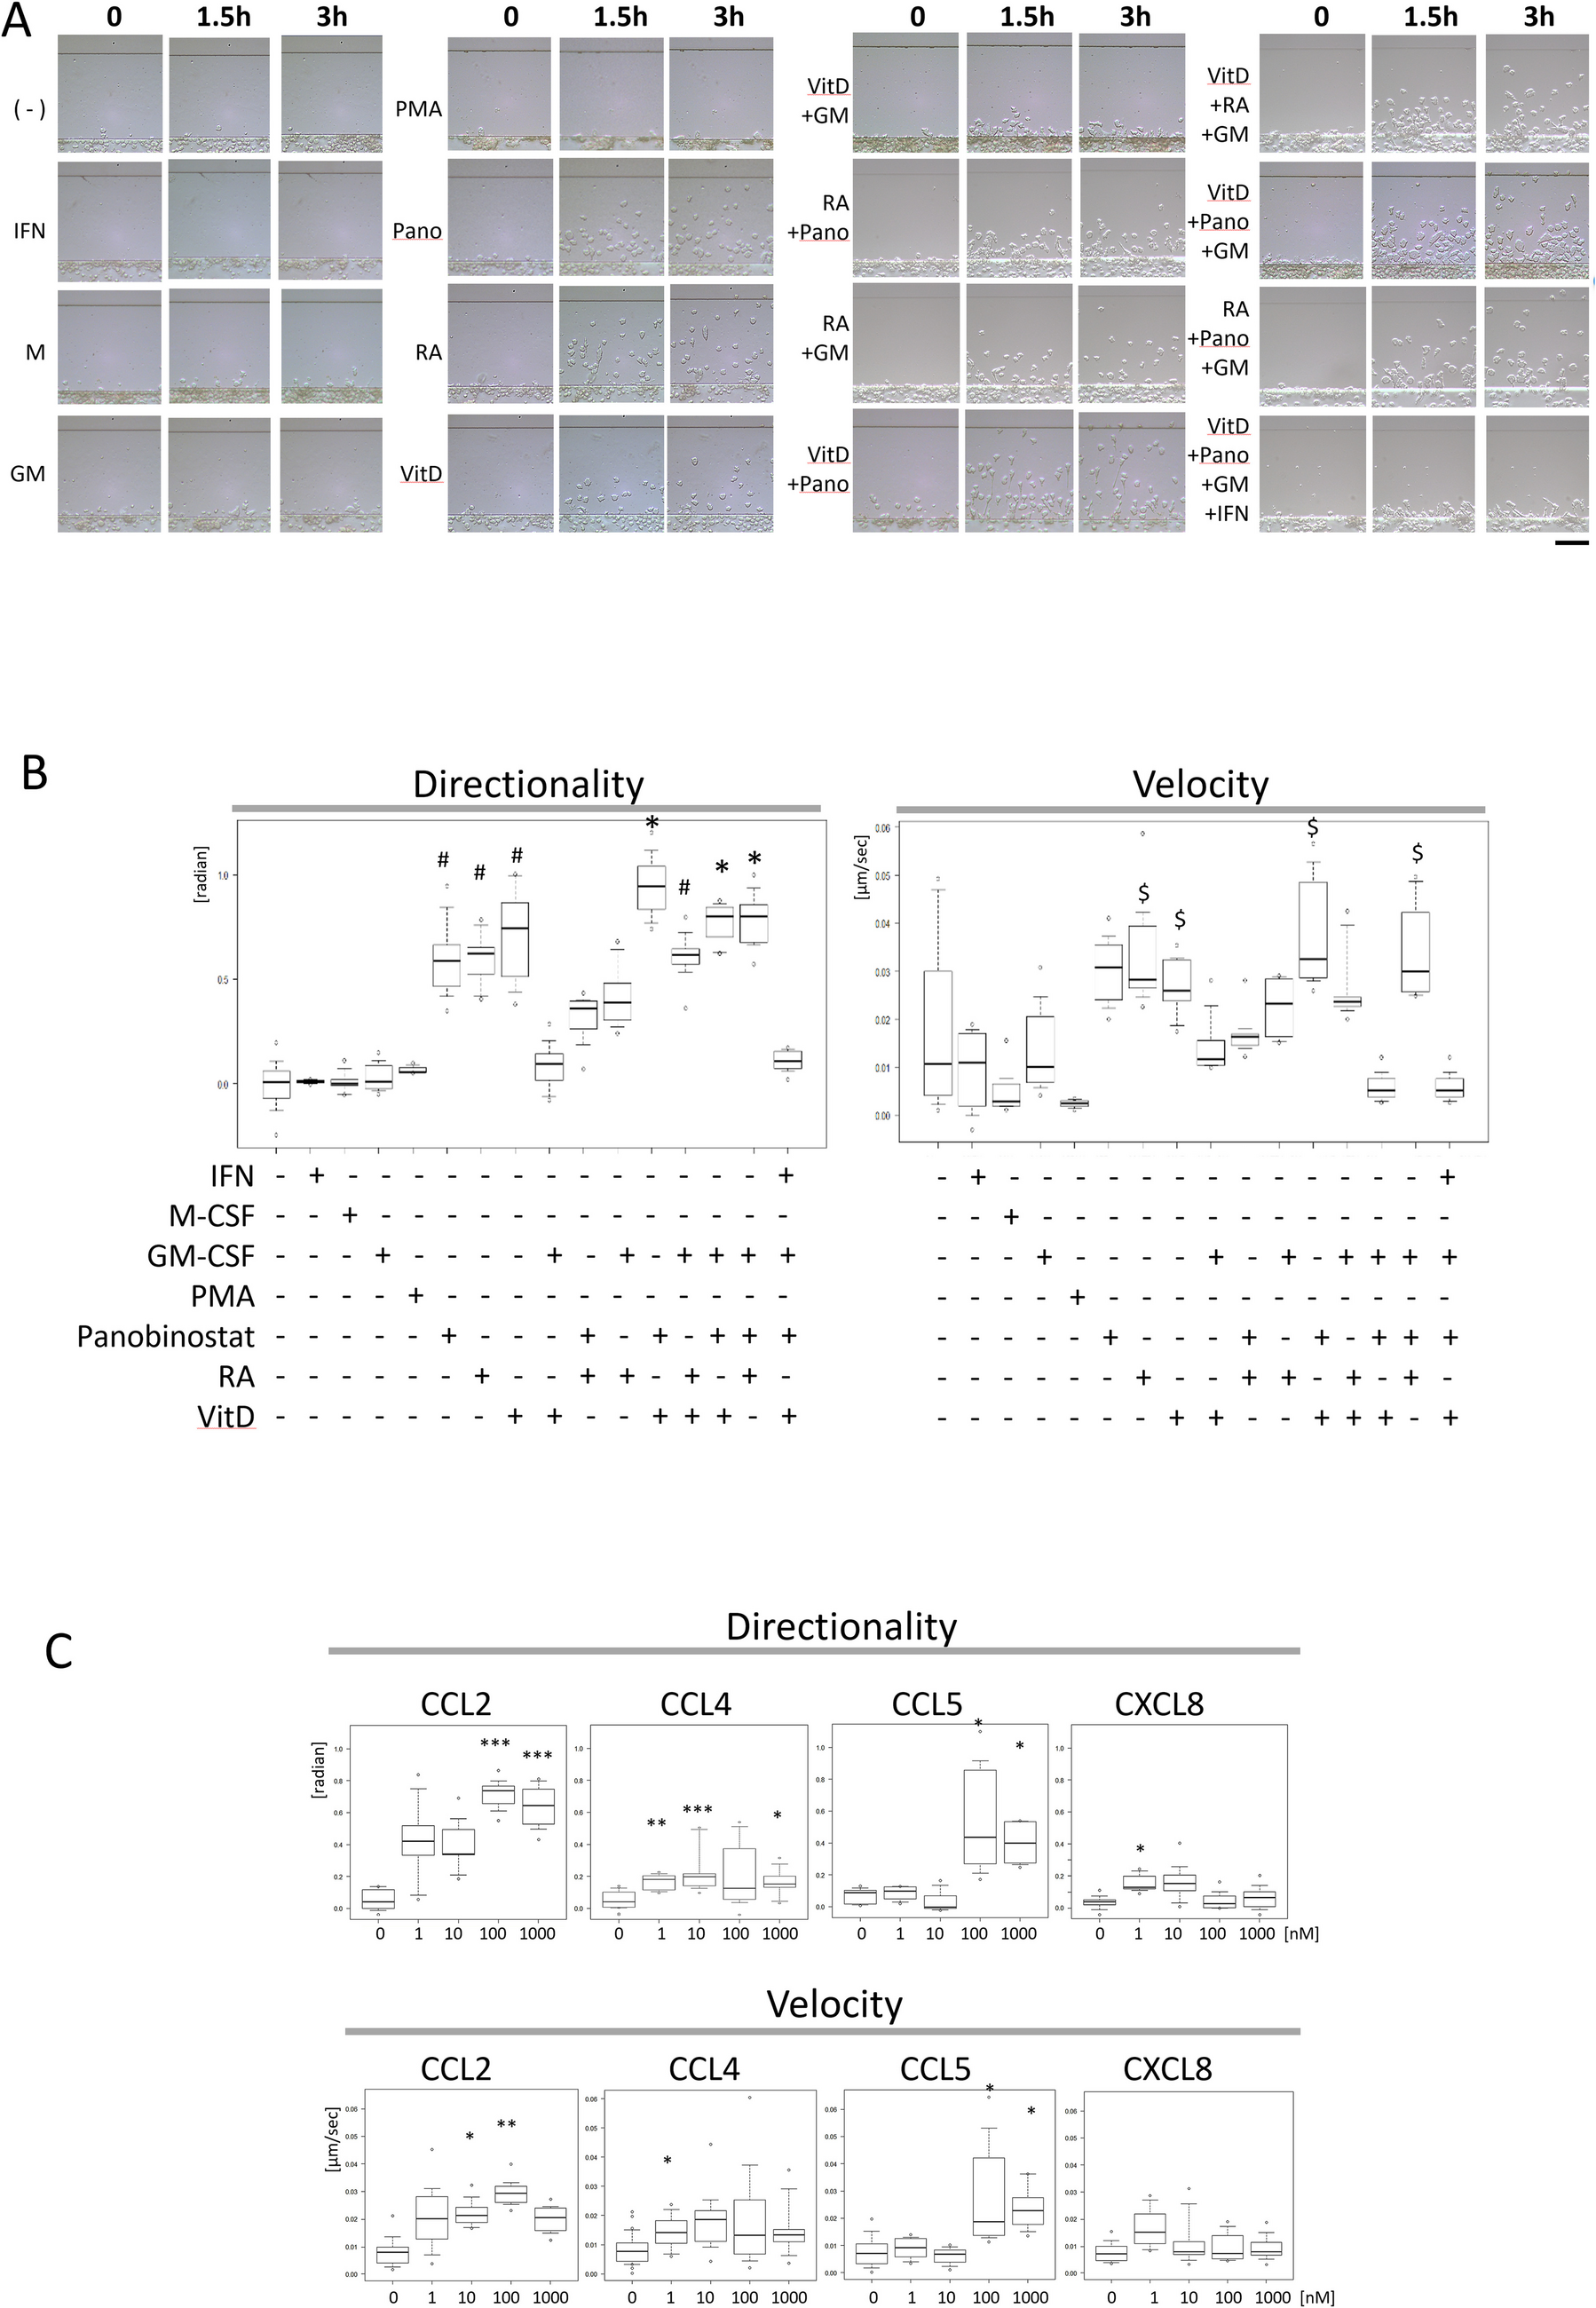
THP-1 cells in logarithmic growth were counted and resuspended in RPMI1640 medium containing 10% FBS at a concentration of 2.0 × 10⁶ cells/mL. A 250-μL aliquot of this suspension per well was transferred to wells of a 24-well plate and incubated with differentiation reagents or cytokines such as VitD, panpbinostat, GM-CSF, and/or IFNγ for 72–96 h. Cells were then washed twice with phosphate-buffered saline (PBS) and resuspended in RPMI1640 medium containing 0.1% bovine serum albumin (BSA) and 20 mM 4-(2-hydroxyethyl)−1-piperazineethanesulfonic acid (HEPES) (chemotaxis buffer) at 5.0 × 10⁶ cells/mL. These cells were maintained at 25 °C for subsequent chemotaxis assays or processed for flow cytometry, RNA extraction, phagocytosis assays, or superoxide production assays.
Chemotaxis assay
Chemotaxis was evaluated using the EZ-TAXIScan system (ECI Inc., Kawasaki, Japan) (Kanegasaki et al. 2003; Yamauchi et al. 2014). After assembling a TAXIScan holder with a 6-μm-depth chip, 1 μL of the cell suspension (5.0 × 10⁶ cells/mL) was injected into one channel. Cells were aligned at the start line, and baseline images were captured. A chemoattractant (1 μL), such as 10 nM CCL3 (MIP-1α), was then injected into the other side of the starting line to initiate chemotaxis. Images were captured every minute for 5 h at 37 °C and analyzed for directionality and velocity using the TAXIScan Analyzer 2 software (ECI Inc.) (Nitta et al. 2007).
RNA preparation and quantitative polymerase chain reaction
Total RNA was extracted using the RNeasy® kit (QIAGEN, Hilden, Germany) following the manufacturer’s protocol. RNA concentrations were extracted into 30–32 μL water for each sample, and the RNA concentration was measured using a NanoDrop One® spectrophotometer (Thermo Fisher Scientific, Waltham, MA). Reverse transcription was performed using ReverTra Ace® qPCR RT Master Mix. Gene expression was analyzed using SYBR™ Green PCR Master Mix (Thermo Fisher Scientific) and a StepOnePlus™ real-time PCR system (Applied Biosystems, Waltham, MA). ACTB (β-Actin) was used as an internal control for normalization of data. The primers used are presented in Table 1.
Table 1. Primers used for the quantitative real-time PCR
Flow cytometry
Cells in chemotaxis buffer were incubated with a human FcR-blocking reagent (Miltenyi Biotec, Bergisch Gladbach, Germany) for 10 min before antibody labeling. Antibodies were added to the suspension to be 1:10 dilution, and samples were incubated on ice for 1 h with occasional tapping. Cells were washed twice with ice-cold PBS containing 0.1% BSA and centrifuged at 300 × g for 5 min. The pellet was resuspended in 500 μL of ice-cold PBS with 0.1% BSA for flow cytometric analysis using a CytoFLEX flow cytometer (Beckman Coulter, Brea, CA). Live cells were distinguished using 7AAD reagent, and 10,000 live cells per sample were acquired. Data were analyzed using FlowJo software (version 10.9.0) (Becton, Dickinson & Company, Franklin Lakes, New Jersey).
Phagocytosis assay
Phagocytosis was evaluated using a fluorescently labeled microbead kit (Cayman Chemical Company, Ann Arbor, MI) via flow cytometry following the manufacturer’s protocol. Briefly, cells were washed with PBS and resuspended in the assay buffer provided in the kit. The suspension was aliquoted into wells of a 96-well plate, and IgG-FITC-coated latex beads were added. Samples were incubated at 37 °C for 1 h, washed, and quenched with 5 μL of 10 × trypan blue. Subsequently, cells were washed with the assay buffer twice and analyzed using a CytoFLEX flow cytometer (Beckman Coulter). Live cells were distinguished using 7AAD reagent and 10,000 live cells per sample were acquired. Data were analyzed using FlowJo software (version 10.9.0) (Becton, Dickinson & Company).
ROS production assay
Superoxide dismutase (SOD)-inhibitable ROS production was quantified using Diogenes-luminol solution as previously described (Kawai et al. 2022). Briefly, the cells (1 × 10⁵ cells per 100 μL PBS) were mixed with 4 μL Diogenes-luminol solution and stimulated with 200 ng/mL PMA. Samples were transferred to wells of a white 96-well plate (IWAKI brand, AGC Techno Glass, Shizuoka, Japan), and chemiluminescence was measured for 22 min at 37 °C with or without 0.2 mg/mL SOD using a Varioskan® Flash spectral scanning multimode reader (Thermo Fisher Scientific, Waltham, MA).
Statistical analyses
First, the Kolmogorov–Smirnov test was performed to determine normality. Statistical analysis was performed using the parametric Student’s t-test or the non-parametric Kruskal–Wallis test, followed by Dunn’s multiple-comparison test. The number of the samples is described in each figure legend. Results with p < 0.05 were considered statistically significant.

Comments (0)