
Remember me

To ensure the reproducibility of the results, each experimental condition was independently performed at least twice, with most experiments conducted three times.
Cell cultureThe human iPS cell line GM25256 (Coriell Institute for Medical Research) was cultured in Essential 8 medium (Thermo Fisher) per the manufacturer’s instructions. Rock inhibitor Y23672 (Selleck Chemicals) was added to a final concentration of 10 μM during cell passaging. Hela, HEK293T and SW480 cells were maintained in DMEM (Corning) with 10% FBS (Corning) and 100 U ml−1 penicillin−streptomycin (Thermo Fisher). All mammalian cells were incubated at 37 °C with 5% CO2. iPS cells were differentiated into neural progenitor cells using PSC Neural Induction Medium (Gibco) following the manufacturer’s protocol. iPS cells were differentiated into cardiac progenitor cells and epicardial-derived fibroblasts as described56.
AntibodiesRabbit polyclonal antisera against hNDF were generated as previously described10. The following commercial primary antibodies were used in this study: anti-hSpt16 (Cell Signaling, 12191S), anti-GAPDH (Cell Signaling, 5174S), anti-LEDGF (Proteintech, 25504-1-AP), anti-H3 (Cell Signaling, 4499), anti-H3K36me3 (Abcam, ab9050), anti-Rpb2/Pol II (Genetex, GTX102535), anti-Oct4 (Cell Signaling, 2750S), anti-NDF/GLYR1 (proteintech, 14833-A-AP, for immunofluorescence only), anti-Nestin (Cell Signaling, 33475S), ChIP−seq spike-in antibody (Active Motif, 61686), donkey anti-rabbit Alexa Fluor 555 cross-absorbed secondary antibody (Thermo Fisher, A31572), anti-rabbit Alexa Fluor 647 conjugate secondary antibody (Cell Signaling, 4414S), anti-Vimentin (Cell Signaling, 5741), anti-RNA pol II CTD phospho Ser2 antibody (Abcam, ab237280) and anti-RNA poly II CTD phospho Ser5 antibody (Active Motif, 61085).
Plasmids and cloningRecombinant hNDF expressing vectors pET21b-His6-hNDF and pET21b-hNDF-FLAG for bacterial expression were cloned as described previously10,11. The pET21b-His6-hNDF-mEGFP vector was generated by inserting an EGFP coding DNA fragment into the pET21b-His6-hNDF vector using the Gibson Assembly cloning kit (NEB). Expression vectors for NDF truncates and mutants were generated with a Q5 site-directed mutagenesis kit (NEB), using the following primers: for NDF-K161A mutants, primers NDF-K-For (5′-AGAGCCCAAGAGCAAAGTCCCCGG-3′) and K-Rev (5′-TGCCAGAGGGGATTTGGAGCCTCT-3′) were used; for NDF-R162A mutants, primers R-For (5′-GCAGCCCAAGAGCAAAGTCCCCGG-3′) and R-Rev (5′-TTTCAGAGGGGATTTGGAGCCTCT-3′) were used; for NDF-KR mutants, primers KR-For (5′-ATCCCCTCTGGCTGCAGCCCAAGAGC-3′) and KR-Rev (5′-TTGGAGCCTCTCTCTGAAG-3′) were used. The sf9 insect cells expression vectors for recombinant hFACT proteins were constructed by cloning hSSRP1 and SUPT16H/hSpt16 cDNAs into pFastBac vectors. N-terminal His6-, His6-GFP- or His6-mCherry- tags were inserted in-frame into pFastBac-FLAG-hSpt16 by using the NEBuilder HiFi DNA Assembly Master Mix (NEB) to give pFastBac-His6-mEGFP-hSpt16 and pFastBac-His6-mCherry-hSpt16. For yeast FACT complex expression vector, ySpt16 and yPob3 cDNAs were PCR amplified from purified S. cerevisiae genomic DNA and inserted into a dual-expression pET vector to obtain pET21b-His6-ySpt16-Flag-yPob3. For yeast NHP6 expression vector, NHP6 cDNA was amplified from purified S. cerevisiae genomic DNA and cloned into a pET21b vector with an N-terminal His6 tag and C-terminal mEGFP tag to produce pET21b-His6-yNHP6-mEGFP. For yeast DSIF complex expression vector, ySpt5 and ySpt4 cDNAs were PCR amplified from purified S. cerevisiae genomic DNA and inserted into a dual-expression pET vector to obtain pET21b-His6-ySpt5-Flag-ySpt4. For yeast TFIIS expression vector, full-length yTFIIS cDNA was produced as a gBlock (IDT) and cloned into a pET21b vector with an N-terminal His6 tag to produce pET21b-His6-yTFIIS. All expression constructs were sequenced for verification. CRISPR guide RNA (gRNA) sequences for targeting the hNDF (5′-TATGTAGGCTCGGTACACGG-3′) or hSpt16 (5′-TCGGGCCGTGGCTCTAACCG-3′) loci were inserted into the PX459-Cas9 vector (Addgene, 62988). Homologous recombination donor DNA templates were generated using two homology arms (~0.8 kb each), PCR amplified with Q5 DNA polymerase (NEB) from human iPS cell genomic DNA. The mini-IAA_degron-mEGFP fragment was PCR amplified from the plasmid pSH-EFIRES-B-Seipin-miniIAA7-mEGFP (Addgene, 129719). The mScarlet fragment was PCR amplified from pLBS-mScarlet (Addgene, 129337), and the fragments IRES and AFB2 were PCR amplified from plasmid pSH-EFIRES-P-AtAFB2-mCherry-weak NLS (Addgene, 129716), the V5 tag and nuclear localization signal sequence (5′-GTAAGCCTATCCCTAACCCTCTCCTCGGTCTCGATTCTACGGCCGCAGCCAAACGGGTCAAACTTGATTAG-3′) was synthesized by IDT. All components were assembled into the CP1024 vector using NEBuilder HiFi DNA Assembly Master Mix (NEB), as per the manufacturer’s suggestions. gRNA sequences in the donor DNA templates were altered to create silent mutations using a Q5 mutagenesis kit (NEB). To generate NDF_K161A mutant human iPS cells, a 20-nt gRNA sequence (5′-CTCTTGGGCTCTTTTCAGAG-3′) was cloned into the PX458-Cas9-GFP vector. A single-strand DNA oligo (/AlT-R-HDR1/G*G*GGCCGACCCCGCTTCCGGGGACTTTGCTCTTGGGCTCTTGCCAGAGGGGATTTGGAGCCTCTCTCTGAAGAGCCTGAAGAC*A*C/AlT-R-HDR2/) synthesized by IDT was used as a donor DNA template.
Generating knock-in cellsTo generate the knock-in cell lines, 0.7 μg PX459-Cas9-gRNA, 0.2 μg pCE-mP53DD (Addgene, 41586) and 1.2 μg donor vectors were transfected into 100,000 human iPS cells using 2 μl Lipofectamine Stem Transfection reagent (Thermo Fisher) following the manufacturer’s instructions. The non-homologous end-joining (NHEJ) inhibitor SCR7 (Sigma) was added at a final concentration of 1 μM to enhance homology-directed repair (HDR) efficiency. A 3 days post-transfection, cells expressing GFP or mScarlet were sorted by FACS into Matrigel-coated 96-well plates. Single-cell clones were maintained and expanded. Genotyping was performed using NDF primers, forward (5′-GCCAGAGACTGAGCCATCTC-3′) and reverse (5′-GTGGGCTGGTCCAGAATGAAC-3′) to identify hNDF locus knock-in clones, and hSpt16 primers, forward (5′-GCTTACCTATTGCTAACTAATAATGCC-3′) and reverse (5′-CCCCTAAACCCATAAACACAAATG-3′) for the hSpt16 locus. For the NDF and SUPT16H double knock-in cell lines, two separate experiments were carried out sequentially. Genome-edited iPS cells were confirmed for pluripotency with Oct4 staining and differentiation into neural progenitor cells. For the NDF-K161A knock-in, 3 µl of 10 µM ssDNA donor template was cotransfected with 0.7 μg PX458-Cas9-mcherry-gRNA vector and 0.15 μg pCE-mP53DD into 100,000 human iPS cells using 2 μl Lipofectamine Stem Transfection reagent (Invitrogen). At 2 days post-transfection, GFP-positive single cells were FACS sorted into 96-well plates. Genotyping used primers KR_F (5′-GACGTCATCCCACAATTCTTCT-3′) and R-R1 (5′-CGGGGACTTTGCTCTTGAGCT-3′). The NDF-K161A mutants produced a PCR product that, when digested with XcmI restriction enzyme (NEB), resulted in 181 bp fragments, unlike the PCR product from NDF_WT cells. All clones, either homozygous or heterozygous, were validated by western blot analysis and DNA sequencing (Azenta).
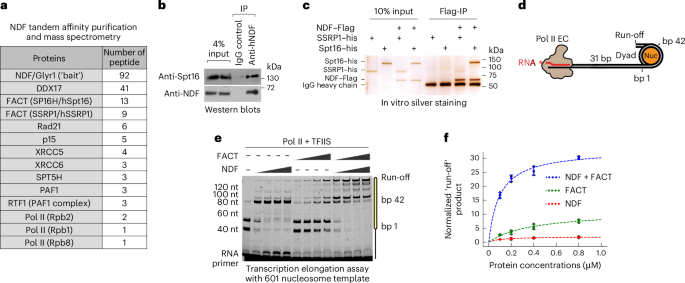
Lentiviral infectionHeLa cells expressing hNDF−Flag−GFP were produced by cotransfecting HEK293T cells with pHR-IRES-puro-NDF-FLAG-GFP vector, psPAX2 and pMD2.G to generate lentivirus. At 48 h post-transfection, the media from HEK293T cells, containing the lentiviruses, was collected and used to infect HeLa cells. Stable cells were established by selecting with 1 µg ml−1 puromycin. For tandem affinity purification, HeLa cells stably expressing NDF−Flag−GFP were collected and lysed in NETN buffer (20 mM Tris−HCl, pH 8.0, 100 mM NaCl, 1 mM EDTA, 1 mM MgCl2, 0.5% Nonidet P-40 and 1 μg ml−1 each pepstatin A and aprotinin) for 30 min at 4 °C. The crude lysates were sonicated three times for 10 s at 4 °C to release chromatin-bound proteins, and cleared by centrifugation (15,000g, 30 min, 4 °C). The cleared lysate was incubated with Flag M2 agarose beads (Sigma) for 4 h at 4 °C with gentle agitation. Beads were washed four times with NETN buffer and bound proteins eluted by incubating with 150 ng μl−1 Flag peptide (Sigma) in NETN buffer for 2 h at 4 °C. The eluate was then incubated with GFP-Trap beads (Chromotek) for 2 h at 4 °C with gentle agitation. After three washes with NETN buffer, bound proteins were eluted in Laemmli sample buffer, resolved by SDS−PAGE and analysed by mass spectrometry at the Taplin Mass Spectrometry Facility (Harvard Medical School).
Western blotCells were lysed using 1× SDS sample buffer (50 mM Tris−HCl pH 6.8, 1% SDS, 8% glycerol, 0.02% bromophenol blue and 2% 2-mercaptoethanol). The lysates were briefly sonicated and denatured at 95 °C for 5 min. Proteins were then separated by SDS−PAGE. Following the hybridization with the primary antibodies (described above), the membrane was incubated with HRP-conjugated Protein A (Cell Signaling, 12291). The protein of interest was visualized using SuperSignal West Pico PLUS Chemiluminescent Substrate (Thermo Fisher) and imaged with a ChemiDoc Imaging System (Bio-Rad).
Protein purificationHuman NDF recombinant proteins were purified as previously described10,11. Recombinant Drosophila melanogaster core histones were synthesized in Escherichia coli and purified following established methods57. The S. cerevisiae RNA Pol II was purified as described58. Recombinant full-length yeast TFIIS was prepared as described59. Yeast Spt4 and Spt5 were co-expressed in Rosetta 2 (DE3) pLysS (Millipore Sigma) using a dual-expression vector. Protein expression was induced with 0.4 mM IPTG for 16 h at 19 °C. All subsequent steps were conducted at 4 °C. The bacterial pellets were resuspended in lysis buffer (50 mM Tris−HCl pH 7.5, 700 mM NaCl, 10 mM 2-mercaptoethanol, 10 mM imidazole, 5% glycerol, 0.2 mM PMSF and 1× protease inhibitor cocktail (Roche)) and sonicated on ice. Insoluble material was removed by centrifugation at 26,916g for 30 min, and the supernatant was incubated with Ni-NTA agarose (Qiagen) for 4 h on a nutator. The bound proteins were washed twice with buffer A (50 mM Tris−HCl pH 7.5, 700 mM NaCl, 10 mM 2-mercaptoethanol, 25 mM imidazole and 5% glycerol) followed by two washes with buffer B (20 mM Tris−HCl pH 7.5, 150 mM KCl, 10 mM 2-mercaptoethanol, 25 mM imidazole, 5% glycerol and 1 μM ZnCl2). The protein was eluted with buffer E1 (20 mM Tris−HCl pH 7.5, 150 mM KCl, 1 mM DTT, 250 mM imidazole, 5% glycerol and 1 μM ZnCl2). The fractions containing the proteins were combined and passed through a Bio-Rad Econo-Pac chromatography column containing 500 μl Flag M2 agarose beads (Sigma) five times. The proteins were then washed twice with buffer C (20 mM Tris−HCl pH 7.5, 400 mM KCl, 1 mM DTT, 5% glycerol and 1 μM ZnCl2), and twice with buffer E1 without imidazole. Finally, the protein was eluted eight times with 0.5 ml buffer E2 (20 mM Tris−HCl pH 7.5, 150 mM KCl, 1 mM DTT, 5% glycerol, 1 μM ZnCl2 and 400 ng μl−1 3× Flag peptide (Sigma)). The fractions containing yDSIF protein were combined and stored at −80 °C. Recombinant human his-FACT subunits were expressed separately in Sf9 cells (Thermo Fisher) using the Bac-to-Bac Baculovirus Expression System, and purified similar to his-hNDF proteins. Both hNDF and hFACT proteins were stored in a buffer containing 10 mM Tris−HCl at pH 7.5, 0.2% (v/v) nonidet P-40, 0.2 M NaCl, 10% (v/v) glycerol and 5 mM 2-mercaptoethanol. For the Flag-tagged FACT complex, Flag-hSpt16 and untagged-hSSRP1 were co-expressed in Sf9 cells and purified following previously described methods14. Cell pellets were washed with ice-cold PBS and lysed in FLAG-600 buffer (600 mM NaCl, 10 mM Tris−HCl at pH 7.5, 0.1% NP-40 (v/v), 15% (v/v) glycerol and 1 mM PMSF). The cell suspension was briefly sonicated and clarified by centrifugation at 26,916g at 4 °C. The cleared cell extract was incubated with anti-Flag M2 agarose (Sigma) for 4 h at 4 °C, and the resin was subsequently washed with FLAG-600 buffer. Proteins bound to the resin were eluted using 400 ng μl−1 3× Flag peptide (Sigma) containing NDF buffer (10 mM Tris−HCl at pH 7.5, 0.2% (v/v) NP-40, 0.2 M NaCl, 10% (v/v) glycerol and 5 mM 2-mercaptoethanol). All proteins were quantified by SDS−PAGE, and a standard curve was established using purified BSA (Thermo Fisher). Recombinant his-yNHP6-GFP and his-ySpt16-Flag-yPob3 proteins were purified similar to his-hNDF proteins. his-ySpt16-Flag-yPob3 proteins were further purified with Flag M2 agarose beads, proteins finally eluted in the buffer containing 10 mM Tris−HCl pH 7.5, 200 mM NaCl, 5% glycerol, 1 mM 2-mercaptoethanol and 400 ng μl−1 3× Flag peptide (Sigma)).
Nucleosome preparationThe Widom and PC 601 DNA used for the in vitro transcription elongation assay (as listed in Supplementary Table 1) were amplified using PCR and purified using the QiaQuick gel extraction kit (Qiagen). The purified dsDNA was subsequently digested with the TspRI restriction enzyme (NEB). The resulting DNA fragment was gel purified and reconstituted into nucleosomes using the sequential salt dialysis method, as described previously57. For the Cy2-labelled Widom 601 nucleosome, Cy2-labelled 601 DNA was generated by amplifying the 601 Widom nucleosome positioning sequence with a Cy2-labelled primer at the 5′ end.
Transcription elongation assaysThe transcription elongation assays were performed with slight modifications to previously described methods22. In our in vitro transcription elongation assays, the transcripts generated were sensitive to RNase A but not RNase H, indicating that the nascent RNA did not form a DNA−RNA hybrid during Pol II elongation, which can sometimes occur with purified Pol II. Initially, a 100 nM Widom 601 nucleosomal template was incubated with equimolar amounts of a 6-FAM 5′-labelled 11-nt RNA (5′-/56-FAM/ rUrUrA rUrCrA rCrUrG rUrC-3′) at 30 °C for 10 min to facilitate RNA annealing to the nucleosomal template. RNA Pol II (120 nM) was then added and incubated for an additional 10 min at 30 °C. Each incubation step was balanced with compensation buffer and water to maintain the final buffer composition: 130 mM NaCl, 20 mM Na−HEPES (pH 7.4), 3 mM MgCl2, 4% (v/v) glycerol and 1 mM DTT. Transcription elongation was initiated by adding ATP, CTP, GTP and UTP (1 mM each), along with TFIIS (100 nM), and continued for 10 min at 30 °C unless otherwise specified. The reaction was terminated by adding an equal volume of gel loading buffer (1 ml of gel loading buffer contains 0.9 ml of deionized formamide, 0.1 ml of 0.5 M EDTA and 2 μl of 4% (w/v) bromophenol blue). Samples were denatured at 95 °C for 10 min with the cap open and immediately chilled on ice. Subsequently, the samples were separated by denaturing acrylamide gel electrophoresis. Gel visualization was performed using the 6-FAM label with an Amersham Typhoon at an excitation wavelength of 490 nm and an emission wavelength of 510 nm. All transcription elongation assays were conducted independently and repeated at least three times. The full length of transcripts was quantified using ImageJ software, with products normalized against the total intensity of the respective reaction lane to correct potential errors during gel loading. Enzyme kinetic parameters were determined using the Michaelis−Menten model. While our nucleosome transcription assay does not strictly follow simple enzyme kinetics, this approach allowed us to calculate comparable efficiency ratios between conditions. The goodness of fit for each kinetic model was evaluated using the coefficient of determination (R2). Nonlinear regression analysis was performed using GraphPad Prism 9. The Michaelis−Menten equation (v = Vmax[S]/(Km + [S])) was fit to the initial velocity data using the least squares method. Vmax and Km were estimated for each condition, along with their standard errors and 95% confidence intervals. The specificity constant (analogous to kcat/Km) was calculated using Monte Carlo simulation methods using a uniform distribution sampling method to account for uncertainties in Vmax and Km estimates. Fold changes between conditions were determined by comparing these ratios. For the transcription products sedimentation assay, each reaction was performed in a final volume of 20 μl. After 10 min chasing with 1 mM rNTP, the transcription products were immediately put on ice for 5 min, followed by centrifugation at 17,200g for 5 min at 4 °C. The pellet was resuspended with 20 μl gel loading buffer and supplemented with an additional 20 μl transcription reaction buffer before the denaturing urea gel analysis. For the RNase A protection assays, RNase A (NEB) was added to the transcription products at final concentrations of 0, 0.02 or 0.2 ng μl−1, and samples were incubated at 30 °C for 3 min. Subsequently, samples were processed using the same procedure as described for the transcription products sedimentation assay.
ImmunoprecipitationFor co-immunoprecipitation, approximately 10 million cells were lysed in 1 ml of RIPA buffer (25 mM Tris−HCl pH 7.6, 150 mM NaCl, 1% Nonidet P-40, 1% sodium deoxycholate, 0.1% SDS and Protease Inhibitor Cocktail (Roche)). The lysates were sonicated twice for 10 s and then centrifuged for 10 min (26,916g, 4 °C) to remove cell debris. Then, 500 μl of the supernatant was incubated with 20 μl of Protein A agarose (Thermo Fisher) precoated with 4 μl of hNDF antiserum. The mixture was incubated at 4 °C for 3 h on a nutator, then the beads were captured by centrifugation for 1 min at 1,000g and washed five times with 1 ml of cold RIPA buffer. The proteins bound to the beads were eluted in SDS−PAGE buffer and analysed by western blot. For the in vitro pull-down assay, unless specified, 40 pmol of His6-tagged NDF-WT, truncates or mutants were incubated with 20 pmol of Flag-tagged hSpt16 or FACT proteins and 40 µl beads (Ni-NTA beads for his-tagged bait protein, or Flag M2 beads for Flag-tagged bait protein) in 300 μl of pull-down buffer (10 mM Tris−HCl (pH 7.5), 200 mM NaCl, 0.2% Nonidet P-40, 10% glycerol and Protease Inhibitor Cocktail (Roche)) at 4 °C for 3 h. The beads were then washed three times with the same pull-down buffer, following the procedure used for the co-immunoprecipitation. Proteins were eluted with SDS−PAGE buffer and visualized by SDS−PAGE and silver staining.
In vitro droplet and sedimentation assayRecombinant GFP or mCherry fusion proteins were first diluted and equilibrated in a specific salt concentration by adding NaCl or droplet formation buffer (10 mM Tris−HCl pH 7.5, 5% glycerol and 0.1% NP-40), followed by a 10-min 17,200g centrifugation at 4 °C to remove any insoluble proteins formed during the freeze−thaw process. The proteins were then mixed at appropriate concentrations and promptly loaded into a custom-made chamber, which consisted of a glass slide sealed with a coverslip using two parallel strips of double-sided tape. For droplet formation experiments in alternative buffers, the indicated protein amounts were mixed to achieve the final buffer concentration. Alternative buffers included transcription buffer (20 mM Na−HEPES, pH 7.4, 130 mM NaCl, 3 mM MgCl2, 4% (v/v) glycerol, 1 mM DTT and 1 mM rNTPs) and pull-down/immunoprecipitation buffer (10 mM Tris−HCl, pH 7.5, 0.2 M NaCl, 0.2% NP-40, 10% glycerol and 1 mM β-mercaptoethanol). The samples were then loaded into imaging chambers and visualized. Imaging was performed using a Zeiss AXIO epifluorescence microscope or Zeiss LSM800 confocal microscope with a 63× oil objective. Images typically show droplets settled on the glass coverslip under 100 mM NaCl conditions. For the sedimentation assay, each reaction had a typical final volume of 100 μl. After a 10-min equilibration at room temperature (22 °C), protein samples were centrifuged at 17,200g for 10 min at 22 °C using a tabletop temperature-controlled microcentrifuge. Post-centrifugation, the supernatant and pellet were promptly separated into two tubes. The pellet was thoroughly resuspended in the same buffer to match the volume of the supernatant. Proteins from both fractions were denatured and analysed on 8% SDS−PAGE stained with Coomassie blue. Band intensities were quantified using ImageJ software. To assess condensate formation at different temperatures, proteins were mixed at a final concentration of 1 μM and incubated for 10 min at 4 °C, 25 °C or 37 °C. Samples were then loaded onto CELLview cell culture dishes and imaged using an internal reflection fluorescence microscope (DMi8 TIRF, Leica) at corresponding chamber temperatures of 25 °C (for both 4 °C and 25 °C pre-incubated samples) and 37 °C (for the 37 °C sample).
FRAP in live cellsFRAP experiments were conducted using a total internal reflection fluorescence microscope (DMi8 TIRF, Leica) equipped with an Infinity Scanner system (Leica) at room temperature. Images were captured using a 100× oil objective at a rate of 1 Hz. A circular region with a radius of 1.5 μm was photobleached at the centre of the puncta using a brief pulse (~1 s) of a focused 488 nm laser. Subsequently, fluorescence recovery was monitored every 2 s for the specified duration, and the data were analysed using Fiji 2.1.0 software. To minimize the impact of photobleaching and boundary effects, fluorescence of the bleached region (IROI) was normalized by the fluorescence of the entire puncta (Ipunc) using the following equation, following background subtraction:
$$I\left(t\right)=\frac_}}\left(t\right)-_}}(t)}_}}\left(t\right)-_}}(t)}$$
The timepoint immediately following the bleaching event was designated as time zero. The fluorescence intensity (I(t)) was normalized such that the average intensity at I(t < 0) equals 1.
Cell treatmentsFor Aux-inducible degron experiments, cells with degron tags were treated with 0.5 mM 3-indoleacetic acid dissolved in DMSO (IAA) (Sigma) or 0.1% (v/v) DMSO in the culture media for the specified duration before collecting for analysis. For ChIP−seq experiments involving 1,6-Hex treatment, cells were treated with 1.5% 1,6-hexanediol for 10 min before crosslinking. For imaging studies, cells were treated with a 3% 1,6-Hex solution for 10 min before being fixed.
Cell cycle analysisNDF−degron iPS cells were treated with DMSO or Aux for 2 h and 48 h. After treatment, cells were dissociated with 1× TrypLE Select Enzyme (Thermo Fisher, 12563029). Two million cells were washed with PBS and and resuspended in 300 μl of cold (4 °C) PBS. Cells were fixed by the dropwise addition of 0.8 ml of cold (4 °C) ethanol followed by incubation at 4 °C for a minimum of 24 h. After fixation, the cells were pelleted and resuspended in 1 ml of PBS containing 50 μg ml−1 of propidium iodide (Sigma, P4170) and 10 μg ml−1 of RNase A (NEB, T3018). The cells were incubated for 30 min at 22 °C and then subjected to flow cytometry analysis.
Cell apoptosis analysisNDF−degron iPS cells were treated with DMSO or Aux for 48 h. After treatment, the cells were dissociated using 1× TrypLE Select Enzyme (Thermo Fisher, 12563029), washed with cold 1× PBS and stained with Annexin V Conjugate (Thermo Fisher, A23202) according to the manufacturer’s instructions. The cells were then subjected to flow cytometry analysis.
RNA-FISHCells were seeded on Matrigel-coated coverslips and cultured for 24 h before the experiment. Cells were then fixed with 4% paraformaldehyde (PFA) (Fisher) in PBS for 10 min at room temperature. This was followed by two PBS washes and a permeabilization step using 0.3% Triton X-100 (Sigma-Aldrich) in PBS for 5 min, then washed three times with PBS. Next, cells were stained with NDF antibody and Alexa 555 secondary antibody. After protein staining, cells were fixed again with 4% PFA and continued with RNA-FISH staining. Cells were first incubated in wash buffer A, containing 20% Stellaris RNA-FISH wash buffer A (Biosearch Technologies) and 10% deionized formamide (EMD Millipore) in RNase-free water (Life Technologies), for 5 min. Then, 100 μl of a 12.5 μM human ACTB probe (Biosearch Technologies, ISMF-2003-5) in hybridization buffer, consisting of 90% Stellaris RNA-FISH hybridization buffer (Biosearch Technologies) and 10% deionized formamide, was added to the cells and incubated overnight at 37 °C. Post-hybridization, cells were washed for 30 min with wash buffer A at 37 °C, followed by a nuclear stain of 5 ng ml−1 4,6-diamidino-2-phenylindole (DAPI) (Bio-Rad) in wash buffer A for 30 min at 37 °C, and a final 5-min wash in wash buffer B (Biosearch Technologies) at room temperature. Coverslips were then mounted on glass slides using Vectashield mounting medium (Vector Laboratories), sealed with nail polish and imaged using a Zeiss LSM800 confocal microscope with a 63× oil objective and Airyscan module. Image processing and export were conducted using ZEN imaging software.
ImmunofluorescenceCells were seeded on Matrigel-coated CELLview cell culture dishes (Greiner) for 24 h before the experiment. For native condition immunofluorescence, cells were washed with 1× PBS and fixed with 4% PFA for 10 min at 21 °C. Permeabilization was performed with 0.3% Triton X-100 for 5 min at room temperature. Cells were blocked with 2% goat serum for Oct4 immunofluorescence or 2% donkey serum for NDF/GLYR1 immunofluorescence in 1× PBS (blocking buffer) for 30 min at room temperature. The cells were then incubated with a 1:500 dilution of Oct4 antibody (Cell Signaling, 2750S) or 1:100 dilution of NDF/GLYR1 antibody (Proteintech, 14833-1-AP) in the blocking buffer at room temperature for 1 h. Following this, the cells were washed three times with 1× PBS + 0.1% Tween-20 for 5 min each and incubated with a 1:500 dilution of goat anti-rabbit IgG (H + L), F(ab’)¬2 Fragment (Alexa Fluor 647 conjugate) (Cell Signaling, 4414S) for Oct4 or Donkey anti-Rabbit IgG (H + L) Highly Cross-Adsorbed Secondary Antibody, Alexa Fluor 555 (Thermo Fisher, A31572) in the blocking buffer for 1 h at room temperature. The microscope was specifically configured and tested to ensure no signal bleed-through between fluorescence channels. After three additional washes with 1× PBS + 0.1% Tween-20, nuclei were counterstained with 1 µg ml−1 DAPI in PBS for 5 min. After a brief wash with 1× PBS, cells were imaged using a Zeiss LSM800 confocal microscope with a 63× oil objective and Airyscan module. Image processing and export were performed using ZEN imaging software. To image chromatin-bound proteins, cultured cells were washed with 1× PBS and treated with a CSK buffer35 (10 mM Pipes, pH 7.0, 100 mM NaCl, 300 mM sucrose and 3 mM MgCl2) containing 0.2% Triton X-100 at 21 °C for 1 min to remove non-chromatin-bound proteins. Following the treatment, cells were quickly washed with 1× PBS and fixed with 4% PFA for 10 min at 21 °C. After staining the nuclei with DAPI and a brief wash with PBS, cells were imaged. For computational image enhancement, epifluorescence images were enhanced using DeconvolutionLab2 deconvolution software with a synthetic point spread function generated from our 40× air objective specifications. Following deconvolution, a 50-pixel rolling ball background subtraction was applied to correct uneven illumination. Enhanced images were processed and analysed using Fiji software to improve visualization of nucleosome recruitment dynamics.
STORM imagingNDF−FACT condensates containing mCherry-labelled proteins were assembled using equimolar concentrations (0.4 μM each) in condensate formation buffer and combined with 0.1 μM Pol II elongation complexes incorporating 6-FAM-labelled RNA primers, followed by NTP addition to initiate transcription. The presence of condensates was confirmed by brightfield microscopy, and mCherry-positive condensates were identified by epifluorescence microscopy to establish regions of interest. Super-resolution imaging was performed using a custom STORM system based on an Olympus IX83 frame equipped with a spinning disk confocal unit (DSU) and 40× UPlanSApo objective (NA 1.3). The spinning disk pinhole was employed to block out-of-focus fluorescence. Single-molecule fluorescence from 6-FAM-labelled RNA was acquired at 50 Hz using the Andor Zyla 4.2 sCMOS camera as 512 × 512 pixel images at 50 Hz with a 10−20 ms exposure time for each frame. Approximately 200 sequential frames per field were acquired before 6-FAM photobleaching occurred. Single-molecule localization and super-resolution reconstruction from the raw image sequences were performed using the ThunderSTORM plugin in Fiji, and XY drift correction was applied using cross-correlation image analysis. Condensate boundaries were identified, and centroids from the RNA signal were determined. Spatial distances were quantified by measuring centre-to-centre distances between condensates and RNA. Measured distances were compared to assess localization patterns.
Puncta callingThe number of the puncta in cells was counted using the ‘3D Objects Counter’ plugin in FIJI. All images were acquired under identical confocal settings (for example, laser power and exposure time) to maintain consistency, and nuclei of similar size were selected and cropped from raw images. To address cell-to-cell variation, we normalized the total fluorescence of each nucleus to a common reference, an approach supported by western blot data demonstrating stable protein levels across samples. After normalization, each image was converted to 16 bit and subjected to a uniform histogram-based threshold, highlighting the brightest signals (defined as puncta) without artificially creating signals (confirmed by DAPI-only controls). This analysis revealed a treatment-specific leftward shift in the upper tail of the intensity distribution, indicating reduced bright puncta intensity rather than a global decrease in fluorescence. In addition, puncta counts were normalized to nuclear area (for example, puncta per μm2) to correct for differences in cell size or focal plane. By combining consistent acquisition parameters, total fluorescence normalization, threshold verification and area-based adjustments, we ensured that our quantification pipeline captures both bright and moderate signals while minimizing technical artefacts and providing a reliable measure of condensate formation. The ‘Min number of voxels’ parameter was set to at least 10. For the percentage of puncta intensity calculation, the total intensity of puncta in each cell was calculated using ‘3D Objects Counter’. The total intensity of the fluorescence in each cell was measured by Fiji60. The percentage of the intensity of the puncta was calculated as the total intensity of the puncta divided by the total intensity of the fluorescence in the corresponding cell. Colocalization in Puncata was quantified using the Coloc 2 plugin in Fiji/ImageJ to determine the Pearson correlation coefficient.
Mechanical unwrapping assay of a single nucleosomeThe mechanical unwrapping assay of a single nucleosome was conducted following the method described before34, utilizing a custom-built dual-trap optical tweezers instrument61. Briefly, individual nucleosomes were attached to two 1 μm polystyrene beads via DNA handles of 570 bp and 700 bp. Nucleosomes were ligated to the DNA handles using E. coli DNA ligase (NEB) at 16 °C for 2 h in the presence of 0.02% NP-40. A subsequent ligation was then carried out to attach the handle−nucleosome−handle complex to oligo beads. The latter beads were prepared by conjugating carboxyl-functionalized polystyrene beads (Bangs Labs) to double-stranded oligonucleotides (IDT) with a 5′ NH-ester end and a 4 nt sticky end for handle ligation. The 700 bp DNA handle was biotinylated at one end to allow for attachment to a streptavidin-coated bead, enabling precise control and manipulation within the optical tweezers. Before the assay, the tweezing chamber and microfluidic channels were passivated twice, first with 1 mg ml−1 BSA and then with 0.25% Pluronic F-127, both diluted in 20 mM Tris (pH 7.5) and 50 mM KCl. The unwrapping assay was conducted at room temperature in the pulling buffer (20 mM Tris pH 7.5, 50 mM KCl, 100 mM NaCl, 5 mM MgCl2, 10 mM NaN3, 0.1 mg ml−1 BSA and 1.0 mM DTT). The NDF and FACT proteins were introduced into the main channel at a final concentration of 50 nM. In addition, nucleosome samples were pre-incubated with 50 nM FACT or 50 nM NDF protein at room temperature for 10 min, followed by a tweezing period of 1 h. To prevent nucleosome disassembly in solution, 0.02% NP-40 was added in the diluted nucleosome sample. Mechanical unwrapping and rewrapping of nucleosomes were carried out at a constant pulling rate of 20 nm s−1. The force−extension trajectories were continuously monitored during the experiment, allowing the detections of the low-force and high-force transitions during nucleosome unwrapping and the assignment of the subnucleosomal particles, according to their different force−extension features34. For repetitive pulling and relaxing cycles, subsequent pulling was initiated only after the nucleosome, hexasome or tetrasome had fully rewrapped, as indicated by the trapping force returning to approximately 0 pN. The trap stiffness during the experiment ranged between 0.28 and 0.4 pN nm−1. Raw data were collected at a sampling rate of 2.5 kHz, and subsequent data processing and analysis were conducted using a custom-written MATLAB (v25.1) code following the methodology outlined by Diaz-Celis et al.34.
Optical tweezers assay of Pol II transcription through the nucleosomeThe assembly of Pol II stalled complex was performed as described before33. Briefly, the bubble initiation method followed by uridine triphosphate (UTP) starvation was applied to prepare the stalled elongation complex using a biotinylated yeast Pol II. The stalled complex was further ligated to 2 kb upstream DNA preligated to 1 µm polystyrene oligo beads using E. coli DNA ligase (NEB). Concurrently with the upstream ligation, the stalled complex was ligated downstream to the molecular ruler made up of eight repeats of a sequence containing a well-defined pause site for Pol II (845 bp) followed by the human nucleosome loaded on the 601 nucleosome positioning sequence (NPS). The resulting Pol II−nucleosome beads were diluted with 1 ml of transcription buffer (TB50: 20 mM Tris pH 8.0, 50 mM KCl, 100 mM NaCl, 5 mM MgCl2, 1 mM DTT, 10 mM NaN3 and 0.1 mg ml−1 BSA) to a final bead density of 0.00003%. On the other hand, the 1.5 kb biotin-DNA handles were ligated to 1 µm polystyrene oligo beads and pre-incubated with 0.5 µM streptavidin for 10 min at room temperature and diluted with 1 ml of TB50 buffer to a final bead density of 0.00008%. Prior adding the beads, the tweezing chamber was passivated with 0.5% Pluronic F-127 (Invitrogen) and 1 mg ml−1 BSA (NEB) and washed with TB50 buffer. The optical tweezers experiments were performed in a custom-made dual-trap optical tweezers instrument33. The 1.5 kb biotin−DNA handle beads and Pol II−nucleosome beads were captured in each optical trap. A single tether was formed by bringing both beads into close proximity, and force feedback was applied to maintain a constant force of 10 pN. Under these conditions, transcription was restarted by flowing 0.5 mM of each NTP (Fisher Scientific) into the chamber, either in the absence or the presence of 10 nM FACT with or without 50 nM NDF. Data acquisition was recorded at 800 Hz and terminated once the polymerase reached the end of the template or arrested for more than 600 s without dynamics. The alignment of the transcriptional traces, data analysis on residence time of Pol II along the nucleosome and preparation of the transcriptional maps were conducted following the methodology described before using a custom-written MATLAB code33.
Optical tweezers with confocal scanning assay of Pol II transcription through the nucleosomeSimultaneous force and fluorescence measurements were performed on a C-trap (Lumicks). The five-channel laminar flow cell was passivated with 0.5% Pluronic F-127 and 1 mg ml−1 BSA, and subsequently washed with TB50 buffer. The Pol II stalled elongation complex was prepared as described above and ligated upstream to 3.5 kb (Fig. 3e) or 5.5 kb (Fig. 3f) DNA handles that had been preligated to 1 µm oligo beads, and downstream to the molecular ruler (845 bp; Fig. 3e) or a longer DNA sequence (3.5 kb; Fig. 3f), followed by the human nucleosome. The resulting Pol II−nucleosome beads were diluted with 1 ml of TB50 and flowed into channel 4 (Extended Data Fig. 3b). On the other side, the 3.5 kb biotin-2xCy5-DNA handles were prepared via PCR using lambda DNA as the template and biotin-2xCy5-labelled and BsaI-containing oligonucleotides (IDT) as primers. The PCR products were subjected to BsaI digestion, gel purification and ligation to 1 µm polystyrene oligo beads. The 3.5 kb biotin-2xCy5-handle beads were pre-incubated with 0.5 µM streptavidin, diluted with 1 ml of TB50 buffer and added into channel 1. The NTP was diluted in TB50 buffer to a final concentration of 0.5 mM in the presence of transcriptional regulators alone (10 nM FACT−mCherry or 10 nM NDF−GFP) or in combination, and then flowed into channel 4. Channels 2 and 3 were filled with TB50 buffer (Extended Data Fig. 3b). After catching the beads without flow (that is, biotin−handle bead in channel 1 on trap 2 and Pol II−nucleosome bead in channel 4 on trap 1), the trapped beads were moved to channel 2 for force calibration. Experiments were done at trap stiffness of 0.15 pN nm−1. A single tether was formed and verified by measuring a force-extension curve, with the force then clamped to 10 pN. Subsequently, confocal scanning was started, and the tether and beads were moved to the NTP/protein channel (channel 5) to resume transcription. Continuous two-dimensional confocal scans were conducted to obtain a complete image of the tether and beads. The images were acquired using 488, 532 and 639 nm lasers (GFP, mCherry and Cy5 excitation, respectively) at a laser power of 5%. Fluorescence emission was recorded using blue (512/25 nm), green (582/75 nm) and red (680/42 nm) filters. All experiments were performed at room temperature. Raw data exported from Lumicks Bluelake as .h5 files were converted to .mat files to be analysed with custom-written MATLAB code, as described before33. The latter was used to align the transcription traces, plot the transcribed distance in bp and define the position of Pol II along the template. The kymographs were generated from confocal 2D scans by using Fiji. Additional adjustments of the confocal 2D scans were performed in Fiji. The percentage of bleed-through of GFP from blue to green was determined by measuring the photon counts intensity on both blue (Ib-GFP) and green (Ig-GFP) channels obtained when NDF−GFP was added in the absence of FACT−mCherry. For this, a custom-written Jupyter Notebook in Python 3.9 was used. Subsequently, the correction factor (a) was calculated by dividing Ig-GFP/Ib-GFP, and used to correct mCherry signal obtained when both factors were added to the transcription assay, as follow: ImCherry corrected = Ig − (Ib × a).
ChIP−seqChIP−seq cell crosslinking was performed as described previously10. Formaldehyde crosslinked cells were then treated for 5 min on ice with cell lysis buffer (5 mM HEPES, K+ pH 8.0, 85 mM KCl, 0.5% (v/v) Nonidet P-40 and Protease Inhibitor Cocktail (Roche)). After treatment, cell pellets were resuspended in a Nuclear Lysis Buffer (50 mM Tris−HCl pH 8.0, 10 mM EDTA, 0.2% (w/v) SDS and Protease Inhibitor Cocktail (Roche)) and sonicated with a Covaris S220 sonicator. Chromatin concentrations were estimated using a Nanodrop spectrophotometer (Thermo Fisher) and diluted to a final concentration of 0.5 mg ml−1 with ChIP dilution buffer (16.7 mM Tris−HCl pH 8.0, 167 mM NaCl, 1.2 mM EDTA, 0.01% (w/v) SDS, 1.1% (v/v) Triton X-100 and Protease Inhibitor Cocktail (Roche)). Then, 80% glycerol was added to the chromatin sample to make it 0.5 mg ml−1 with 10% glycerol. For immunoprecipitation, 0.15 mg chromatin was added to 20 μl of Dynabeads Protein A (Thermo Fisher) pre-bound with specific antibodies (1 μl hNDF antiserum for NDF ChIP, 8 μl hSpt16 antibody for hSpt16 ChIP, 4 μl RPB II antibody for total Pol II ChIP and 2 µg LEGDF antibody for LEDGF ChIP). For ChIP−seq spike-in chromatin normalization, 1 µl spike-in antibody and 2.5 µl spike-in chromatin (Active Motif) were added to the sample. After incubation at 4 °C for 4 h on a nutator, beads were captured with a magnetic stand and washed as described10. Chromatin bound on the beads was eluted twice with 50 μl of TE (10 mM Tris−HCl pH 8 and 1 mM EDTA) containing 1% (w/v) SDS for 20 min at 20 °C. ChIP−seq libraries were prepared with the NEBNext Ultra II DNA Library Prep kit for Illumina (NEB) according to the kit instructions. Final libraries were quantified by a Qubit 4 fluorometer and sequenced with an Illumina Novaseq X sequencer (Admera). The sequencing data were aligned to the hg19 reference genome using Bowtie2 (v2.5.3)62. Spike-in reads were mapped to the dm3 genome build. Normalized bigwig files and metagene analysis were prepared by Deeptools (v3.5.4)63. Spike-in normalizations were performed as suggested by the manufacturer. GC content was analysed for each gene from the TSS to TTS across different gene clusters. Nucleosome-depleted regions (NDRs) were identified from MNase-seq data using DANPOS2 (v2.2.2)64. Gaps between well-positioned nucleosomes are defined as NDRs. NDR length was calculated as the distance between the upstream and downstream boundaries of the depleted region. Only NDRs with a length less than 500 bp and located in the promoter region (TSS ± 1 kb) were retained for analysis. NDR length distributions were compared across gene clusters and visualized with ggplot. Pausing indices were calculated as the ratio of Pol II ChIP−seq read density within the promoter region (±300 nt around the TSS) to the read density in the gene body (from 500 nt downstream of the TSS to the TES) across gene clusters longer than 1,000 bp.
Cut&RunCut&Run libraries were prepared using the CUT&RUN assay kit (Cell Signaling Technology). A total of 100,000 live cells were used per sample, and spike-in DNA was incorporated according to the manufacturer’s protocol. For NDF Cut&Run, 0.5 μl hNDF antiserum was used for each reaction. The libraries were sequenced and analysed following the procedures outlined for ChIP−seq. Spike-in reads were mapped to the sacCer3 genome build.
PRO-seqPRO-seq with two biotin-NTPs was performed as described65. Cells were permeabilized following the protocol, and aliquoted with 1 million cells in 52 μl freeze buffer. To make the fragments not too small, the base hydrolysis time reduce from 10 min to 8 min. The libraries were sequenced and analysed following the procedures outlined for ChIP−seq.
RNA-seqTotal RNA was purified from cultured cells by TRIzol Reagent (Thermo Fisher) following the manufacturers’ instructions. RNA was treated with DNaseI (NEB) for 10 min at 22 °C to remove residual genomic DNA. Then, 2 µl of 100-times diluted ERCC RNA spike-in Mix 1 (Thermo Fisher) was added to 1 µg of purified total RNA. mRNA was isolated with the NEBNext Poly(A) mRNA Magnetic Isolation Module (NEB). mRNA libraries were prepared using the NEBNext Ultra II RNA library prep kit for Illumina (NEB). The libraries were sequenced with an Illumina Novaseq X sequencer (Aderma). The raw sequencing data were trimmed and aligned to the hg19 reference genome and the ERCC spike-in RNA annotation using Hisat2 (v2.2.1)66. Total reads from each gene were calculated using featureCounts (v2.1.1)67. The standard curve for normalization was calculated following a detailed published protocol68. Statistics analysis was performed using JMP Pro 18 (JMP Statistical Discovery). Differential gene expression analysis was performed using DESeq2 (v2.11.40.8), and the results were visualized using the EnhancedVolcano (v1.20.0)73 package69.
TT-seqTT-seq was performed as previously described12,70 with slight modifications. For each biological replicate, one 15-cm dish of human iPS cells at approximately 80% confluency was used. For TT-seq, cells were labelled with 1 mM 4-thiouridine (4sU; Sigma) for 10 min. For DRB/TT-seq, cells were pretreated with 0.1 mM DRB (TCI) for 3 h. For the DRB release 0-min condition, 4sU was added to the culture medium 10 min before the end of the 3-h DRB treatment, without removing DRB; for the DRB release 10-min condition, cells were rapidly washed twice with warm PBS to remove DRB, then incubated in 4sU-containing medium for 10 min; for the DRB release 20-min condition, after DRB removal (via two washes with warm PBS), cells were first incubated in DRB-free medium for 10 min, followed by incubation in 4sU-containing medium for an additional 10 min. After labelling, cells were quickly washed with ice-cold 1× PBS, and total RNA was extracted using standard TRIzol RNA extraction. A total of 100 μg of RNA was mixed with 0.5 μg of S. pombe 4TU-labelled RNA as a spike-in control. This mixture was then subjected to RNA fragmentation, biotinylation and streptavidin pull-down as previously described
Comments (0)