
Remember me


The initial dataset consisted of 4964 individuals from the SIH and SIOH studies, with 659,184 genotyped variants. After quality control, 4879 individuals and 610,509 variants remained for imputation. The genotype imputation yielded 15,408,335 imputed variants, of which 6,467,992 and 3,075,492 passed quality control and INFO score thresholds of ≥0.3 and ≥0.8, respectively.
Among the 4879 individuals, 300 (6.15%) had T2D and 54 (1.11%) had CVD. Baseline characteristics are summarized in Table 1. The majority of individuals were female, with male overrepresented among T2D and CVD cases (Table 1). Individuals with T2D or CVD were significantly older (p-value = 2.8 × 10-39), had higher BMI (p-value = 2.7 × 10⁻³⁰) and WC (p-value = 1.1 × 10⁻³³), and elevated SBP and DBP (p-value = 6.0 × 10⁻²² and 4.0 × 10⁻⁹) compared to control (Table 1). TG and HDL-C differed significantly among groups (p-value = 4.2 × 10⁻¹⁴ and 2.3 × 10⁻¹¹), while TC and LDL-C did not (p-value = 0.616 and 0.320) (Table 1). Both FBS and HbA1c were significantly higher in the disease groups (p-value = 1.4 × 10-47 and 2.9 × 10-61), as were MAU/Cr ratios (p-value = 8.8 × 10⁻²⁴) (Table 1). These findings suggest a greater metabolic burden and a higher risk of renal dysfunction in individuals with T2D and CVD compared to controls.
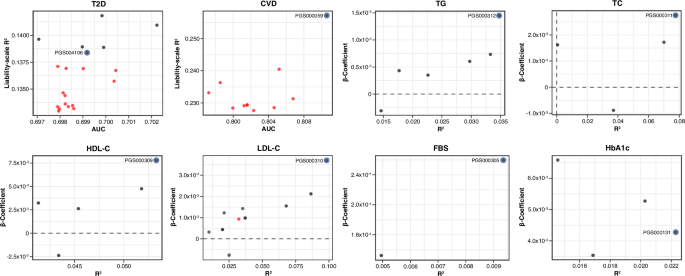
Table 1 Baseline characteristics of the study cohortPerformance of PRS for cardiometabolic traitsThe predictive performance of 64 PRS across eight cardiometabolic traits was evaluated using regression models. For binary traits (T2D and CVD), model performance was measured using OR, AUC and liability-scale R2. For continuous traits (TG, TC, HDL-C, LDL-C, FBS, and HbA1c), R2 and beta coefficients were used. Of all PRSs, 60.9% were significantly associated with their respective phenotypes at an FDR < 0.05. The predictive performance varied by traits: six of 20 T2D PRSs (30%) were significant, while the majority of glycemic and lipid PRSs passed the FDR threshold (Fig. 1 and Supplementary Table S4-S5). Only one PRS for CVD (PGS000059) met the significance threshold after FDR correction (Fig. 1 and Supplementary Table S4).
Fig. 1: Overall performance of all evaluated PRSs for eight cardiometabolic traits.
Performance metrics of all 64 PRSs evaluated across eight cardiometabolic traits: T2D, CVD, TG, TC, HDL-C, LDL-C, FBS, and HbA1c. PRS performance for binary traits is shown using AUC and liability- scale R2, while continuous traits are shown using R2 and beta coefficients. Each dot represents an individual PRS, with black dots indicating statistically significant associations (FDR < 0.05) and red dot representing non-significant associations. The best-performing PRS for each trait is highlighted with a blue outline and labeled by its PGS catalog identifier. Figures generated using R (ggplot2) and finalized in Adobe Illustrator.
The best-performing PRSs were selected based on maximum AUC (binary) or R2 (continuous) and statistical significance. PGS000312 was identified as the best-performing PRS for TG (R2 = 0.0347; FDR = 2.6 × 10-312), PGS000311 for TC (R2 = 0.0776; FDR = 7.8 × 10-60), PGS000309 for HDL-C (R2 = 0.0533; FDR = 5.1 × 10-85), and PGS000310 for LDL-C (R2 = 0.0982; FDR = 8.7 × 10-85) (Table 2). For glycemic traits, PGS000305 was best for FBS (R2 = 0.0096; FDR = 5.0 × 10-324), and PGS000131 for HbA1c (R2 = 0.0222; FDR = 2.3 × 10-312), each showing the strongest association with trait levels in the cohort (Table 2). For T2D, PGS000854 had the highest AUC (AUC = 0.702[0.671–0.733]; FDR = 0.0327) (Supplementary Table S4). However, given the similar predictive performance among T2D PRSs, all significant PRSs for T2D were evaluated in further subgroup and follow-up analyses. These led to PGS004106 as the most robust PRS for T2D (AUC = 0.699[0.667–0.731]; FDR = 0.0470) (Table 2), as described in later sections. For CVD, PGS000059 was the best-performing PRS (AUC = 0.811[0.758–0.863]; FDR = 0.0356), and demonstrated an inverse association, with higher PRS values associated with reduced disease risk (OR = 0.358[0.175–0.726]) (Table 2).
Table 2 Summary of best performing PRS for each traitDensity and scatter plots confirmed trait-specific associations. Density plots for binary traits (T2D and CVD) revealed significant separation between cases and controls, while scatter plots for continuous traits (TG, TC, HDL-C, LDL-C, FBS and HbA1c) showed linear associations between PRS values and measured phenotypes (Fig. 2). All best-performing PRSs were subsequently included in subgroup and longitudinal analyses to evaluate their consistency across population strata and over time.
Fig. 2: Distribution and trait association of best-performing PRSs.
Distribution and phenotype correlation of the best-performing PRSs for T2D (A), CVD (B), TG (C), TC (D), HDL-C (E), LDL-C (F), FBS (G), and HbA1c (H). Panels A and B show density plots of PRS distribution in cases (red) and controls (white) for T2D and CVD. Median and IQR are provided in the top right of each plot. T2D cases exhibited significantly higher PRS values, while CVD cases showed significantly lower PRS values compared to controls. Panels C-H display scatter plots of continuous traits values against corresponding PRS values. Each plot includes a fitted regression line (blue) with 95% confidence interval (gray). Coefficient of determination (R2) and associated p-values for both unadjusted and adjusted models (adjusted for age, sex, PC1-10) are presented in the top right corner of each panel. All traits demonstrated significant positive correlation between traits and their respective PRSs. Figures generated using R (ggplot2) and finalized in Adobe Illustrator.
To further investigate sources of variability in PRS performance, we compared two metrics of SNP retention: simple SNP retention, defined as the proportion of SNPs retained after imputation quality filtering, and weighted SNP retention, which accounts for the cumulative absolute effect sizes of retained SNPs. Correlation analyses across all traits revealed modest and inconsistent associations between retention metrics and predictive performance (Supplementary Table S14). For LDL-C, weighted SNP retention exhibited a stronger correlation (R2 = 0.279; p-value = 0.078), suggesting that effect size weighting may better capture the importance of SNP composition for certain traits. However, for most traits, both retention metrics showed weak and non-significant correlations, likely reflecting score heterogeneity and limited sample size.
We compared PRS performance across traits, stratified further by the ancestry of the discovery population (European, East Asian, multi-ancestry, or other). Overall, PRSs developed from multi-ancestry cohorts tended to perform comparably or better than those derived solely from European or East Asian population across most traits (Supplementary Table S15). Notably, no PRS derived from East Asian cohorts ranked as the best-performing PRS for any trait in our dataset (Supplementary Fig. S5). Nonetheless, the number of East Asian PRSs was limited, and no statistically significant differences in predictive performance were observed across ancestry groups (Supplementary Table S15).
PRS risk stratification and subgroup analysis for cardiometabolic traitsTo evaluate the predictive performance of the PRSs, we stratified binary traits by PRS quartiles and continuous traits by PRS deciles. Given the overall performance described earlier, subgroup analyses were performed on all six significant PRSs for T2D, as well as the best-performing PRSs other traits, including CVD, TC, TG, HDL-C, LDL-C, FBS, and HbA1c.
For PRS004106, individuals in higher PRS quartiles exhibited a progressive increase in T2D risk (Fig. 3A). Individuals in the 4th quartile had significantly higher odds of developing T2D, compared to the 1st quartile (OR = 1.75[1.25–2.46]; p-value = 0.0013) (Fig. 3A and Supplementary Table S6). Although individuals in the 2nd and 3rd quartiles also had increased odds of T2D, these associations did not reach statistical significance (OR = 1.16[0.81–1.67]; p-value = 0.4267 and OR = 1.25[0.87–1.79]; p-value = 0.2304, respectively) (Fig. 3A and Supplementary Table S6). In addition, the proportion of T2D cases increased across quartiles (5.0, 5.5, 5.9, and 8.2% for 1st, 2nd, 3rd, and 4th quartiles, respectively; Cochran-Armitage p-value = 0.0011), supporting the association between higher PRS and increased T2D risk (Fig. 3A and Supplementary Table S6). Apart from PRS004106, four other PRSs for T2D (PRS000031, PRS000032l, PRS000854, and PRS004225) showed similar risk stratification patterns (Supplementary Table S6). However, further follow-up analyses were conducted to identify the most robust PRS for T2D, which will be discussed in the subsequent section.
Fig. 3: PRS-based risk stratification across polygenic score subgroups.
Risk stratification across polygenic score quartiles (binary traits) and deciles (continuous traits) for the best-performing PRS. A The left panel shows odds ratios and 95% confidence interval for T2D risk cross PRS quartiles (PGS004106), adjusted for age, sex and PC1-10. The right panel displays the proportion of T2D cases in each PRS quartile. The highest PRS quartile showed significantly increased odds of being T2D and had the highest proportion of T2D cases, while the lower quartiles demonstrated lower odds and proportions. B–E Boxplots illustrate distribution of lipid levels across their corresponding PRS deciles (TG with PGS000312, TC with PGS000311, HDL-C with PGS000309 and LDL-C with PGS000310). A consistent positive trend in lipid levels was observed with increasing PRS deciles, demonstrating the utility of PRS in phenotypic stratification. Figures generated using R (ggplot2) and finalized in Adobe Illustrator.
For lipid traits, PRS deciles were strongly associated with corresponding lipid levels, demonstrating a linear trend across increasing deciles. Specifically, higher PRS deciles were linked to elevated TG levels for PGS000312 (Fig. 3B), increased TC levels for PGS000311 (Fig. 3C), higher HDL-C levels for PGS000309 (Fig. 3D), and higher LDL-C levels for PGS000310 (Fig. 3E). These results suggest that PRS deciles effectively stratify lipid levels, supporting their potential use for risk stratification.
In contrast, PRSs for FBS and HbA1c exhibited weak and inconsistent trends, limiting their predictive ability in this cohort (Supplementary Fig. S2 and Supplementary Table S6). However, for CVD, PGS000059 demonstrated a statistically significant and directional association. Individuals in higher PRS quartiles had progressively lower odds for developing CVD, with the 4th quartile exhibiting the strongest protective effect, compared to the 1st quartile (OR = 0.40[0.16–0.90]; p-value = 0.0326). Individuals in the 2nd and 3rd quartiles also showed a protective trend, although the associations were not statistically significant (OR = 0.89[0.44–1.77]; p-value = 0.7390 and OR = 0.60[0.27–1.27]; p-value = 0.1893, respectively) (Supplementary Fig. S2 and Supplementary Table S6).
Follow-up analyses of PRS predictive power over timeTo further validate the predictive utility of PRSs, we conducted Kaplan-Meier survival analysis for binary traits and LMM assessments for continuous traits. Kaplan-Meier and Cox models showed that individuals in the 2nd, 3rd, and 4th quartiles had significantly higher risks of developing T2D over time compared to those in the 1st quartile (hazard ratios (HRs) for 1st, 2nd, 3rd, and 4th quartile: 2.27[1.38–3.71]; p-value = 0.0015, 2.59[1.63–4.26]]; p-value = 7.9 × 10⁻⁵, 1.94[1.16–3.19]; p-value = 0.0112) (Fig. 4A and Supplementary Table S8). Although the HRs did not follow a strictly increasing trend across quartiles—with the 4th quartile showing a slightly lower HR than the 3rd and 2nd—each higher quartile was still associated with a significantly elevated risk compared with the 1st quartile. This suggests that individuals with higher PRS values are consistently at greater risk of developing T2D, even if the risk increment is not linear across all quartiles. These findings support the utility of PRS004106 as the strongest T2D predictor in this cohort. In contrast, the other four tested PRSs for T2D demonstrated inconsistent or weaker associations with T2D risk (Supplementary Table S8).
Fig. 4: Survival and longitudinal analyses of cardiometabolic traits by polygenic score subgroup.
A Kaplan-Meier survival curves of event-free probability (left) and adjusted hazard ratios with 95% confidence interval (right) from Cox proportional hazards models for incident T2D by PGS004106 quartiles. The analyses were adjusted for age, sex, and PC1-10. Individuals in higher PRS quartiles (Q2-Q4) exhibited significantly increased risk of developing T2D over time, compared to the lowest quartile. B–E Longitudinal prediction of lipid levels using LMM assessments across PRS quintiles. Predicted mean values and 95% confidence are shown for B TG (PGS000312), C TC (PGS000311), D HDL-C (PGS000309) and E LDL-C (PGS000310) over a six-year period. Higher PRS quintiles are consistently associated with elevated predicted lipid values, supporting the temporal stability and predictive utility of these scores. Figures generated using R (ggplot2) and finalized in Adobe Illustrator.
For continuous traits, LMM confirmed the predictive utility of lipid trait PRSs over six years (Fig. 4B–E and Supplementary Table S9). Higher PRS consistently predicted higher lipid levels over time. Specifically, PGS000312 for TG showed a clear gradient of increasing predicted TG levels from the lowest to highest PRS quintiles (Fig. 4B). Similarly, PGS000311 for TC (Fig. 4C), PGS000309 for HDL-C (Fig. 4D), and PGS000310 for LDL-C (Fig. 4E) each showed well-separated trajectory across quintiles, confirming robust stratification and temporal stability of these PRSs in predicting lipid-related traits.
In contrast to T2D and lipid traits, follow-up analyses for CVD, FBS, and HbA1c revealed limited predictive utility (Supplementary Fig. S3 and Table S8-S9). CVD PRS (PGS000059) showed no longitudinal association in survival models (p-value = 0.298, 0.706, and 0.130; Supplementary Fig. S3 and Table S8). For glycemic traits, PGS000305 for FBS and PGS000131 for HbA1c displayed modest upward trends over time, but lacked stratification across PRS quintiles (Supplementary Fig. S3 and Table S9).
Cohort-specific evaluation of polygenic scores and genome-wide associationsTo assess trait relevance, we tested individual SNPs of each best-performing PRS. Several well-established lipid loci showed significant associations with their respective traits after FDR correction (Supplementary Table S11). These included the APOE locus (associated with all four lipid traits), ABCA1 locus (TC, HDL-C, and LDL-C), CETP locus (TC and HDL-C), and APOB locus (TC and LDL-C). These loci are consistent with known biology and support the PRS construction (Supplementary Table S11). In contrast, common glycemic and CVD variants, including rs7903146 (TCF7L2), rs9939609 (FTO), and rs7136259 (ATP2B1) did not reach FDR significance (Supplementary Table S11). Although PRS models for FBS, and HbA1c were not predictive in this cohort, some variants in CDKAL1, PLUT, CDKN2B-AS1;DMRTA1 were associated with both FBS and HbA1c, suggesting measurable effects on trait variation (Supplementary Table S11).
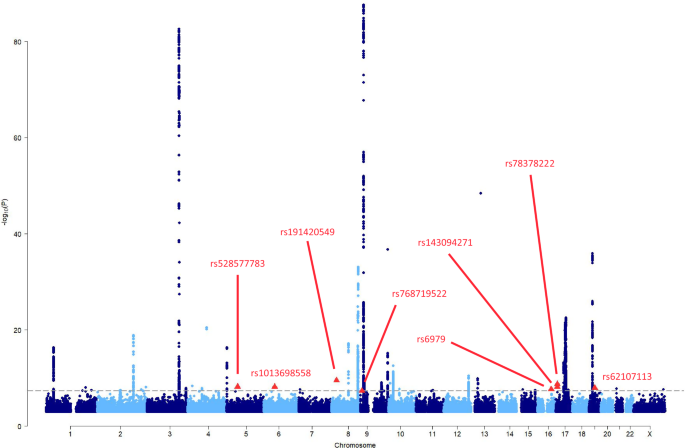
GWAS was conducted in 4607 unrelated individuals to further explore the genetic architecture of cardiometabolic traits in the cohort. GWAS revealed prominent signals at known loci for T2D (TMEM18 and LINC00971), CVD (ARHGAP22, MYO1B, LINC02056, and MOCS1), lipid traits (GCKR, APOA5-APOC3 loci for TG, and APOE, CETP, LDLR for LDL-C, HDL-C, and TC), and suggestive signals for FBS and HbA1c (TSPAN2, SPAG17, CASR, and FTO) (Supplementary Fig. S4 and Table S12). No novel significant loci were identified.
Comments (0)