
Remember me


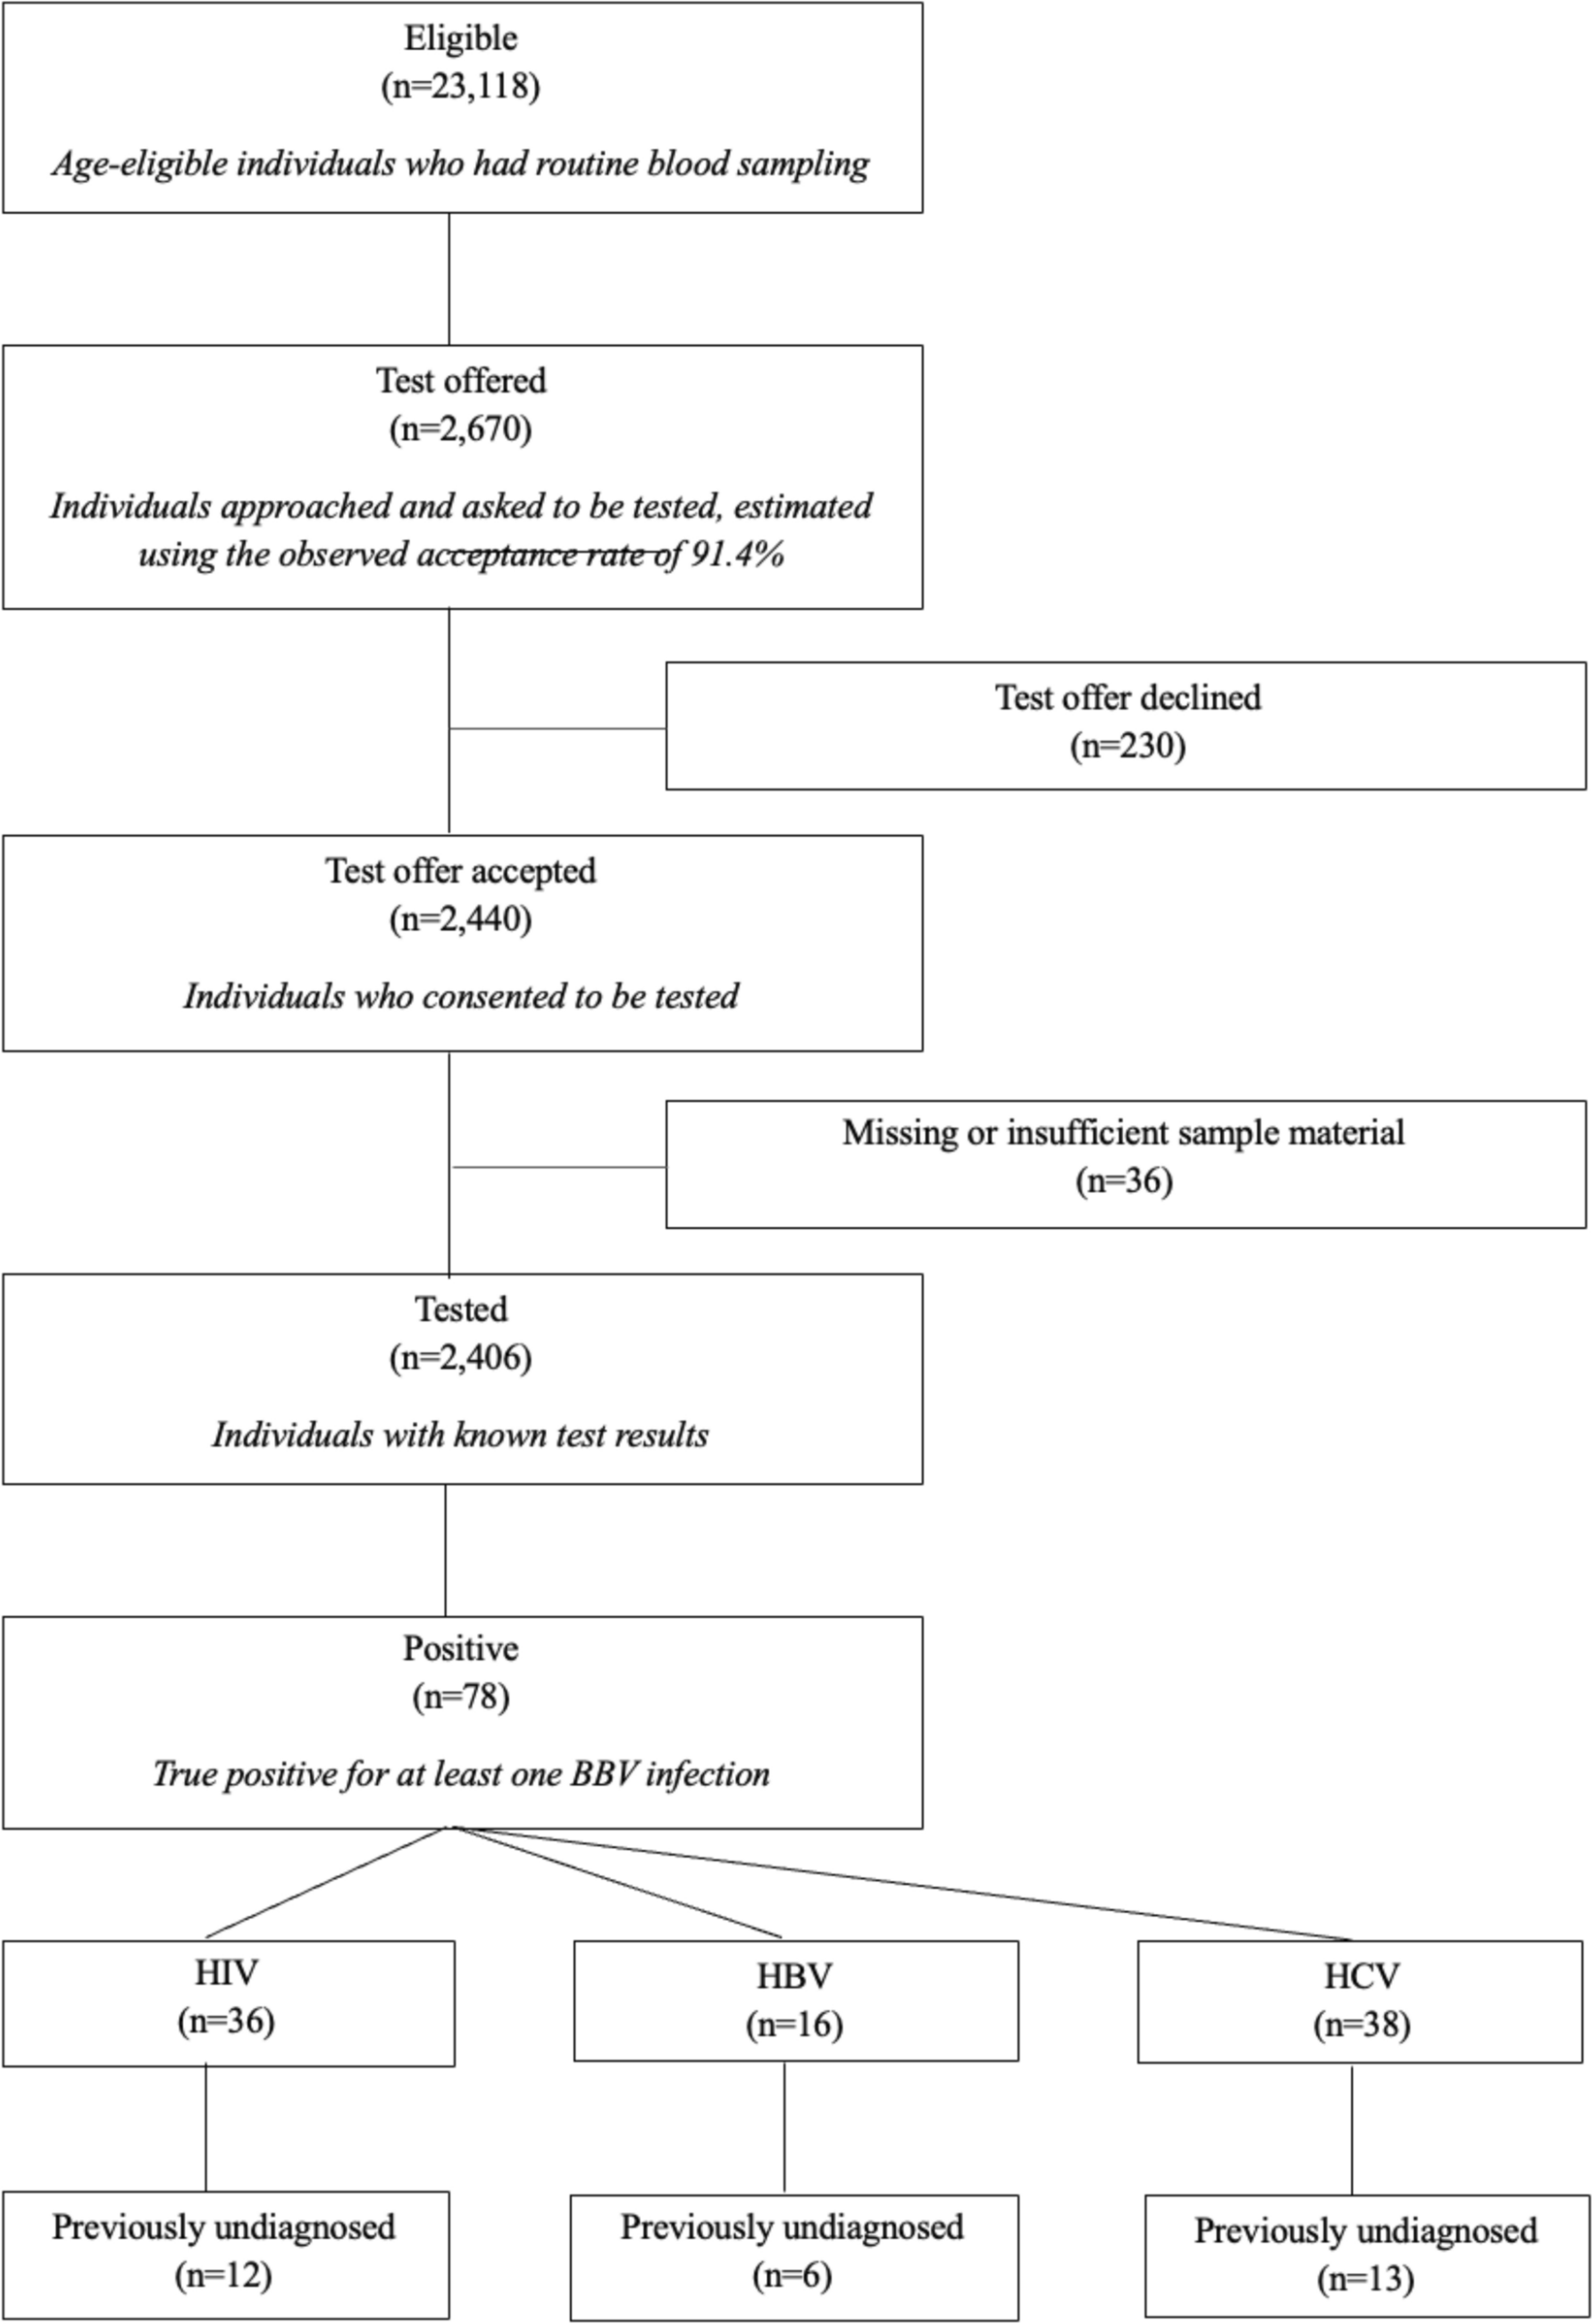
Out of the 5136 patients included in the RESINA cohort, 139 experienced VF, corresponding to an overall VF rate of 2.7%. The patient flow diagram is presented in Fig. 1, and baseline characteristics by VF status are summarized in Table 1.
Fig. 1
Patient flow through the RESINA cohort (2001–2024), from ART initiation to first virologic failure and final suppression status.Of 5136 ART‐treated participants, those with first virologic failure are shown by calendar period (2001–2007, 2008–2013, 2014–2024), then by disposition (retained in care, lost to follow-up, died) and by whether they achieved virologic suppression by end of follow-up. n number
Table 1 Baseline characteristics of patients in the RESINA cohort according to virologic outcome (without vs. with virologic failure)Patients with VF were slightly younger (median age 37 years, range 18–75 vs. 39 years, range 18–82), and a lower proportion were male compared with patients without VF (65.5% vs. 82.1%, p < 0.001). Acquisition routes differed markedly: in the VF group, heterosexual transmission (including high-prevalence regions) and IDU were more common (30.3% vs. 19.5% and 12.2% vs. 5.4%, respectively), whereas men who have sex with men (MSM) transmission predominated among patients without VF (54.4% vs. 23%, p < 0.0001).
Regarding region of origin, 57% of VF patients originated from Germany, compared with 66% without VF. Sub-Saharan Africa was more frequently represented in the VF group (17.3% vs. 5.2%, p < 0.0001). Patients with VF initiated ART at lower CD4 cell counts (median 85/µL vs. 273/µL; < 200 cells/µL in 43.2% vs. 18.9%) and higher HIV-1 RNA levels (≥ 100,000 copies/mL in 38.8% vs. 26.5%, p = 0.005). Late presentation was significantly more frequent among VF patients (43.2% vs. 18.9%, p < 0.0001).
In a sensitivity analysis examining very high baseline HIV-1 RNA levels (≥ 500,000 copies/mL), 11 of 139 patients with VF (7.9%) and 513 of 4997 patients without VF (10.3%) had viral loads above this threshold (p = 0.45).
HIV-1 subtype B remained the most common subtype in both groups but was less predominant among VF patients (54.7% vs. 58.6%), with higher proportions of CRF02_AG (15.1% vs. 5.4%) and subtype C (5.8% vs. 2.6%, p < 0.0001). VF occurred more often in earlier treatment eras, with 40.3% of VF patients starting ART before 2007, compared to 22.9% in the no-VF group (p < 0.0001). TDR was uncommon overall and was observed in 7.1% (357/4997) of individuals without virologic failure compared with 5.8% (8/139) of those who experienced virologic failure (p = 0.62).
Overall mortality was higher in the VF group (9.4% vs. 4%, p = 0.004). Although more than half of VF patients (79/139) were lost to follow-up at some point, the median follow-up time was 9 years (range 1–24), and 85% (118/139) were followed for at least 5 years.
At ART initiation, the most common regimens in the VF group combined two NRTIs, usually TDF/FTC, with either an NNRTI (most often nevirapine or efavirenz) or a boosted PI (most frequently lopinavir or darunavir) (Fig. 2). More than half of VF cases (77/139, 55.4%) occurred under the first ART regimen, and 34/139 (24.5%) occurred during the second. First VF/rebound occurred after a median of 608 days on ART (range 59–5186).
Fig. 2
ART Regimens at treatment Initiation and resistance mutation frequencies in patients with VF. A Distribution of first-line ART regimen classes among individuals who later experienced VF. Bars show the percentage of patients in each regimen class, with absolute numbers (n) displayed on the bars. B Absolute number of patients initiating therapy with the most frequently used individual antiretroviral drugs. C Prevalence of major resistance-associated mutations detected at the time of VF, grouped by drug class (NRTI, NNRTI, PI, INSTI). Bars represent the number of patients harboring each mutation, and colors correspond to drug classes
VF rates by treatment era were: group 1, 4.7% (56/1200); group 2, 2.6% (48/1882); and group 3, 1.7% (35/2054). Almost half (64/139) experienced a single VF event during follow-up, 21% (29/139) had two, and the remainder had three or more.
In a cohort-wide binary logistic regression model restricted to the first VF episode per patient, three covariates emerged as independent risk factors for VF: IDU (OR 1.74, 95% CI 1.00–3.00, p = 0.048), CD4 < 200 cells/µL at ART initiation (OR 2.32, 95% CI 1.56–3.45, p < 0.001), and ART initiation during 2001–2007 (OR 1.95, 95% CI 1.24–3.06, p = 0.004) (Table 2). This association between low CD4 count and VF remained consistent in sensitivity analyses using a higher CD4 threshold of 350 cells/µL (CD4 < 350: OR 1.88, 95% CI 1.29–2.72).
Table 2 Multivariable logistic regression of risk factors for virologic failureIn sensitivity analyses examining very high baseline HIV-1 RNA levels, very high baseline viremia (≥ 500,000 copies/mL) was not independently associated with VF (OR 0.64, 95% CI 0.27–1.54).
By contrast, acquisition through MSM contact was associated with a lower risk of VF (OR 0.32, 95% CI 0.20–0.50, p < 0.001). Other factors, including age, sex, baseline VL, and ART initiation during 2008–2013, were not significantly associated with VF. In supplementary models, neither HIV-1 subtype, TDR nor region of origin was independently associated with VF. Adjustment for subtype attenuated the effect of ART initiation during 2001–2007, indicating partial confounding by subtype distribution (Supplementary Tables 1a–c).
Adherence data were inconsistently recorded; among participants with VF, 83/139 (59.7%) had documented non-adherence (treatment pause and/or missed appointment). We did not evaluate adherence in adjusted models.
HIV resistance mutations and cross-resistance patterns in the VF groupTDR mutations in HIV were identified in eight patients with VF, while acquired resistance mutations emerged in 28 during follow-up. Of those with acquired mutations, 11 had single-class resistance and 17 (61%) showed cross-resistance to two or more drug classes (Supplementary Table 2).
The most frequently observed NRTI resistance mutation was M184V/I (17 M184V and six M184I) detected in 23 patients (two transmitted, 21 acquired), followed by K70R/E in five patients (one transmitted, four acquired). Among NNRTI mutations, Y181C/Y occurred in nine patients (one transmitted, eight acquired), K103N in eight patients (two transmitted, six acquired), and K101E/K in six patients (all acquired). PI resistance was uncommon (n = 6), with V82A in four patients (one transmitted, three acquired). INSTI resistance (all acquired, no baseline INSTI TDR) was identified in five patients: N155H (n = 2), Y143C/R/S (n = 1), E92Q (n = 1), and R263K + G118R (n = 1). The latter pattern reflects dolutegravir resistance and has been described previously [27].
Supplementary Table 2 highlights extensive cross-resistance in several patients (e.g., M184V + T215Y + K103N + V82A conferring NRTI, NNRTI, and PI resistance).
Fourteen patients with transmitted or acquired mutations that do not impair cabotegravir (CAB) or rilpivirine (RPV) susceptibility would still be eligible to receive injectables (CAB/RPV LA), which might be an option to improve future adherence.
Treatment outcomes post-failure in the VF groupOf 139 participants with any VF, 44 (31.7%) were unsuppressed at last follow-up (Fig. 1). After the first VF, 122 (87.8%) ever achieved resuppression, while 17 (12.2%) never resuppressed (HIV-1 RNA ≥ 50 copies/mL). Median time to resuppression was 147 days (range 13–2,015). The higher end-of-follow-up count reflects patients who later failed again or ended follow-up unsuppressed.
Of the total of 139 patients experiencing VF, 74 patients remained on the same drug class after VF (predominantly PI-based regimens, but also some NNRTI-, NRTI-only, and INSTI-based therapies), while 65 were switched to a different drug class. Common switches were PI → PI (n = 23), PI → INSTI (n = 14) and PI → other (n = 20); fewer moved NNRTI → PI (n = 6) or NNRTI → INSTI (n = 6), NRTI-only → PI (n = 5), and other → PI/INSTI (n = 6/2). Switches to INSTI-based regimens (PI → INSTI 3/3, NNRTI → INSTI 4/4, other → INSTI 7/7) and NRTI-only → PI (6/6) were the most consistently successful, whereas remaining on PI regimens (16/22, 73%) or switching NNRTI → PI (4/6, 67%) showed lower rates of re-suppression, and NRTI-only → NNRTI was least effective (1/2, 50%).
Patients who failed to resuppress had significantly higher VL at failure compared with those who did resuppress (mean log₁₀ VL 4.7 vs. 3.8, p = 0.004). In multivariable analysis, male sex was independently associated with faster re-suppression (HR 1.81, 95% CI 1.15–2.86, p = 0.011), a finding also reflected in Kaplan–Meier curves (log-rank p = 0.009; Fig. 3). Regimen switch at failure showed a non-significant trend toward faster resuppression (HR 0.72, 95% CI 0.49–1.05, p = 0.087), while higher VL at failure trended toward slower resuppression (HR 0.84 per log₁₀ increase, 95% CI 0.71–1.00, p = 0.056). Age, resistance-mutation status at the time of VF, and subtype B were not significantly associated with resuppression. Overall, these results indicate that, once switch strategy is considered, male sex and lower VL at failure are the strongest predictors of faster resuppression, whereas age, resistance-mutation status, and subtype B appear to have little influence (Table 3).
Fig. 3
Kaplan–Meier estimates of time to virologic resuppression, stratified by gender. Kaplan–Meier survival curves showing the probability of remaining unsuppressed (HIV-1 RNA ≥ 50 copies/mL) over time after first virologic failure, stratified by sex. The green line represents male participants (n = 92), and the purple line represents female participants (n = 47). Censoring (patients lost to follow-up or without resuppression by study end) is indicated by tick marks. The log-rank test comparing the two curves yielded p = 0.009
Table 3 Cox proportional‑hazards regression of predictors for time to virologic resuppression after first virologic failure
Comments (0)