
Remember me




The proposed framework aimed to automatically detect single-bolus swallow events in multi-swallow simultaneous HRIM and VFSS, through VFSS OF analysis and HRIM pressure distribution categorization.
Data collection protocolThe capture of simultaneous VFSS and HRIM was conducted by a trained speech language pathologists at the Netherlands Cancer Institute (NKI) (Amsterdam, the Netherlands). Fluoroscopy images were acquired at 25 frames-per-second using CombiDiagnost R90\(^\) (Philips®, Amsterdam, the Netherlands), with continuous session recording via Bandicam\(^\) (Bandicam Company®, Irvine, CA, USA) at 30 frames-per-second. The standard protocol of capturing fluoroscopic images only during active X-ray exposure was modified to allow continuous recording from the start of the examination. This adaptation addressed equipment limitations, particularly software constraints of the HRIM system, which can result in the loss of critical parts of the swallow event in the HNC population. Additionally, this adjustment allows a comprehensive retrospective analysis, including access to all verbal clinician comments. This recording is the main input of our methodology.
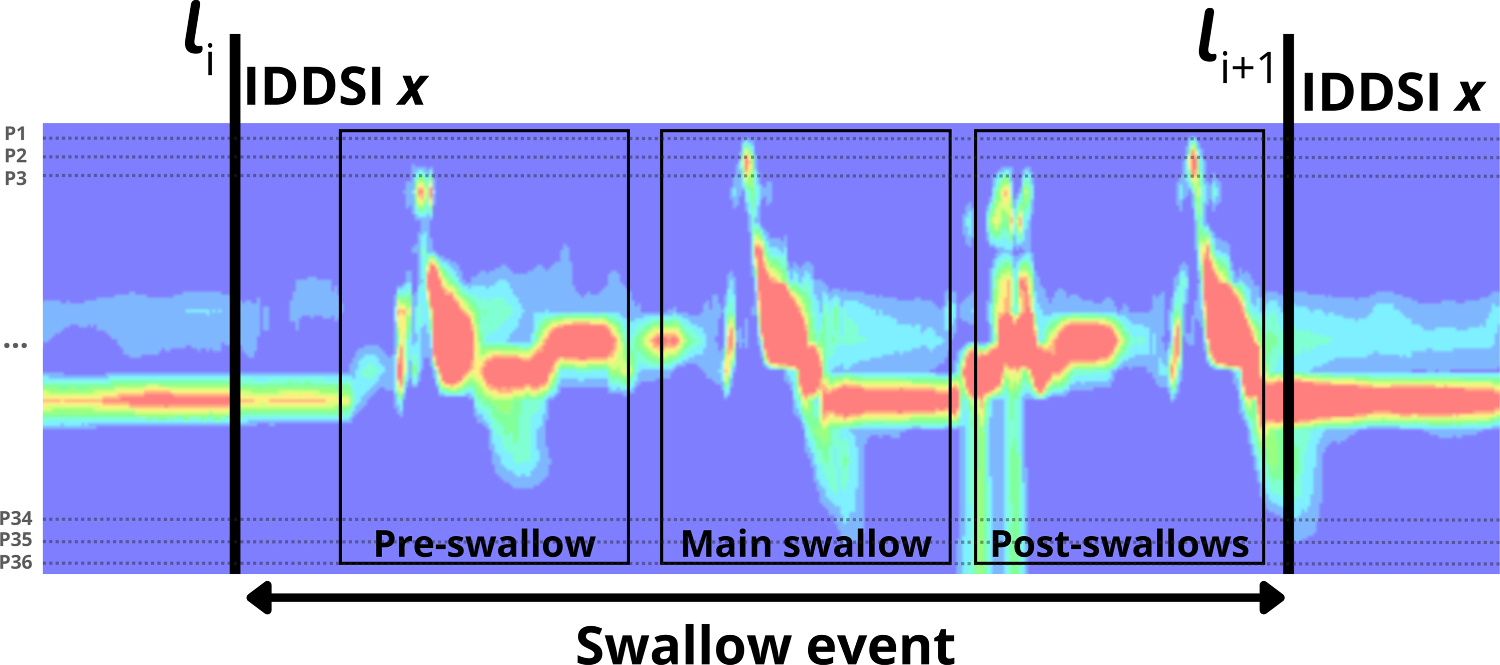
As in standard HRIM data collection protocols, single-bolus swallows were manually annotated by the responsible clinician during acquisition. At the NKI, both the onset and offset of each swallow event were marked directly on the HRIM stream, ensuring that the entire event was enclosed within these annotations (cf. Fig. 1). Similarly, each swallow event was guaranteed to be fully captured under X-ray. However, because HRIM landmark placement was independent of fluoroscopic swallows, the annotated HRIM segment and the corresponding VFSS video segment may differ in duration, despite capturing the same swallow event.
The solid-state manometer Solar GI\(^\) K103659-E-1180-D (Laborie®, Portsmouth, NH, USA) recorded pressure and impedance data at 20 Hz. The manometer was equipped with 36 pressure sensors and 16 impedance sensors. Following Omari et al. [12] the HRIM catheter was inserted nasally to a depth of approximately 40 cm, until it cleared the UES and all pressure sensors were inside the patient. The simultaneous VFSS-HRIM protocol, adapted from Palmer et al. [8] and Omari et al. [12], involved lateral-view video recordings of patients swallowing boluses of varying consistencies and volumes, following the International Dysphagia Diet Standardisation Initiative (IDDSI) guidelines [16].
The study included 12 male post-HNC patients (mean age \(66 \pm 11\) years). Primary tumor locations were the oral cavity and the oropharynx, and the main treatment modalities were surgery and adjuvant radiotherapy. A complete cohort characterization is provided Table 3. The protocol aimed to collect at least one, and preferably two, samples per patient across two amounts (5cc and 10cc), and three consistencies: thin or slightly thin liquids (IDDSI 0–1), thick or extremely thick liquids (IDDSI 3–4), and solids (IDDSI 7). The protocol was adjusted as needed when patients were unable to safely swallow the required consistencies. For clinical analysis purposes, some patients were also asked to perform dry swallows. Patients were positioned to ensure visibility of all HRIM sensors, lips, oropharyngeal structures, vocal cords, and cervical vertebrae in the fluoroscopy images (cf. Fig. 2).
Fig. 2
VFSS video frames representative of the standard positioning of patients during simultaneous HRIM and VFSS. All anatomical structures of upper aerodigestive tract are visible, as well as all the manometric sensors in this region
DatasetsSimultaneous VFSS and HRIM data from 12 post-HNC patients were collected under the approval of the NKI-AVL Institutional Review Board (IRBd21–210, IRBd23–322).
Bandicam\(^\) session recordings had an average length of \(14.06 \pm 4.35\) min, with an average exposure time of 3–4 min. An expert manually annotated each recording, marking the onset (start of irradiation) and offset (end of irradiation) of movement segments in the VFSS videos, and classified them as swallow or non-swallow. The dataset included 154 video segments: 97 swallow events, with an average length of \(15.74 \pm 4.76\) s; and 57 non-swallow segments. Furthermore, all 97 swallow events were annotated in the HRIM feed; however, 61 of these were intentionally treated as unannotated to enable validation of the algorithm’s accuracy and clinical relevance. Swallow consistencies (IDDSI levels) were extracted from session reports and linked to their corresponding video segments. This process resulted in a total of 22 IDDSI 0 swallows, 15 IDDSI 1 swallows, 3 IDDSI 2 swallows, 14 IDDSI 3 swallows, 16 IDDSI 4 swallows, 1 IDDSI 5 swallow, 18 IDDSI 7 swallows, and 8 dry swallows.
The true delays between the Bandicam\(^\) recording and the HRIM stream, \(\Delta _}}\), were calculated using a synchronization procedure analogous to the one described in Sect. 2.4, using binary signals generated from the ground-truth (GT) swallow timestamps in each data stream. The reference delay was then defined as the time shift corresponding to the maximum cross-correlation between these two binary signals, under the condition that, after synchronization, the timestamps in both data streams were aligned such that the overlapping swallow labels (i.e., IDDSI levels) corresponded to the same swallow event.
Automatic movement detection in continuous VFSS recordingsAccurate detection of movement segments in VFSS videos is essential for reliable swallow classification. To this end, we proposed an optimized double-sweep OF algorithm based on the Farnebäck dense OF algorithm [19].
Fast optical flow sweepThe Fast OF sweep provided a rough estimate of the video dynamics by sampling frame pairs at a sampling rate, \(\Delta _s\),Footnote 1 and applying the Farnebäck dense OF algorithm [19]. For each flow map, the average intra-pair OF magnitude was calculated.
Dense OF methods capture small motion vectors between static frame pairs caused by small pixel value oscillations that originate from the static noise of video recordings. We estimated this static noise level using a median-based characterization of the average OF magnitudes of all sampled frame pairs. The noise threshold was estimated as the minimum between the median of the third quartile, \(\tilde_\) (cf. Fig.3), and an upper bound, \(U_\).
Fig. 3
Data distribution of the optical flow (OF) magnitudes of a potential movement candidate, used for the determination of the static noise level. \(\text _1\) and \(\text _3\) represent the absolute distances between the distribution’s median, \(\tilde\), and the median of first and third quartiles, \(\tilde_}\) and \(\tilde_}\), respectively
All frame pairs with average OF magnitude below the noise threshold were considered static ("non-movement") frames. To be classified as "movement," frame pairs had to:
1.have an average intra-pair OF magnitude above the noise threshold;
2.be within two sampling periods of another frame-pair classified as "movement."
As shown in Fig. 4, a secondary frame-by-frame OF sweep was implemented to detect the static-dynamic transition frames. This sweep began one sample period (\(\Delta _s\)) before the movement intervals detected on the first OF sweep.
Fig. 4
Selection of analysis interval for the Fine OF sweep, based on the detected movement from the Fast OF sweep. The analysis interval contained the static-dynamic transition frames present in the ground-truth (GT) movement annotation. \(fr_\) represents the sampled frames, at a sample period \(\Delta _s\), and \(fr_\) the GT movement frames
Fine optical flow sweepThe Fine OF sweep analyzed the potential swallow candidates that resulted from the first sweep, to accurately pinpoint their static-dynamic transition frames, and to provide the final swallow candidate estimates. Each potential movement sequence was sampled frame-by-frame, and, as in the Fast OF Sweep, the Farnebäck dense OF algorithm [19] was computed between each pair of frames.
When computing dense OF fields with a shorter frame sampling interval, the average flow magnitudes, representing the overall motion, tend to be smaller. As a result, the previously used noise threshold becomes too high and is no longer suitable for distinguishing true motion from noise, requiring its recalculation. The new noise threshold, \(n_\), was computed using the maximum between the median, \(\tilde\), and an upper bound, \(U_\), alongside the distances between \(\tilde\) and the medians of the first and third quartiles (\(\tilde_\) and \(\tilde_\)), \(d_1\) and \(d_3\), respectively (cf. Fig. 3)(1).
$$\begin n_ = \text (\tilde, U_), & d_3 - d_1 \ge 0.5 \\ \tilde, & \text \end\right. } \end$$
(1)
As in the Fast OF sweep, frame sequences were classified as "movement" if their average OF magnitude exceeded the noise threshold and they occurred within one \(\Delta _s\) of another "movement" frame, ensuring robustness against magnitude fluctuations. Finally, only movement segments longer than double \(\Delta _s\), were considered swallow candidates.
Post-collection synchronization of multi-swallow HRIM and VFSS continuous recordingsTo achieve reliable synchronization of both signals we used a binary cross-correlation algorithm between two binary signals: \(L_\), derived from the real-time HRIM clinician annotations, and \(C_\), derived from the detected swallow candidates of the VFSS recording. The on values of \(L_\) are found between the timestamps of each annotation, while the on values of \(C_\) are found between the timestamps each found swallow candidate.
Generally, during simultaneous HRIM and VFSS, data is sampled at different frequencies. To synchronize corresponding swallows within similar time intervals, both signals were upsampled to a common frequency, \(f_\), chosen to be higher than the native sampling rates of both signals. This step was performed for computational convenience, as upsampling does not lead to data loss and facilitates alignment on a shared time axis.
Cross-correlation was performed using the upsampled HRIM landmark-based binary signal, \(L_\), as the anchor, and the upsampled candidate binary signal, \(C_\), as the sliding signal, each with N samples. Correlation values were evaluated across all positions, k, of the sliding binary signal (\(C_\)), with zero padding and no circular integration. The delay was determined as the \(k^\) position that maximized the correlation measure, \(R_\) (2).
$$\begin R_[k] = \sum _^ L_[n] \cdot C_[n-k], & \text k \ge 0 \\ \sum _^ L_[n] \cdot C_[n-k], & \text k < 0 \end\right. } \end$$
(2)
Classification of movement segments using HRIM pressure dataTo classify swallow candidates as true swallows we used a template-similarity analysis based on pressure distribution from HRIM-annotated swallow events.
Sensor selectionThe analysis was based on data from two pressure sensors in the upper esophageal sphincter (UES). All included patients consistently produced a high-pressure zone in the HRIM pressure contour plot around the UES. Consequently, the two sensors, \(S_1\) and \(S_2\), with the highest overall average pressure values were automatically identified and selected as corresponding to the UES.
Template selectionAfter synchronization, three swallow events annotated during the HRIM acquisition that aligned with swallow candidates detected by the Fine OF sweep were selected as template valid. For each template valid event, the pressure segments, \(p_\) with \(j \in \\}\) and \(i \in \\), recorded by \(S_1\) and \(S_2\), were extracted and pre-processed using mean removal and low-pass filtering. Each \(p_\) was characterized by three sensor-specific parameters: maximum peak-to-peak amplitude (\(A_}\)), absolute mean (\(\mu _}\)), and standard deviation (\(\sigma _}\)). The sensor-specific swallow template, \(T_, S_i}\), was then defined by parameters \(A_}\), \(\mu _}\), and \(\sigma _}\), computed as the normalized averages of the sets of parameters \(\mathbf }} = \}, A_},..., A_,S_i}}\}\), \(\varvec}} = \}, \mu _},..., \mu _, S_i}}\}\), and \(\varvec}} = \}, \sigma _},..., \sigma _, S_i}}\}\) (3).
$$\begin \begin A_}&= \frac \sum _^ A_}[p] - \min (\mathbf }})}}})} \\ \mu _}&= \frac \sum _^ |\mu _}[p]| - \min \varvec}|)}}}}|)} \\ \sigma _}&= \frac \sum _^ \sigma _}[p] - \min (\varvec}})}}})} \end \end$$
(3)
Candidate template-similarity analysisThe initial classification of swallow candidates was based on their temporal correspondence with the three HRIM live annotations selected as template valid. The swallow candidates whose timestamps overlapped with a template valid HRIM swallow event were automatically classified as true swallows.
The remaining swallow candidates (i.e., without overlap) were classified in two steps. First, we extracted and pre-processed the pressure segments \(p_\) for \(m\! \in \! \\}\), from the manometric data of \(S_1\) and \(S_2\) that aligned with the swallow candidate, using the same methods as for the template selection. Each \(p_\) was then summarized in the same three parameters as \(p_\). The normalization step was performed relative to the sets of parameters of the template valid segments, \(\mathbf }}\), \(\varvec}}\), and \(\varvec}}\).
Classification used a weighted normalized loss function, \(\mathcal _\), that compared the normalized parameters of each \(p_\), namely \(A_}\), \(\mu _}\), and \(\sigma _}\), with the ones from \(T_,S_i}\). Additionally, \(\mathcal _\) attributed different weights, \(w_}\), \(w_\) and \(w_\), to each term, providing lower scores to candidates that presented swallow-unfit data distributions, namely lower peak-to-peak amplitudes and standard deviations, and higher absolute mean values (4). The pressure-candidate score was a weighted average of the sensor-specific scores, \(\mathcal _\) and \(\mathcal _\), with corresponding weights \(w_\) and \(w_\). Finally, pressure candidates with scores above the threshold \(t_}\) were classified as true swallows. Candidates scoring below this threshold were pre-eliminated and reclassified as a true swallow, if its absolute overall score drifted more than \(t_}\) from the median of all pre-eliminated candidates, \(\tilde_}\), and if its overall score was greater than \(\tilde_}\).
$$\begin \begin \mathcal _&= w_}(A_} - A_}) - w_(\mu _} - \mu _})\\&\qquad + w_(\sigma _} - \sigma _}) \end \end$$
(4)
Comments (0)