
Remember me
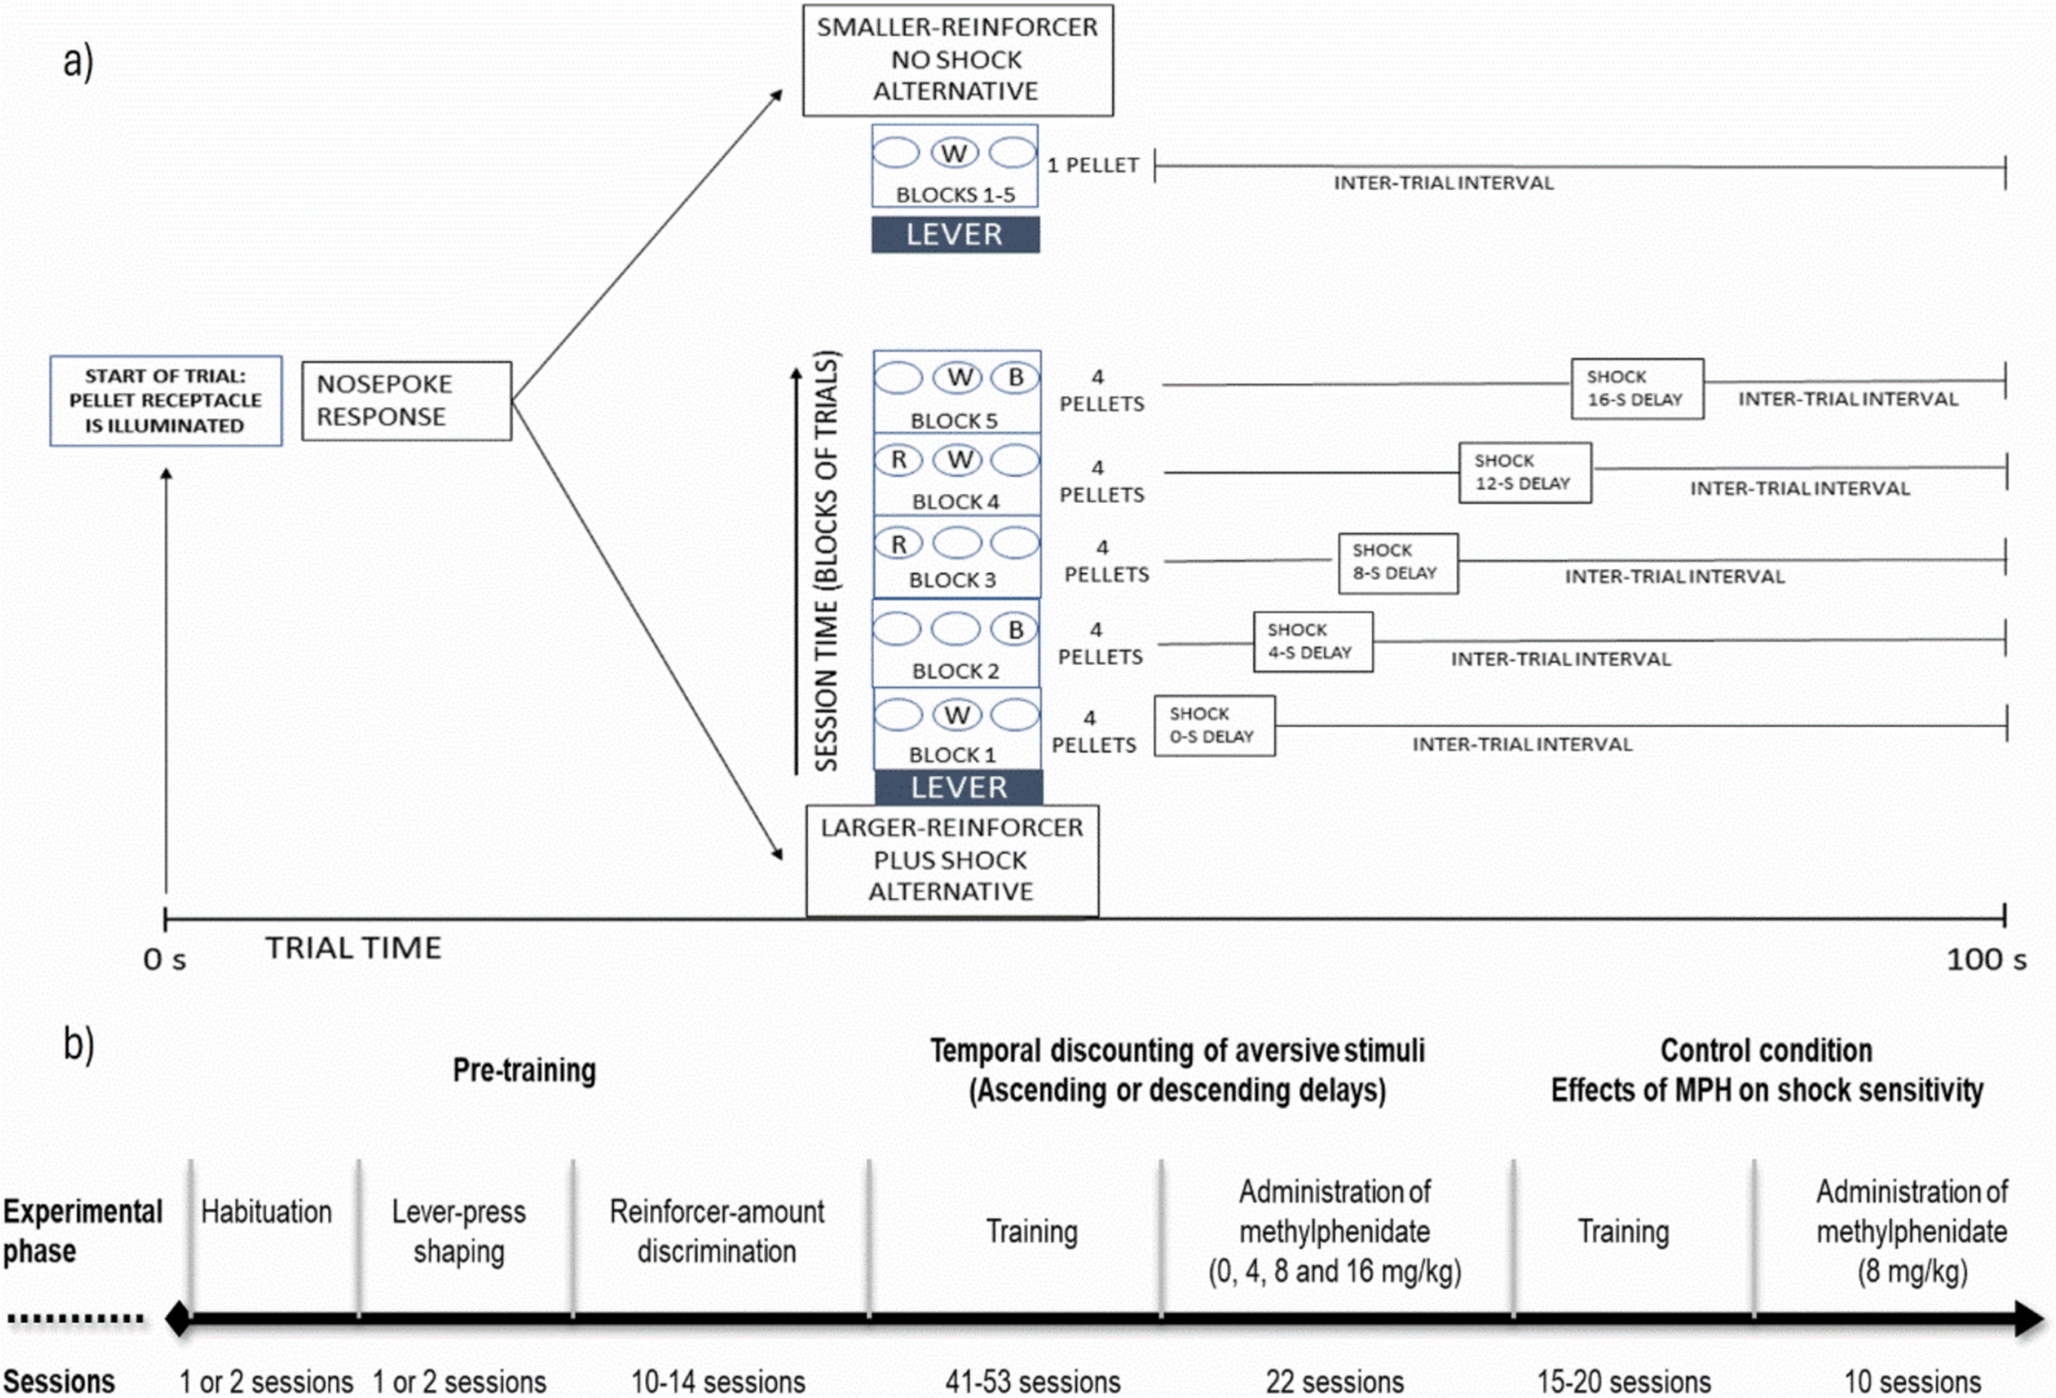
Pretraining
During pretraining, subjects reached the criterion of preference for the larger-amount alternative in 4.93 ± 0.25 sessions, and their final preference was 0.96 ± 0.01 (range 0.90–1). After the position of the alternatives was reversed, subjects recovered their preference for the larger-amount alternative in 6.53 ± 0.19 sessions, with a final preference being 0.95 ± 0.01(range 0.90–1), indicating that all rats discriminated between the different amounts of reinforcement employed. One rat was excluded because it did not reliably press the lever after a considerable number of sessions.
Table 1 Individual data, mean, and SEM of the electric shock intensity (in milliamps, mA) under which each subject achieved stability for the ascending- and descending-delay groups B.Temporal discounting of aversive stimuli
Table 1 shows each group’s mean shock intensity during the sessions with stable data, as well as the values for each subject. The mean intensity for the ascending-delays group was 0.69 ± 0.05 mA, whereas that for the descending-delays group was 0.58 ± 0.04 mA. A t-test found no significant differences between these intensities (t (13) = 1.52, p = 0.15, Cohen’s d = 0.80). Panel a) of Fig. 2 shows, for each group, the proportion of choice (group mean and SEM) for the smaller-amount no-shock alternative as a function of the delay to shock associated with the larger-amount plus shock alternative. In both groups, subjects had a strong preference for the smaller-amount alternative when the delay to shock was 0 and 4 s, but progressively shifted their preference towards the larger-amount plus shock alternative when the delay to shock was increased. An ANOVA reported a significant effect of Delay (F (4, 52) = 303.07, p < 0.001, partial η2 = 0.96). No significant effect of Group or of the Group x Delay interaction were found (F (1, 13) = 0.01, p = 0.92, partial η2 < 0.1 and F (4, 52) = 1.55, p = 0.20, partial η2 = 0.11, respectively), which suggests that the effect of delays on preference was independent of the order in which they were presented. The analysis of the AUC (Fig. 2, panel b) coincides in suggesting a null effect of the order of presentation of delays, as both groups exhibited the same degree of temporal discounting with an average AUC of 0.46.
C.Effect of acute MPH administration on temporal discounting of aversive consequences
Figure 3 shows, for the ascending and descending-delays groups (panels a and b, respectively), the group mean and SEM of the proportion of choice for the smaller-amount-no-shock alternative as a function of the delay to shock, under the effects of each of the MPH doses. Panel (a) shows that, for the ascending-delays group, the vehicle generated a temporal-discounting curve similar to that obtained during baseline. However, a dose-dependent effect of MPH was found, consisting of the increase of preference for the smaller-amount no-shock alternative, which was more evident as delays were longer. This panel excludes data from two subjects that stopped responding under the effects of the 16 mg/kg dose. On the other hand, panel b) shows a similar pattern for the descending-delays group, with the exception that for the 4 and 8 mg/kg doses, a non-monotonic function was observed related to the 12 and 16-s delays.
Fig. 2
Panel a) shows the group mean and standard error of the mean (SEM) for the proportion of choices for the smaller-amount no-shock alternative, plotted against the delay to shock associated with the larger-amount + shock alternative. Filled circles represent data from the ascending-delays group, while unfilled circles represent data from the descending-delays group. The dashed line represents the point at which choice proportion corresponds to 50%. Panel b) represents the mean and SEM of the area under the curve (AUC) calculated from each group’s discounting function
Despite this, the effect of MPH in this group had the same pattern as in the ascending-delays group: a decrease in the preference for the larger-amount plus-shock alternative. The ANOVA determined a non-significant effect of Group (F (1, 11) = 0.09, p = 0.77, partial η2 = 0.008) and a significant effect of Dose (F (3, 33) = 53.97, p < 0.001, partial η2 = 0.83); post hoc analyses indicated that all doses of MPH significantly decreased the preference for the larger-amount plus shock alternative compared to the vehicle (p < 0.01 in all cases). The 4 mg/kg dose exerted a smaller effect on preference than the 8 and 16 mg/kg doses (p < 0.02 in all cases), whereas no difference was observed between the effects of the 8 and 16 mg/kg doses (p = 0.22). These results confirm that MPH decreased the choice of delayed punishments and that this effect was stronger with the 8 and 16 mg/kg doses.
The interaction between Dose and Delay was statistically significant (F (12, 132) = 18.84, p < 0.001, partial η2 = 0.63); the post hoc analysis found that all MPH doses significantly increased the proportion of choices for the 1-pellet, no-shock alternative when delay to shock was 8, 12, and 16 s, compared to when the vehicle was administered (p < 0.001 in all cases). This result suggests that MPH diminished the impact on preference of the delay to shock as a function of its dose. The ANOVA indicated a significant Group × Delay interaction (F (4, 44) = 6.31, p < 0.01, partial η2 = 0.36); close examination of the post-hoc results showed that although for each delay there were no significant differences between groups, the interaction was significant because for the descending-delays group, there was a significant difference between the 4-s and 8-s delays (p < 0.01), while no difference between these delays was observed for the ascending-delays group (p = 0.057). The interaction between Group x Dose x Delay was also significant (F (12, 132) = 2.79, p < 0.01, partial η2 = 0.20); according to the post-hoc tests, this occurred because for the 4 mg/kg dose, the ascending-delays group showed a smaller preference for the smaller-amount no-shock alternative than the descending-delays group only when shock was delayed 16 s (p = 0.036). Additionally, the AUC obtained under MPH administration was analyzed (panel c). The degree of temporal discounting gradually decreased as an inverse function of MPH dose. The ANOVA showed a significant effect of Dose (F (3, 33) = 50.38, p < 0.001, partial η2 = 0.82) and the post-hoc tests indicated that, with the 4, 8 and 16 mg/kg doses, the degree of temporal discounting was lower compared to the vehicle (p < 0.001 in all cases), it was also found that the 4 mg/kg dose caused a smaller diminution, compared to the 8 and 16 mg/kg doses (p < 0.009 in both cases). As was the case with the analysis of the proportion of choice, the 8 mg/kg and 16 mg/kg doses did not exert differential effects (p = 0.32). Furthermore, this effect on the degree of temporal discounting was not influenced by the order of the delays, as indicated by the non-significant effects of Group (F (1, 11) = 0.53, p = 0.48, partial η2 = 0.046) and of the Group x Dose interaction (F (3, 33) = 0.59, p = 0.63, partial η2 = 0.05).
Fig. 3
Panels a) and b) depict the group mean and standard error of the mean (SEM) for the proportion of choice for the smaller-amount no-shock alternative as a function of the delay to shock associated with the larger-amount plus shock alternative, separated by MPH dose for both the ascending and descending delay groups, respectively. In these panels, filled circles represent the vehicle, unfilled triangles the 4 mg/kg dose; unfilled squares the 8 mg/kg dose, and crossed hexagons the 16 mg/kg dose. The dashed line represents the point at which choice proportion corresponds to 50%. Panel c) presents the mean and SEM of the area under the curve (AUC) obtained under the influence of the vehicle and each MPH dose. Black bars represent data from the ascending-delays group, while gray bars represent data from the descending-delays group
D.Omissions to the pellet-receptacle and the levers during free-choice trials
The ANOVA showed that Group was not statistically significant (F (1, 11) = 0.14, p = 0.71, partial η2 = 0.01). Dose showed statistically significant effects (F (2, 22) = 22.74, p < 0.05, partial η2 = 0.67) and post-hoc analysis indicated that the 2.7% of omissions observed for the 16 mg/kg dose was significantly higher than that observed for both 4 (0.26%) and 8 mg/kg (0.38%) doses (p’s < 0.01). Four mg/kg and 8 mg/kg doses were not significantly different from each other (p = 0.94). The interaction between Group and Dose was not significant (F (2, 22) = 1.21, p = 0.32, partial η2 = 0.01).
In regard to omitted trials when the levers were presented, we found an even lower level of omissions, being no more than 0.7%. The ANOVA showed that Group and Dose were not significant (F (1, 11) = 0.33, p = 0.58, partial η2 = 0.03, and F (2, 22) = 1.25, p = 0.31, partial η2 = 0.10, respectively). The interaction between Group and Dose was also not significant (F (2, 22) = 0.65, p = 0.53, partial η2 = 0.05). The conjoint pattern of feeder omissions and lever omissions suggests that, in general, MPH did not modify in a significant way rats’ performance in the discounting task.
Table 2 Mean (± standard error) percentage of omissions during choice trials and at the pellet receptacle for each MPH dose, in both ascending and descending delay groups E.No-delay shock condition
In the no-delay shock condition, the mean shock intensity during MPH administration was 0.46 ± 0.04. The baseline proportion of choice (approximately 0.5) was not affected by the 8 mg/kg dose (see Fig. 4). An ANOVA reported no significant effects of Drug (F (1, 6) = 0.60, p = 0.47, partial η2 = 0.09), Block of trials (F (4, 24) = 0.33, p = 0.85, partial η2 = 0.05) or the Drug x Block of Trials interaction (F (4, 24) = 0.94, p = 0.98, partial η2 = 0.01).
Fig. 4
The group mean and standard error of the mean (SEM) for the proportion of choice for the larger-amount plus shock alternative presented across the different blocks of trials. Filled circles represent data collected with vehicle administration, while unfilled circles represent data collected with 8 mg/kg administration. The dashed line represents the point at which the choice proportion corresponds to 50%
Comments (0)