Cardiopulmonary Exercise Test (CPET)
All patients performed a maximal, symptom-limited treadmill CPET (Woodway GmbH, Weil am Rhein, Germany), predominantly following the Oslo protocol, which involves stepwise increases in speed and incline [13]. Tests were considered maximal when participants were unable to continue despite extensive encouragement, supported by a respiratory exchange ratio (RER) ≥ 1.05. Tests were supervised by an experienced exercise physiologist or physiotherapist, together with a physician. Gas exchange was measured breath-by-breath using a two-way mask (7540 series; Hans Rudolph, Inc., Shawnee, KS, USA) connected to a MasterScreen CPX metabolic system (Jaeger Medical GmbH, Hoechberg, Germany). Heart rate (HR) was recorded via a 12-lead ECG system (Custo Cardio 100, CustoMed GmbH, Ottobrunn, Germany). Peripheral oxygen saturation (SpO₂) was measured at rest and continuously during CPET using a finger pulse oximeter. Calibrations were performed according to manufacturer recommendations, and analyses were conducted using Vyntus CPX Sentry Suite software (version 3.0.11).
Heart Catheterization
Comprehensive heart catheterization was performed as previously described [11]. In short, a full hemodynamic assessment with pressure measurements from all relevant locations was performed. Hemodynamic assessments were performed as triplet pressure measurements using liquid-filled catheters after blood sampling from each of the following locations: descending aorta, ascending aorta, ventricular cavity, superior vena cava, right pulmonary artery, left pulmonary artery, inferior vena cava, bilateral pulmonary wedge position, and hepatic venous wedge position. All pressure readings were obtained at the end of expiration, from maximum pressures in patients with spontaneous breathing and from minimum pressures in ventilated patients. The following hemodynamic variables were obtained: ventricular end-diastolic pressure (VEDP), central venous pressure (CVP), and the transpulmonary pressure gradient (TPG). VEDP and TPG were included in the regression analysis as markers of ventricular filling pressure and pulmonary vascular resistance, respectively, relevant to circulatory efficiency in Fontan physiology.
Anthropometry
Height and weight were measured using calibrated equipment with participants wearing light clothing and no shoes. Body mass index (BMI) was calculated as body mass divided by height squared (kg.m− 2). Height was included in the regression analysis as a covariate reflecting somatic growth, which has been associated with long-term outcomes in Fontan circulation, whereas weight and BMI were considered descriptive variables.
Pulmonary Function
Pulmonary function testing included spirometry, single-breath diffusing capacity of the lung for carbon monoxide (DLCO), and body plethysmography. All measurements were performed seated using the Jaeger MasterScreen PFT Pro system (CareFusion, Hoechberg, Germany), operated by trained respiratory personnel. A disposable mouthpiece with integrated bacterial/viral filter (Spirobach, Tyco Healthcare, Italy) was used. DLCO measurements used a 10-s breath-hold, required inspiratory volume ≥ 85% of FVC [14], and were corrected for hemoglobin concentration. The following variables were analyzed: spirometry: FEV1, FVC; body plethysmography: total lung capacity (TLC), residual volume (RV) and alveolar volume (VA); and diffusing capacity: DLCO and DLCO/VA. Of these, DLCO/VA was included in the regression analysis as an index of alveolar-capillary transfer efficiency. This measure reflects gas transfer efficiency independent of lung volume, which is particularly relevant in Fontan patients who commonly exhibit reduced lung volumes. In contrast, DLCO and static lung volumes are more strongly influenced by lung size and overall lung volume.
Echocardiography
Transthoracic echocardiography was performed in the left decubital position at rest. All recordings were obtained with a Vivid E9 ultrasound scanner and saved digitally for offline analysis with Echopac software, version 204 (GE Vingmed Ultrasound Healthcare, Horten, Norway). The complete echocardiographic protocol in the project has been described previously [15].
Data Handling
Peak oxygen uptake (V̇O₂peak) was the primary CPET outcome, expressed in absolute terms (mL·min⁻¹) and normalized to body mass (mL·kg⁻¹·min⁻¹). Gas exchange variables and minute ventilation (V̇E) were averaged over 30-second intervals. Oxygen pulse was defined as V̇O₂peak (in milliliters) divided by peak HR. Fontan-specific reference values were used to calculate percent-predicted values for various CPET variables [12]. Additionally, reference values for healthy adolescents were used to calculate percent-predicted V̇O₂peak [16]. Ventilatory threshold was identified using a combined approach (the ventilatory equivalent and V-slope methods) by two independent investigators experienced in pediatric CPET [17]. If determinations differed beyond a clinically meaningful margin, the value was excluded. The VE/VCO₂ slope was calculated from the linear relationship between V̇E and CO₂ output, excluding data beyond the respiratory compensation point [17]. Exercise oscillatory ventilation (EOV) was defined using the Kremser-Corrà criteria: regular oscillations in ventilation during exercise with amplitude ≥ 15% of resting VE lasting ≥ 60% of exercise duration [18, 19].
The transpulmonary pressure gradient (TPG) was calculated as the difference between pressures in the inferior vena cava (central venous pressure, CVP) and the ventricular cavity in end-diastole (VEDP).
Height-for-age and BMI-for-age z-scores were calculated using WHO growth references for children and adolescents [20].
All pulmonary function measurements were conducted in accordance with American Thoracic Society and European Respiratory Society (ATS/ERS) guidelines [14, 21, 22]. An obstructive ventilatory pattern was defined as an FEV1/FVC <−1.64 z-score, corresponding to the lower limit of normal (LLN) [23]. A restrictive ventilatory pattern was defined as a total lung capacity (TLC) <−1.64 z-score (LLN) with normal or elevated FEV1/FVC. Predicted values were derived from Global Lung Initiative reference equations. [22,23,24]. Maximal voluntary ventilation (MVV) was estimated by FEV1 × 40. Breathing reserve (%) was calculated using the following equation: (MVV-V̇E)/MVV.100.
Statistical Analysis
Continuous variables are presented as mean, median, and interquartile range (Q1-Q3). Categorical variables are reported as counts and percentages.
Univariable linear regression analyses were performed to examine the individual associations between each candidate predictor and V̇O₂peak. Variables were subsequently entered into multivariable regression models based on predefined clinical relevance and study aims. Two multivariable linear regression models were constructed to evaluate the association of preselected physiological variables (VEDP, TPG, height and DLCO/VA) with CRF, expressed either as absolute V̇O₂peak (mL.min−1) or relative V̇O₂peak (mL.kg−1.min−1). Selection of predictors was based on clinical relevance and prior findings in the literature [11, 12].
To identify physiological predictors of EOV, logistic regression was performed including V̇O₂peak (mL.min−1), CVP and TLC (% of predicted) as independent variables. Results are presented as odds ratios with 95% confidence intervals.
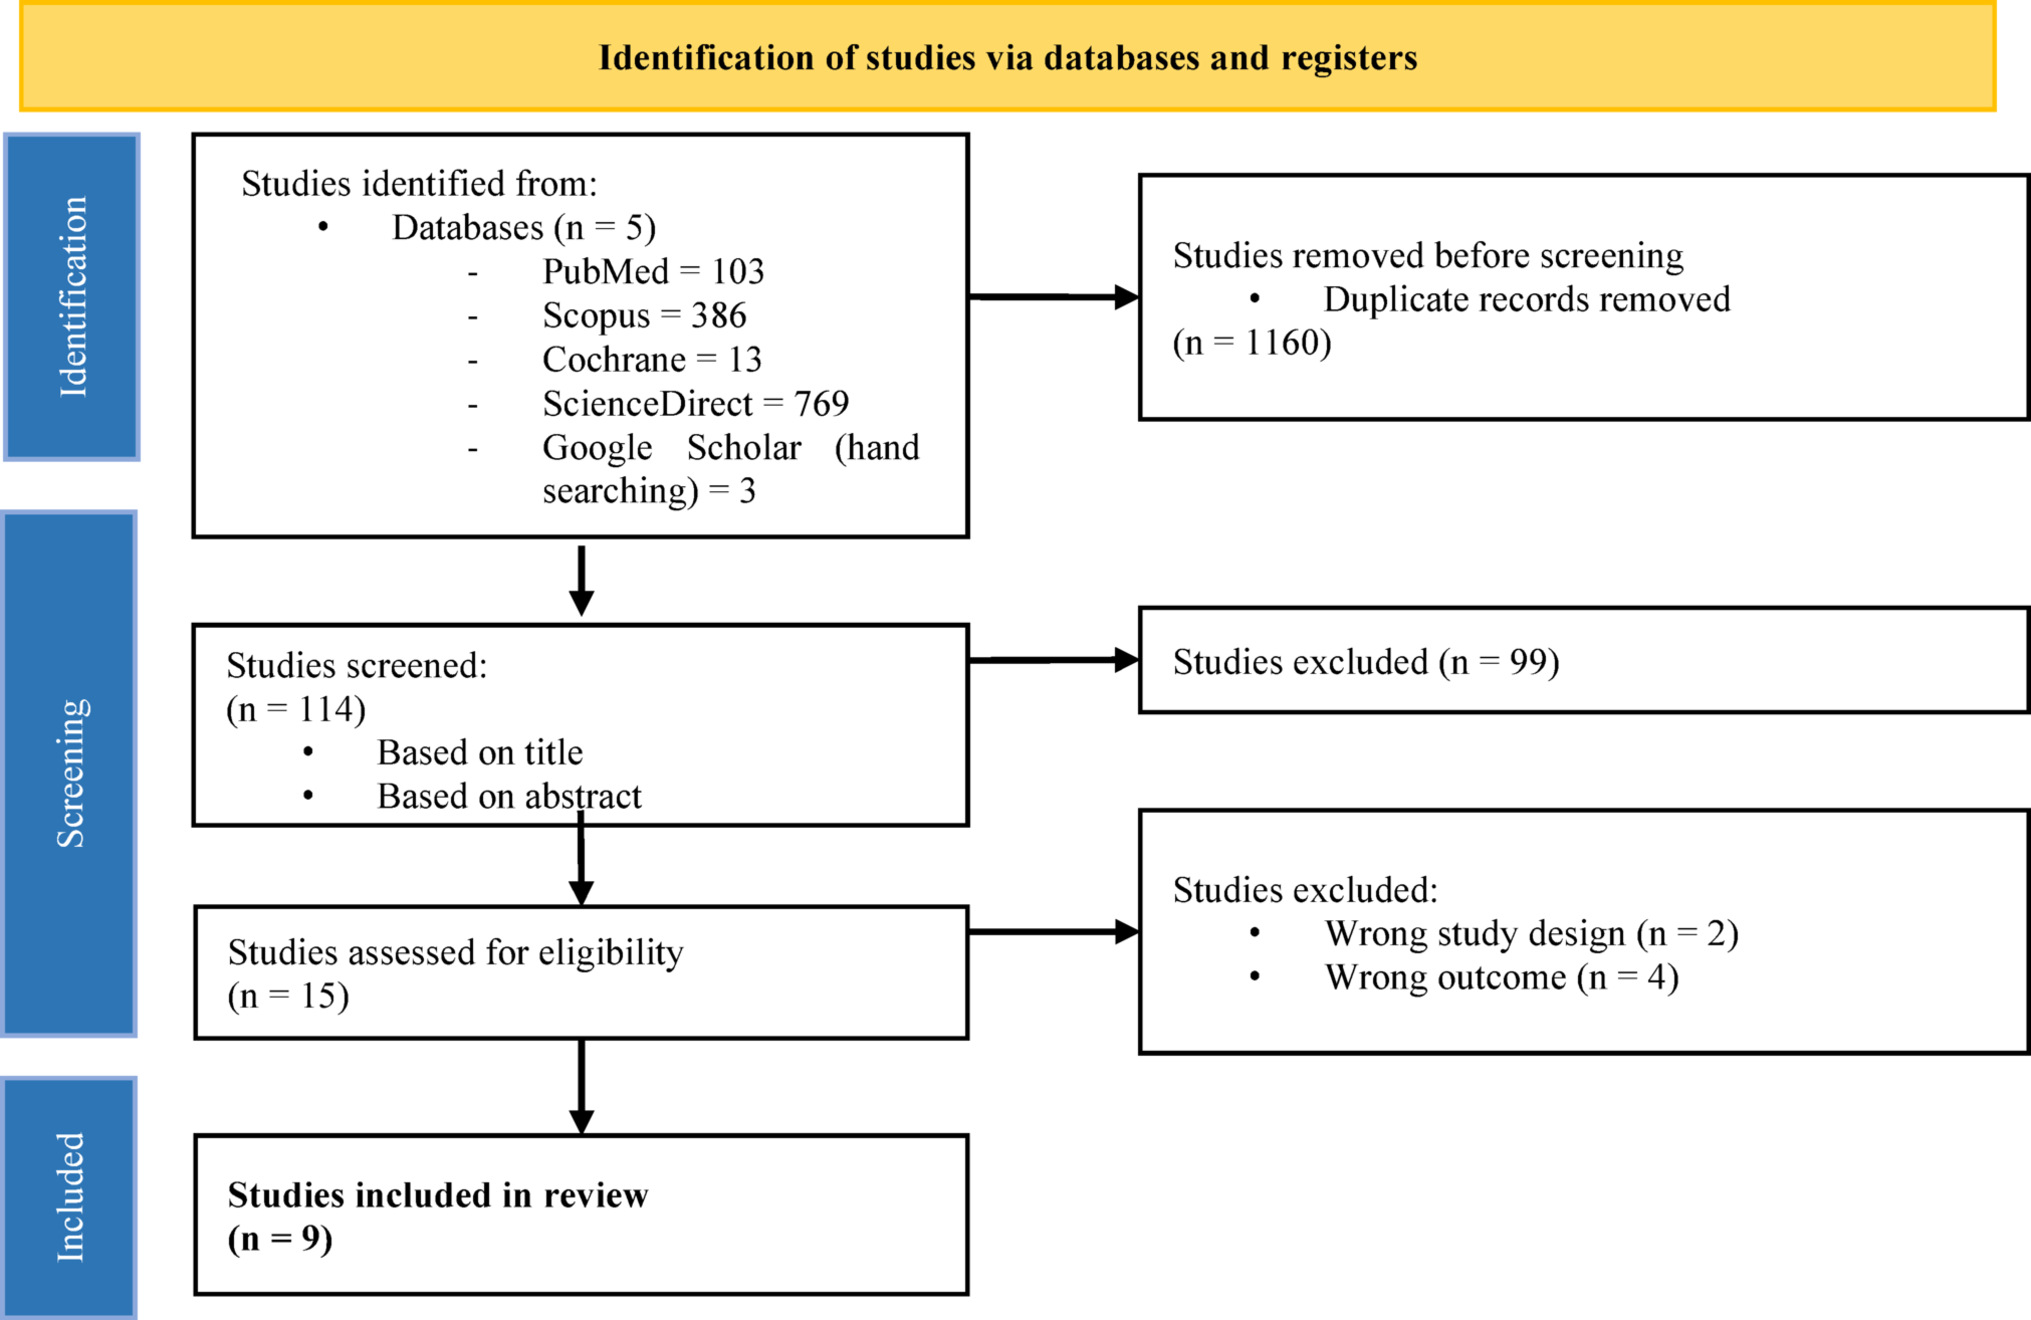
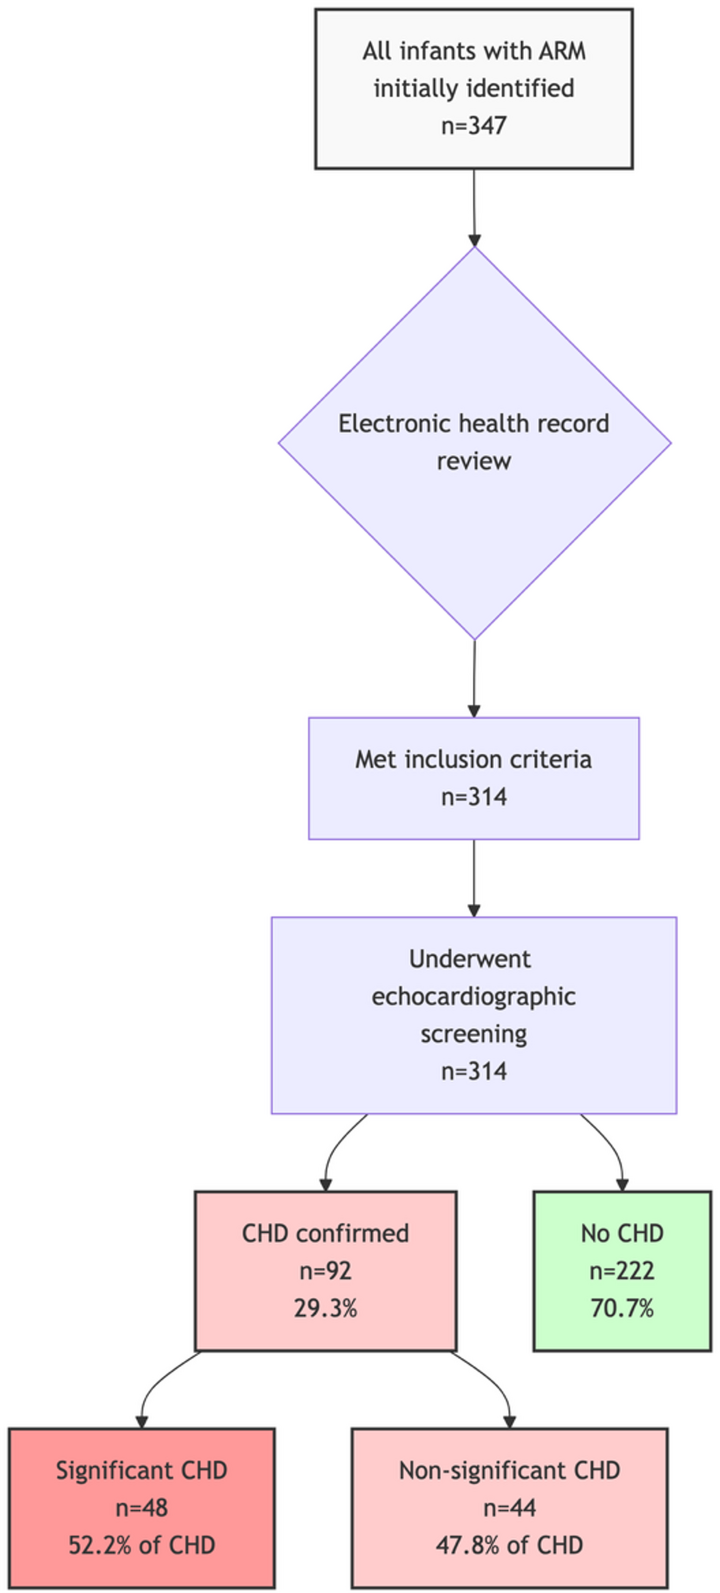
All analyses were based on complete cases (Fig. 1). Missing data was related to incomplete testing and were considered plausibly missing at random. Bias-corrected and accelerated (BCa) bootstrap 95% confidence intervals (1000 replications) were calculated for adjusted R2 of each multivariable linear regression models. Multicollinearity was assessed using variance inflation factors. Normality of residuals were evaluated using Q-Q plots. Statistical significance was defined as p < 0.05. Analyses were performed using STATA version 17.0 (StataCorp, College Station, Texas, USA).


Comments (0)